Capital Budgeting Analysis Report: Pinto Limited Finance Project

Verified

Added on  2021/05/31

|10
|1525
|56
Report
AI Summary
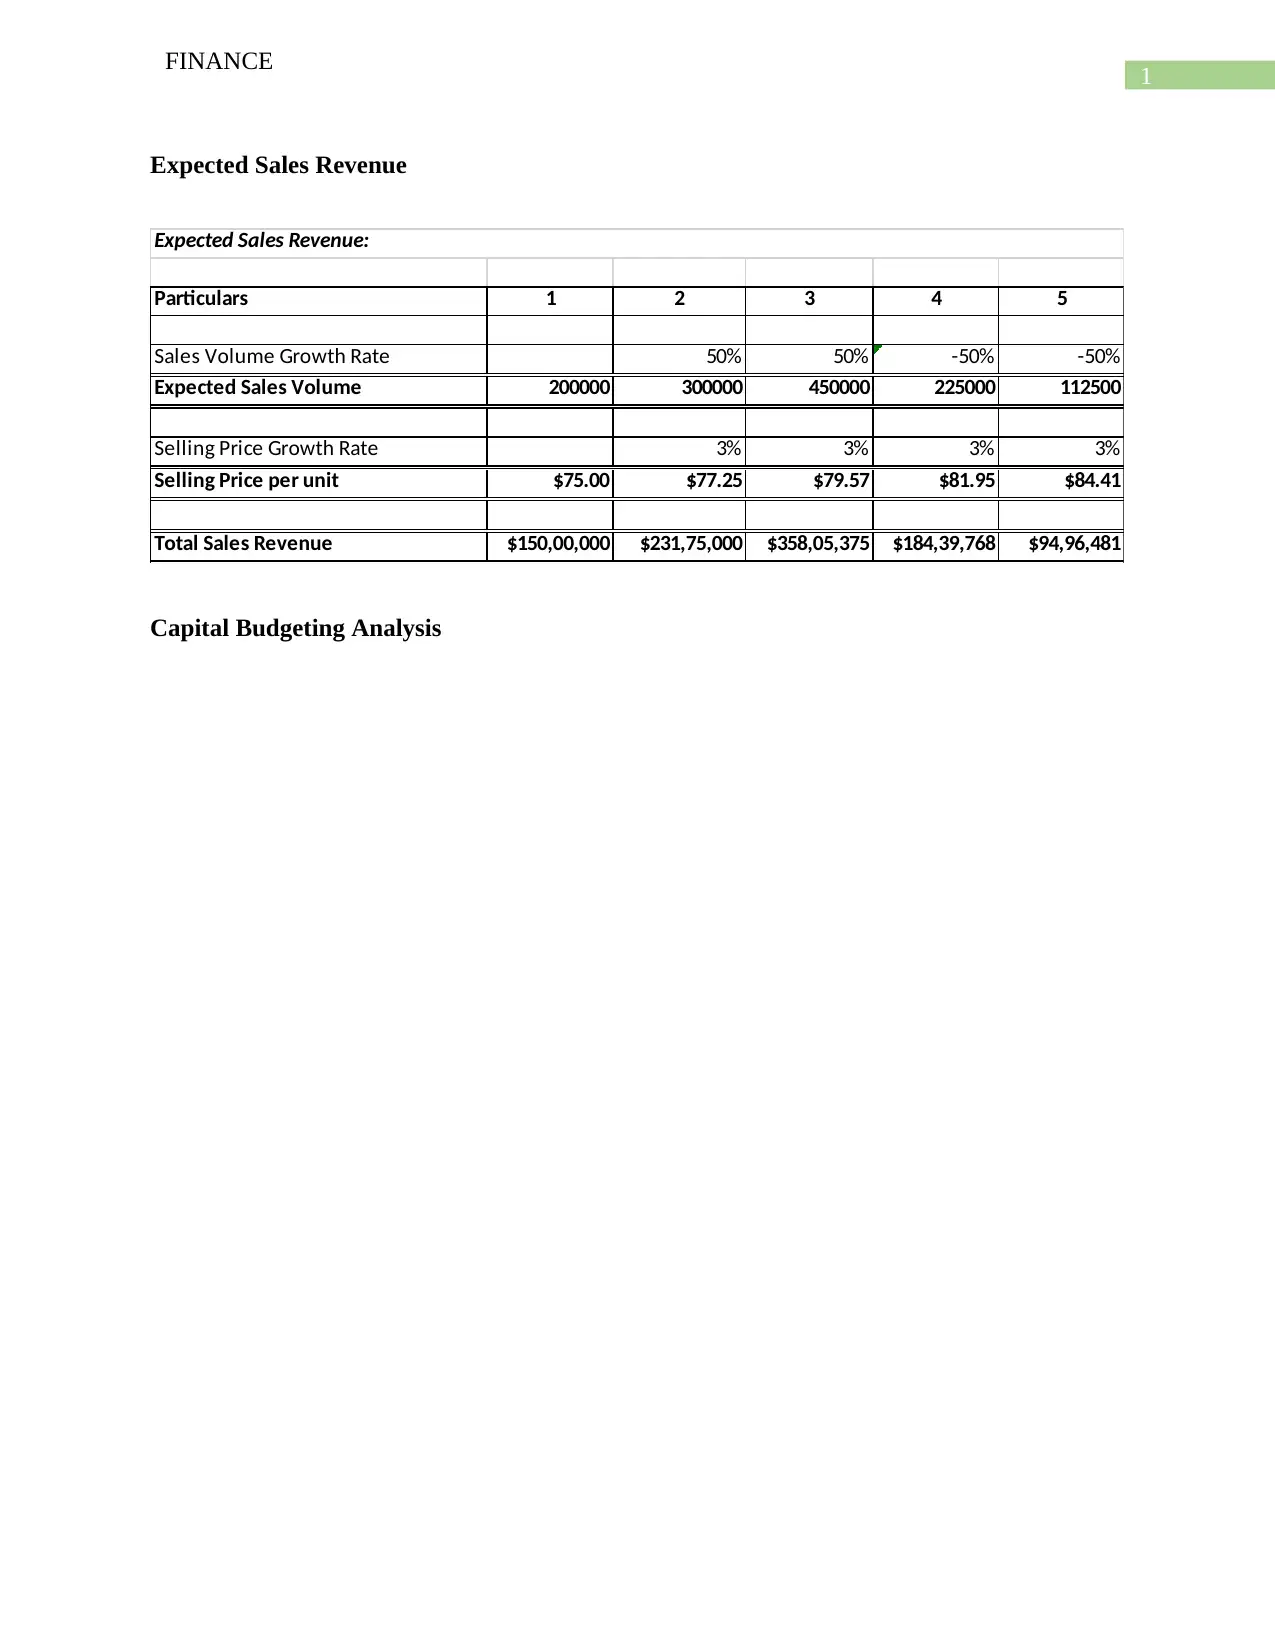
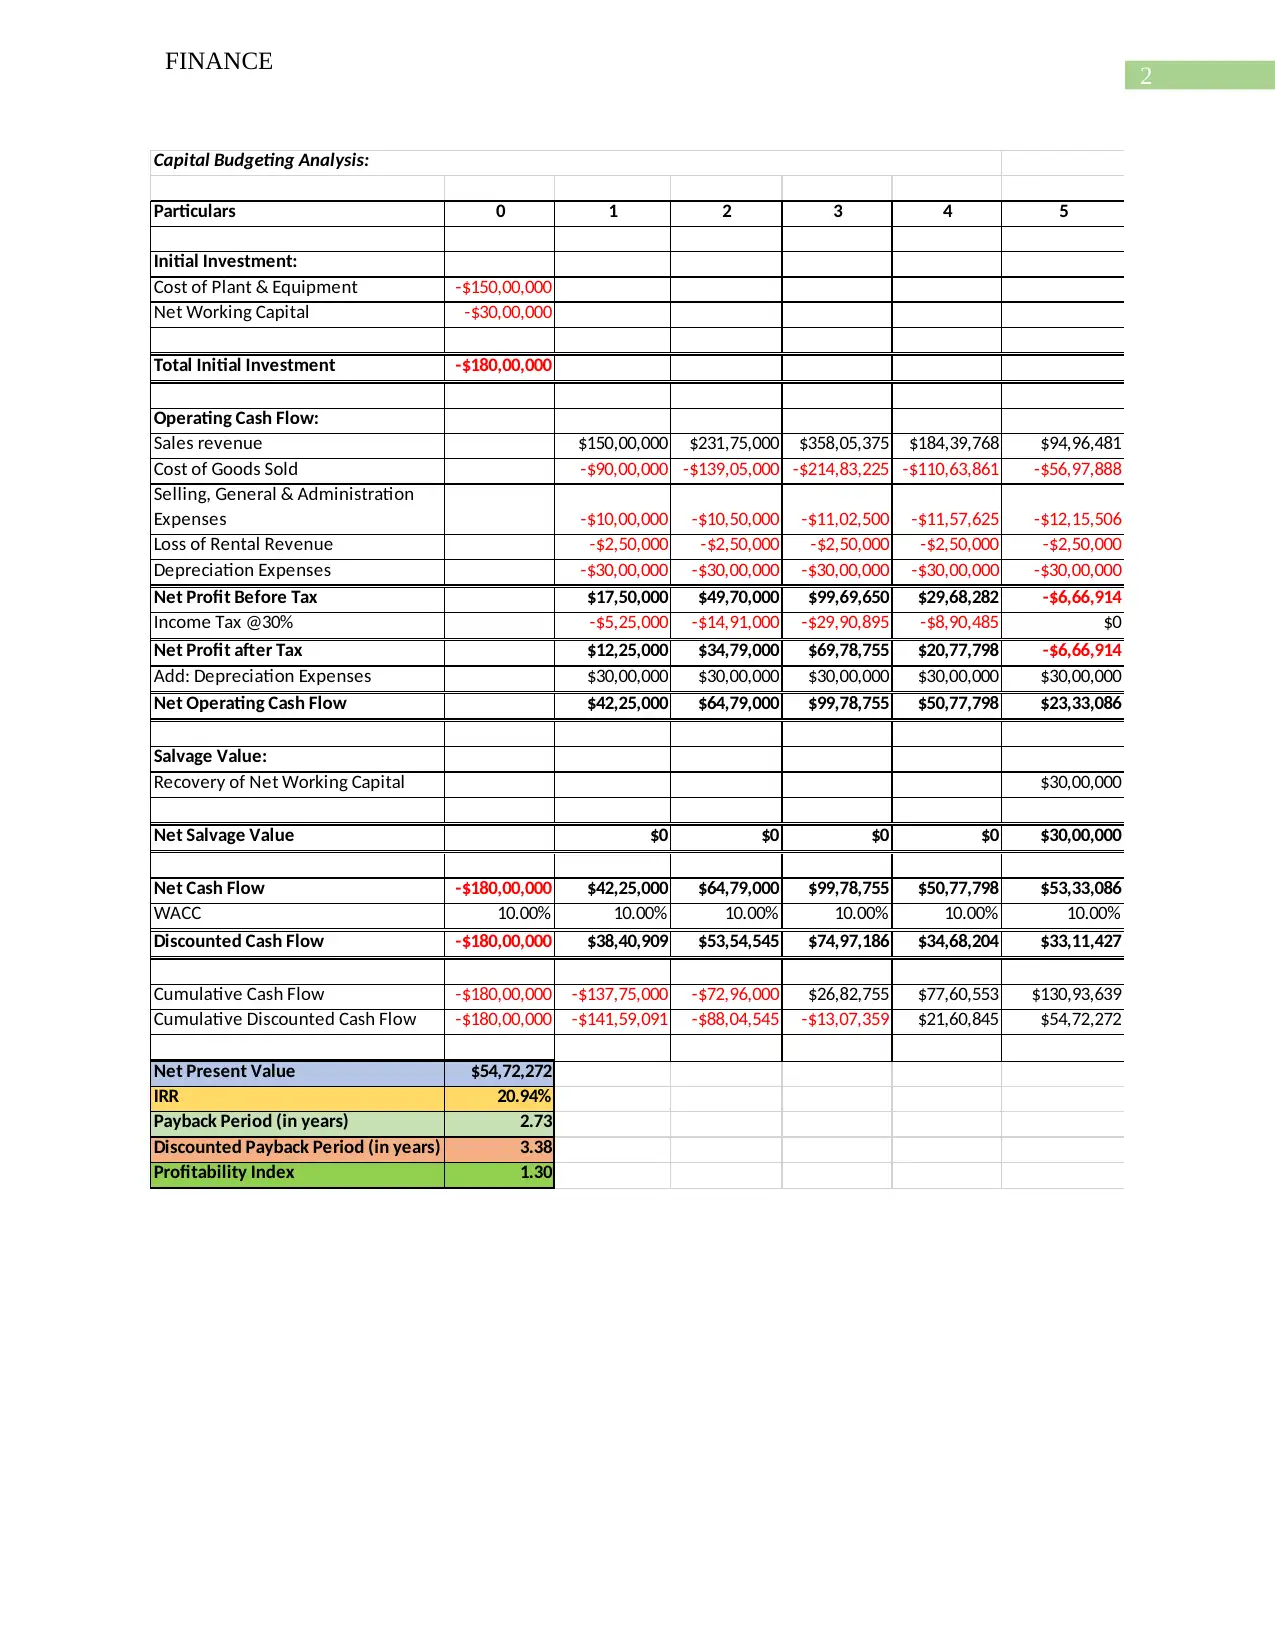
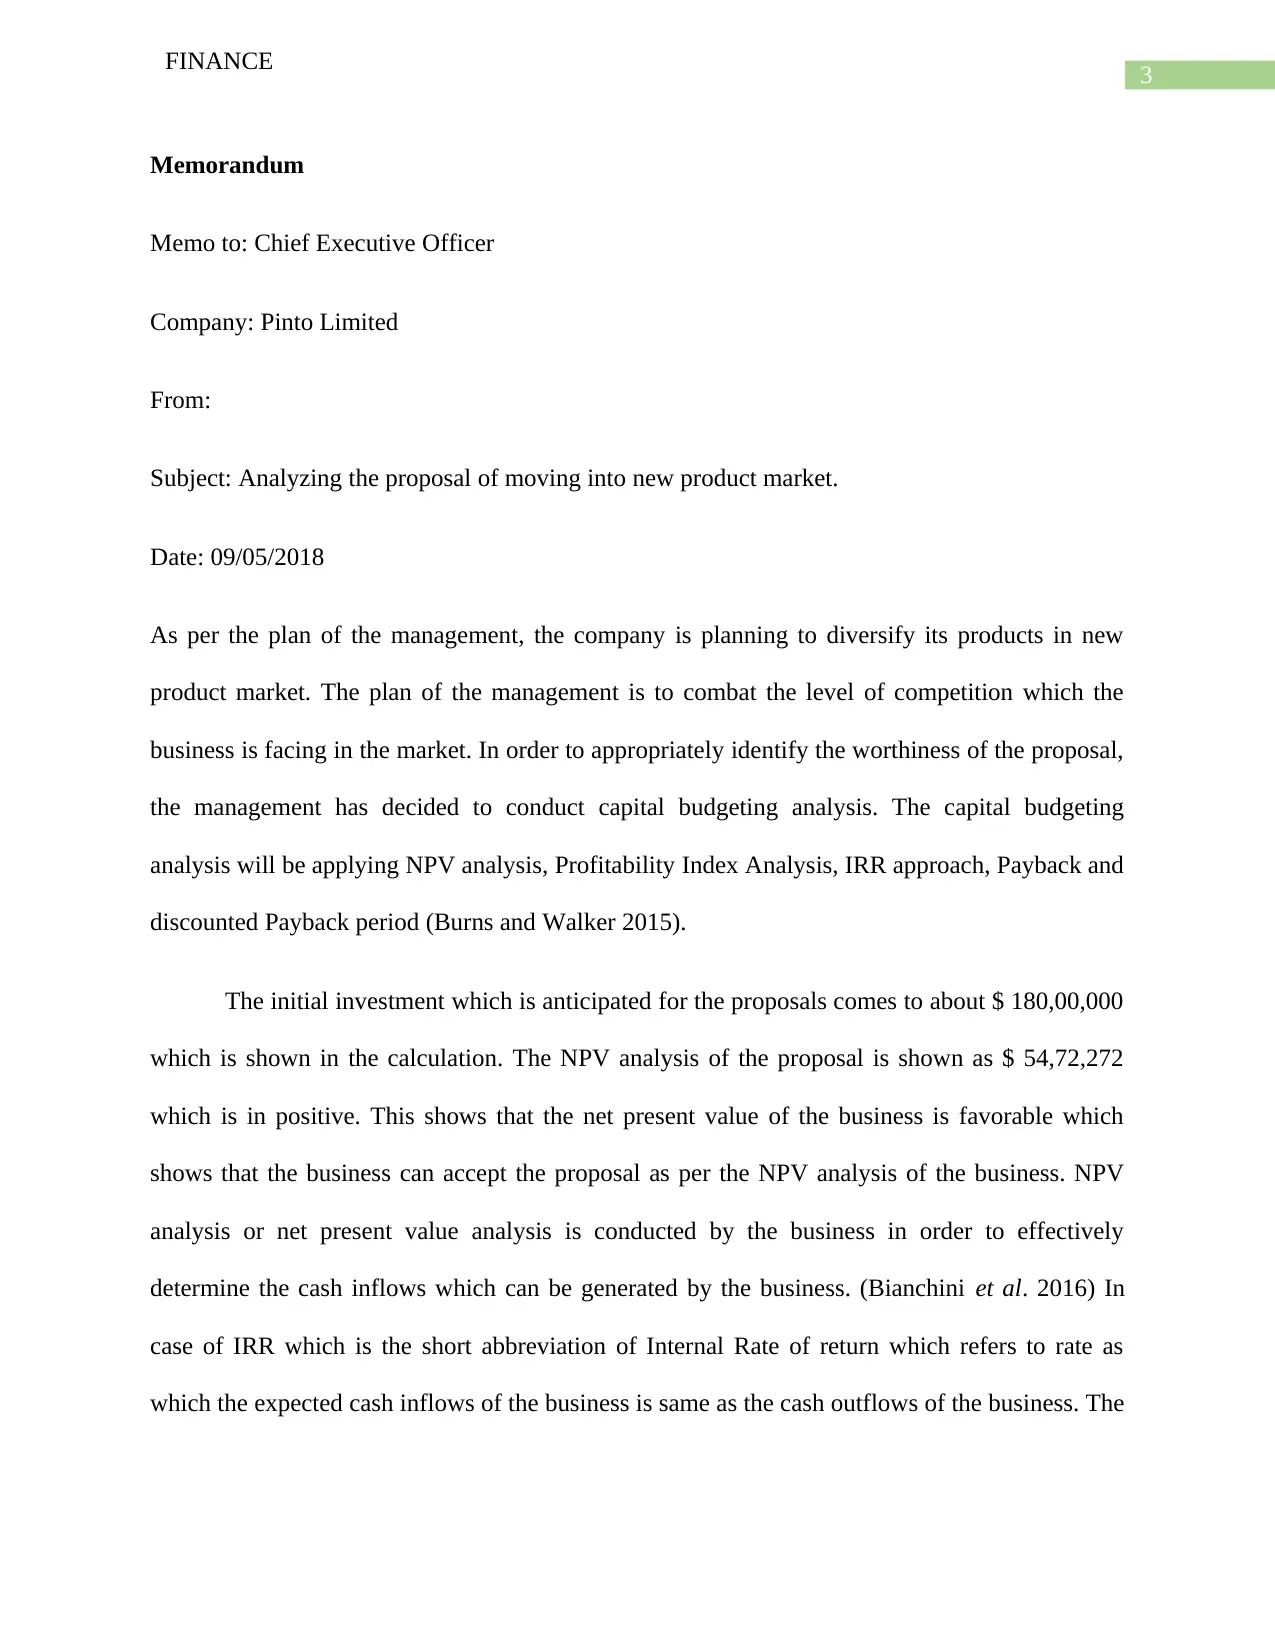
This report presents a comprehensive capital budgeting analysis conducted for Pinto Limited, evaluating the financial feasibility of entering a new product market. The analysis employs several key techniques, including Net Present Value (NPV), Internal Rate of Return (IRR), Profitability Index, Payback Period, and Discounted Payback Period. The initial investment is estimated at $180,00,000. The NPV analysis reveals a positive value of $54,72,272, indicating a favorable investment. The IRR is high, suggesting attractive returns. The Profitability Index is at 20.94%, and the payback periods are 2.73 years (normal) and 3.58 years (discounted), all supporting the proposal's viability. Scenario and sensitivity analyses are also provided, considering optimistic and pessimistic scenarios, along with a sensitivity analysis graph. The report concludes with recommendations for the CEO, advising the acceptance and implementation of the new product market development plan. It also suggests market research and cost reduction measures. The analysis is based on several assumptions including a constant cost of capital of 10% and a 30,00,000 salvage value at the end of the five years.
tabler-icon-diamond-filled.svg

Contribute Materials

Your contribution can guide someone’s learning journey. Share your documents today.
Document Page
Running head: FINANCE
Finance
Name of the Student:
Name of the University:
Author’s Note
tabler-icon-diamond-filled.svg

Secure Best Marks with AI Grader

Need help grading? Try our AI Grader for instant feedback on your assignments.
Document Page
1
FINANCE
Expected Sales Revenue
Particulars 1 2 3 4 5
Sales Volume Growth Rate 50% 50% -50% -50%
Expected Sales Volume 200000 300000 450000 225000 112500
Selling Price Growth Rate 3% 3% 3% 3%
Selling Price per unit $75.00 $77.25 $79.57 $81.95 $84.41
Total Sales Revenue $150,00,000 $231,75,000 $358,05,375 $184,39,768 $94,96,481
Expected Sales Revenue:
Capital Budgeting Analysis
Document Page
2
FINANCE
Particulars 0 1 2 3 4 5
Initial Investment:
Cost of Plant & Equipment -$150,00,000
Net Working Capital -$30,00,000
Total Initial Investment -$180,00,000
Operating Cash Flow:
Sales revenue $150,00,000 $231,75,000 $358,05,375 $184,39,768 $94,96,481
Cost of Goods Sold -$90,00,000 -$139,05,000 -$214,83,225 -$110,63,861 -$56,97,888
Selling, General & Administration
Expenses -$10,00,000 -$10,50,000 -$11,02,500 -$11,57,625 -$12,15,506
Loss of Rental Revenue -$2,50,000 -$2,50,000 -$2,50,000 -$2,50,000 -$2,50,000
Depreciation Expenses -$30,00,000 -$30,00,000 -$30,00,000 -$30,00,000 -$30,00,000
Net Profit Before Tax $17,50,000 $49,70,000 $99,69,650 $29,68,282 -$6,66,914
Income Tax @30% -$5,25,000 -$14,91,000 -$29,90,895 -$8,90,485 $0
Net Profit after Tax $12,25,000 $34,79,000 $69,78,755 $20,77,798 -$6,66,914
Add: Depreciation Expenses $30,00,000 $30,00,000 $30,00,000 $30,00,000 $30,00,000
Net Operating Cash Flow $42,25,000 $64,79,000 $99,78,755 $50,77,798 $23,33,086
Salvage Value:
Recovery of Net Working Capital $30,00,000
Net Salvage Value $0 $0 $0 $0 $30,00,000
Net Cash Flow -$180,00,000 $42,25,000 $64,79,000 $99,78,755 $50,77,798 $53,33,086
WACC 10.00% 10.00% 10.00% 10.00% 10.00% 10.00%
Discounted Cash Flow -$180,00,000 $38,40,909 $53,54,545 $74,97,186 $34,68,204 $33,11,427
Cumulative Cash Flow -$180,00,000 -$137,75,000 -$72,96,000 $26,82,755 $77,60,553 $130,93,639
Cumulative Discounted Cash Flow -$180,00,000 -$141,59,091 -$88,04,545 -$13,07,359 $21,60,845 $54,72,272
Net Present Value $54,72,272
IRR 20.94%
Payback Period (in years) 2.73
Discounted Payback Period (in years) 3.38
Profitability Index 1.30
Capital Budgeting Analysis:
Document Page
3
FINANCE
Memorandum
Memo to: Chief Executive Officer
Company: Pinto Limited
From:
Subject: Analyzing the proposal of moving into new product market.
Date: 09/05/2018
As per the plan of the management, the company is planning to diversify its products in new
product market. The plan of the management is to combat the level of competition which the
business is facing in the market. In order to appropriately identify the worthiness of the proposal,
the management has decided to conduct capital budgeting analysis. The capital budgeting
analysis will be applying NPV analysis, Profitability Index Analysis, IRR approach, Payback and
discounted Payback period (Burns and Walker 2015).
The initial investment which is anticipated for the proposals comes to about $ 180,00,000
which is shown in the calculation. The NPV analysis of the proposal is shown as $ 54,72,272
which is in positive. This shows that the net present value of the business is favorable which
shows that the business can accept the proposal as per the NPV analysis of the business. NPV
analysis or net present value analysis is conducted by the business in order to effectively
determine the cash inflows which can be generated by the business. (Bianchini et al. 2016) In
case of IRR which is the short abbreviation of Internal Rate of return which refers to rate as
which the expected cash inflows of the business is same as the cash outflows of the business. The
tabler-icon-diamond-filled.svg

Secure Best Marks with AI Grader

Need help grading? Try our AI Grader for instant feedback on your assignments.
Document Page
4
FINANCE
IRR of the proposal which is shown in the above table suggest that the business has significantly
high IRR which can be considered to be favorable for the business (Moten Jr and Thron 2013).
In case of profitability Index which measures the profitability of the project on the basis
of the net cash inflows and cash outflows of the business. The profitability index shows that the
result for the period in terms of profitability is shown as 20.94% which is significantly high
which shows that the company is performing well (Daskalakis 2013). The payback period refers
to the minimum time which is taken by the management to recover the initial investment which
is made by the business for the particular project (San Ong and Thum 2013). Discounted
payback period is similar to payback period, the only difference is that the discounted payback
period considered the discounting factor which is associated with the project. The payback
period which is calculated for new proposal is shown to be 2.73 years which means that in not
more than 3 years, the business will be able to recover the initial investment which the
management of the business made in such a project. Similarly, the discounted pay back period
which is shown in the calculation which is shown above, the discounted payback period is 3.58
years which is more than the estimated normal payback period of the business. Thus, from
conducting the various techniques which are used in capital budgeting, it is clear that the
proposal which Pinto ltd wants to pursue in the next few years is a sound one as the NPV
analysis proves that the business will be earning positive cash inflows in future if the business
follows such a proposal. In addition to this, the profitability index shows that the business will be
profitable even if it follows the proposal of new product market development as the anticipated
net cash inflows are more than the anticipated cash outflows of the business. The IRR of the
business is also favorable which is confirms that the business will be earning regulars returns
from the proposal plan (Guerra, Magni and Stefanini 2014). The payback period and discounted
Document Page
5
FINANCE
payback period of the business also show favorable results as the initial investment is anticipated
to be recovered with in a period of 3 years (Maroušek et al. 2015). Thus, from the analysis of the
above, it is suggested that Pinto limited should adopt the product development plan for a new
market and it is anticipated to be profitable for the business and also generate returns which are
also favorable.
Scenario Analysis
Optimistic Scenario
If the business follows the optimistic approach than the Net present value which can be
generated by the business is shown to be $ 128,22,273. The unit of sales growth is shown to be
70% for 1st and 2nd year as shown in the table below.
Pessimistic Scenario
As per this scenario the net present value of the company is estimated to be $ 14,39,907
which shows a unit growth rate of $ 35% which is shown in the table below.
Scenario Analysis
Current Values: Optimistic Scenario Pesimistic Scenario
Selling Price Growth 3% 4% 2%
1st Yr. Sales Volume Growth 50% 70% 35%
2nd Yr. Sales Volume Growth 50% 70% 35%
3rd Yr. Sales Volume Growth -50% -40% -55%
4th Yr. Sales Volume Growth -50% -40% -55%
NET PRESENT VALUE $54,72,272 $128,22,273 $14,39,907
Document Page
6
FINANCE
Sensitivity Analysis
The main purpose of conducting sensitivity analysis is to find out how much sensitive is
the project’s NPV to the underlying discount rate which is reflected in the graph indicated below.
Sensitivity Analysis:
Discount Rate Net Present Value
1% $121,73,700
5% $88,76,606
10% $54,72,272
15% $26,88,895
20% $3,86,913
25% -$15,36,906
30% -$31,60,048
1% 5% 10% 15% 20% 25% 30%
-$4,000,000
-$2,000,000
$0
$2,000,000
$4,000,000
$6,000,000
$8,000,000
$10,000,000
$12,000,000
$14,000,000
Net Present VAlue
Figure 1: (Graph showing sensitivity analysis)
Source: (Created by Author)
The above graph shows that the NPV is quite responsive to the cost of capital change. It
also reveals that when the cost of capital becomes 25%, the NPV from the project becomes
negative.
tabler-icon-diamond-filled.svg

Paraphrase This Document

Need a fresh take? Get an instant paraphrase of this document with our AI Paraphraser
Document Page
7
FINANCE
Assumptions
While conducting the financial analysis or capital budgeting techniques to check the
viability of the proposal, there are certain assumptions which are taken which are given below in
point form:
It is assumed that the cost of capital which is used for the calculations of NPV which is
shown as 10% in the above table remains constant throughout the period of capital
budgeting.
The revenues which relates to sales and also initial investments are taken and estimated
accordingly on the judgement of the management of the company following the market
estimates.
It is assumed that there will be a recovery or salvage of net working capital as shown in
the calculations above of $ 30,00,000 at the end of the five years.
The tax rate which is applicable on the business and which is in force is assumed to
remain the same during the period of five years.
Findings and Recommendations
Therefore, from the above analysis it is quite clear that the business should move forward
with the new product market development plan as the plan is estimated to generate appropriate
cash inflows. In addition to this, the new plan is also anticipated to reduce the overall riskiness of
the business and also reduce the threats which the business faces from potential competitors of
the business. The recommendations which are suggested to the CEO of Pinto ltd are given below
in points form:
Document Page
8
FINANCE
The management needs to accept and implement the proposal plan to develop a new
product market for development of the business.
It is also advisable that the management review the market conditions in the new market
where the business is planning to enter that is, the demand conditions, the taste and
preference of the consumers, regulations and restrictions imposed by authority.
The company needs to reduce the costs of operations in order to generate better cash
inflows and also promote the profitability of the business.
Document Page
9
FINANCE
Reference
Bianchini, A., Gambuti, M., Pellegrini, M. and Saccani, C., 2016. Performance analysis and
economic assessment of different photovoltaic technologies based on experimental
measurements. Renewable Energy, 85, pp.1-11.
Burns, R. and Walker, J., 2015. Capital budgeting surveys: the future is now.
Daskalakis, G., 2013. On the efficiency of the European carbon market: New evidence from
Phase II. Energy Policy, 54, pp.369-375.
Guerra, M.L., Magni, C.A. and Stefanini, L., 2014. Interval and fuzzy Average Internal Rate of
Return for investment appraisal. Fuzzy Sets and Systems, 257, pp.217-241.
Maroušek, J., Hašková, S., Zeman, R. and Vaníčková, R., 2015. Managerial preferences in
relation to financial indicators regarding the mitigation of global change. Science and
engineering ethics, 21(1), pp.203-207.
Moten Jr, J.M. and Thron, C., 2013. Improvements on secant method for estimating internal rate
of return (IRR). Int. J. Appl. Math. Stat, 42(12), pp.84-93.
San Ong, T. and Thum, C.H., 2013. Net present value and payback period for building integrated
photovoltaic projects in Malaysia. International Journal of Academic Research in Business and
Social Sciences, 3(2), p.153.
chevron_up_icon
1 out of 10
circle_padding
hide_on_mobile
zoom_out_icon
logo.png

Your All-in-One AI-Powered Toolkit for Academic Success.

Available 24*7 on WhatsApp / Email

[object Object]