Finance Report: Capital Budgeting Analysis for Pinto Limited Project

Verified

Added on  2021/05/31

|7
|1424
|115
Report
AI Summary
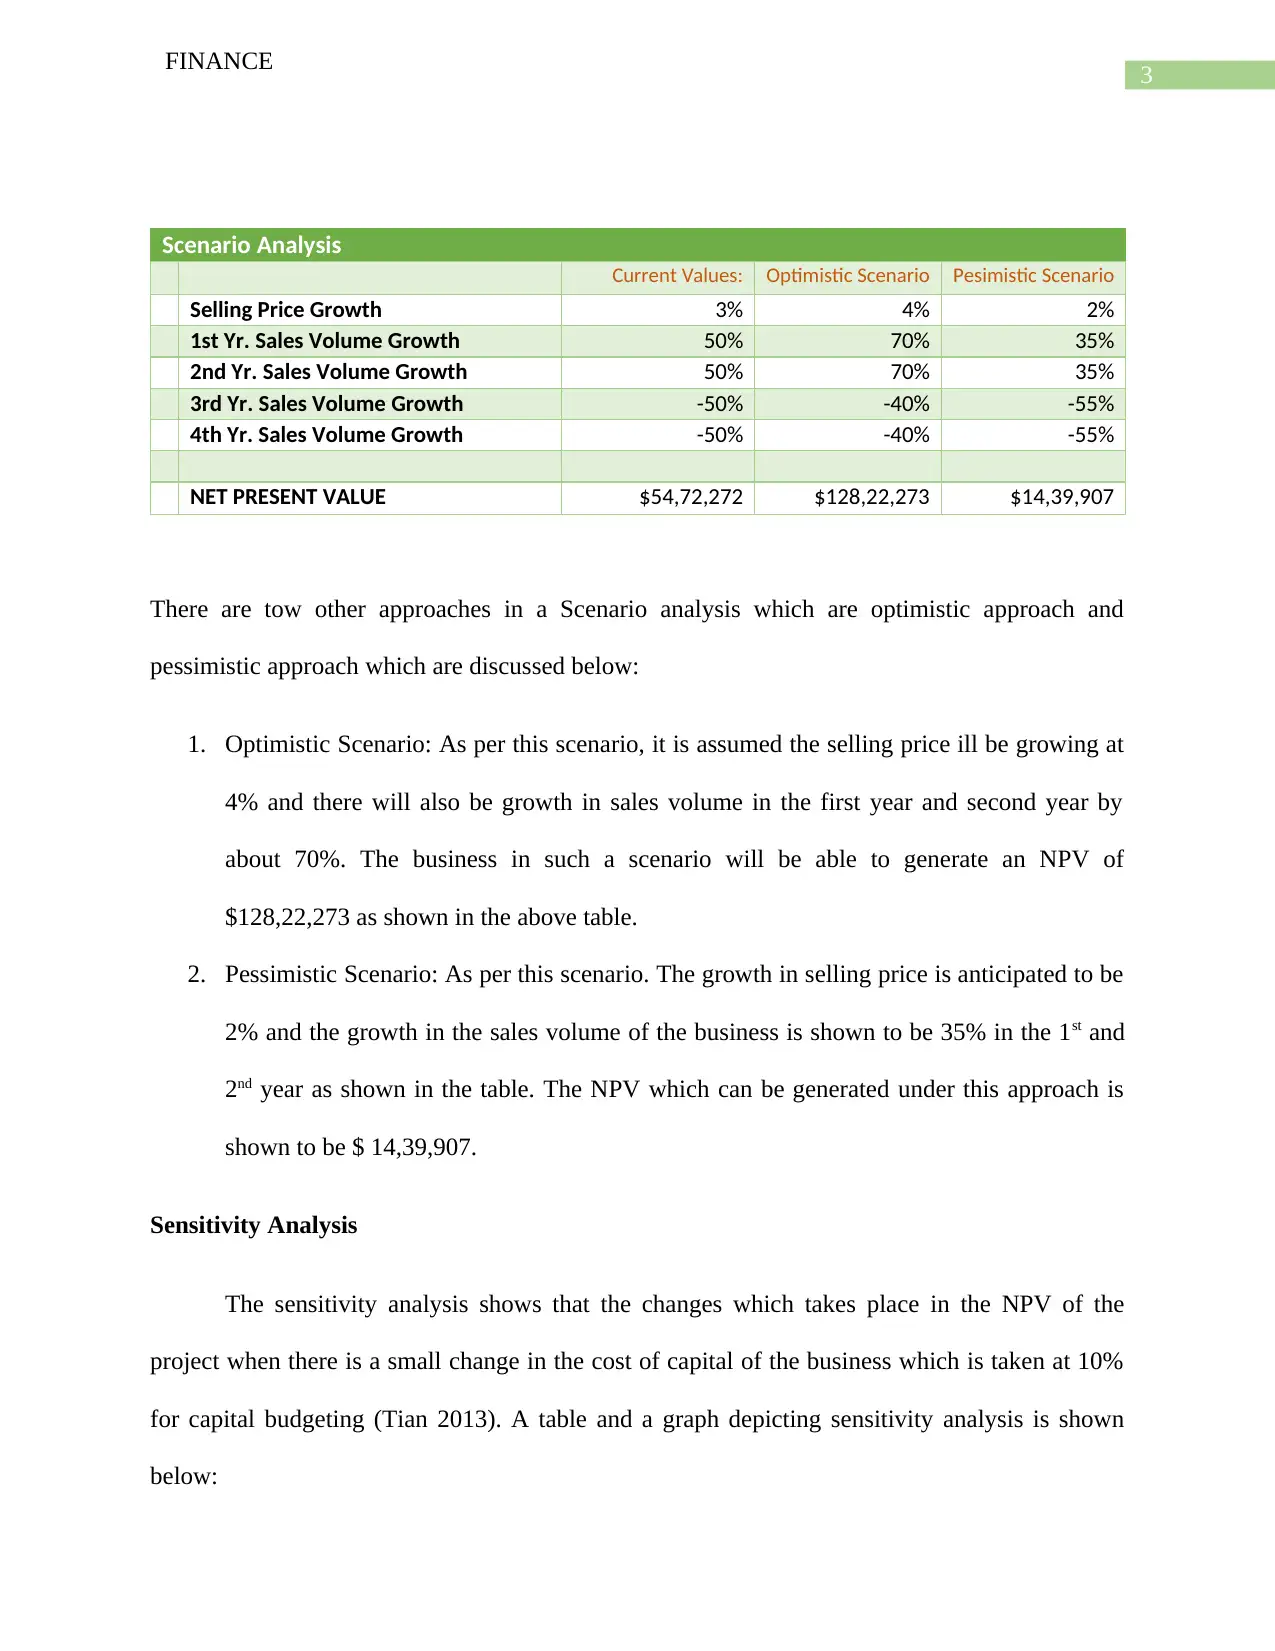
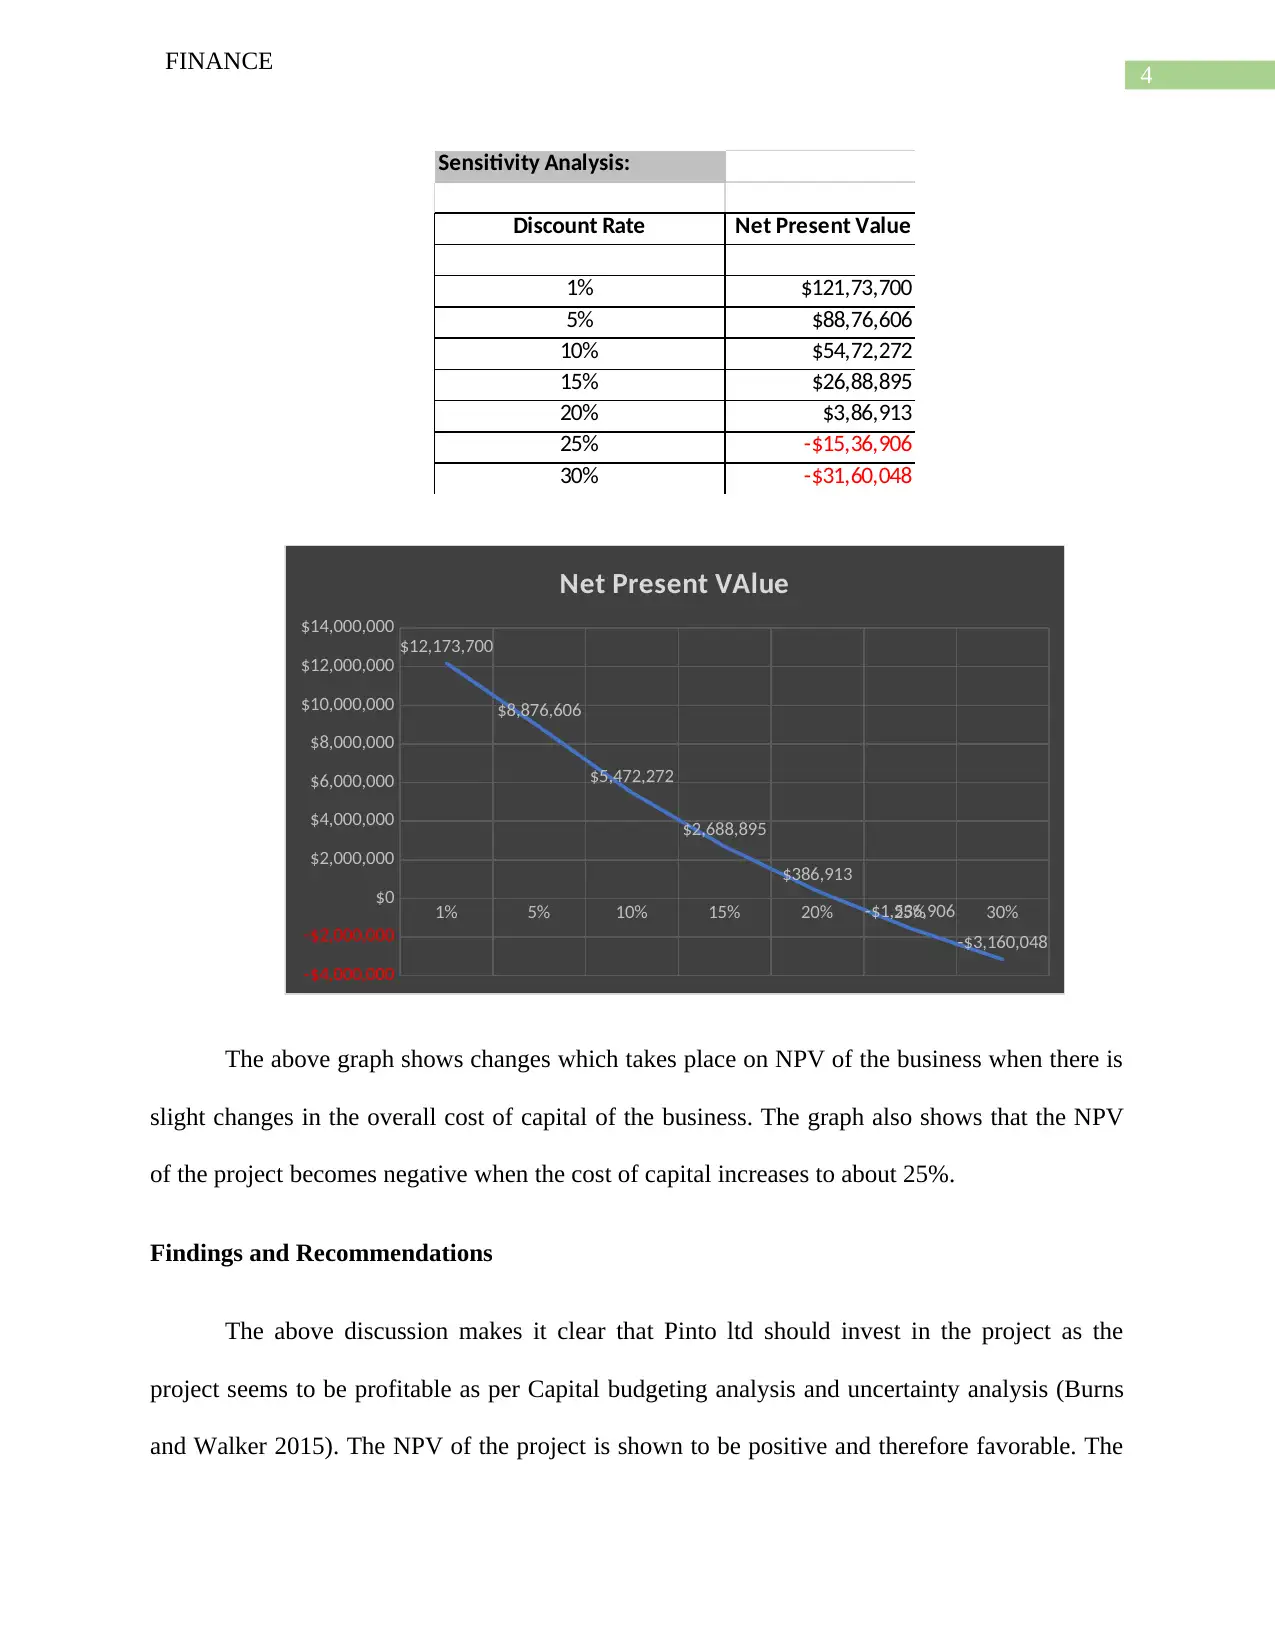
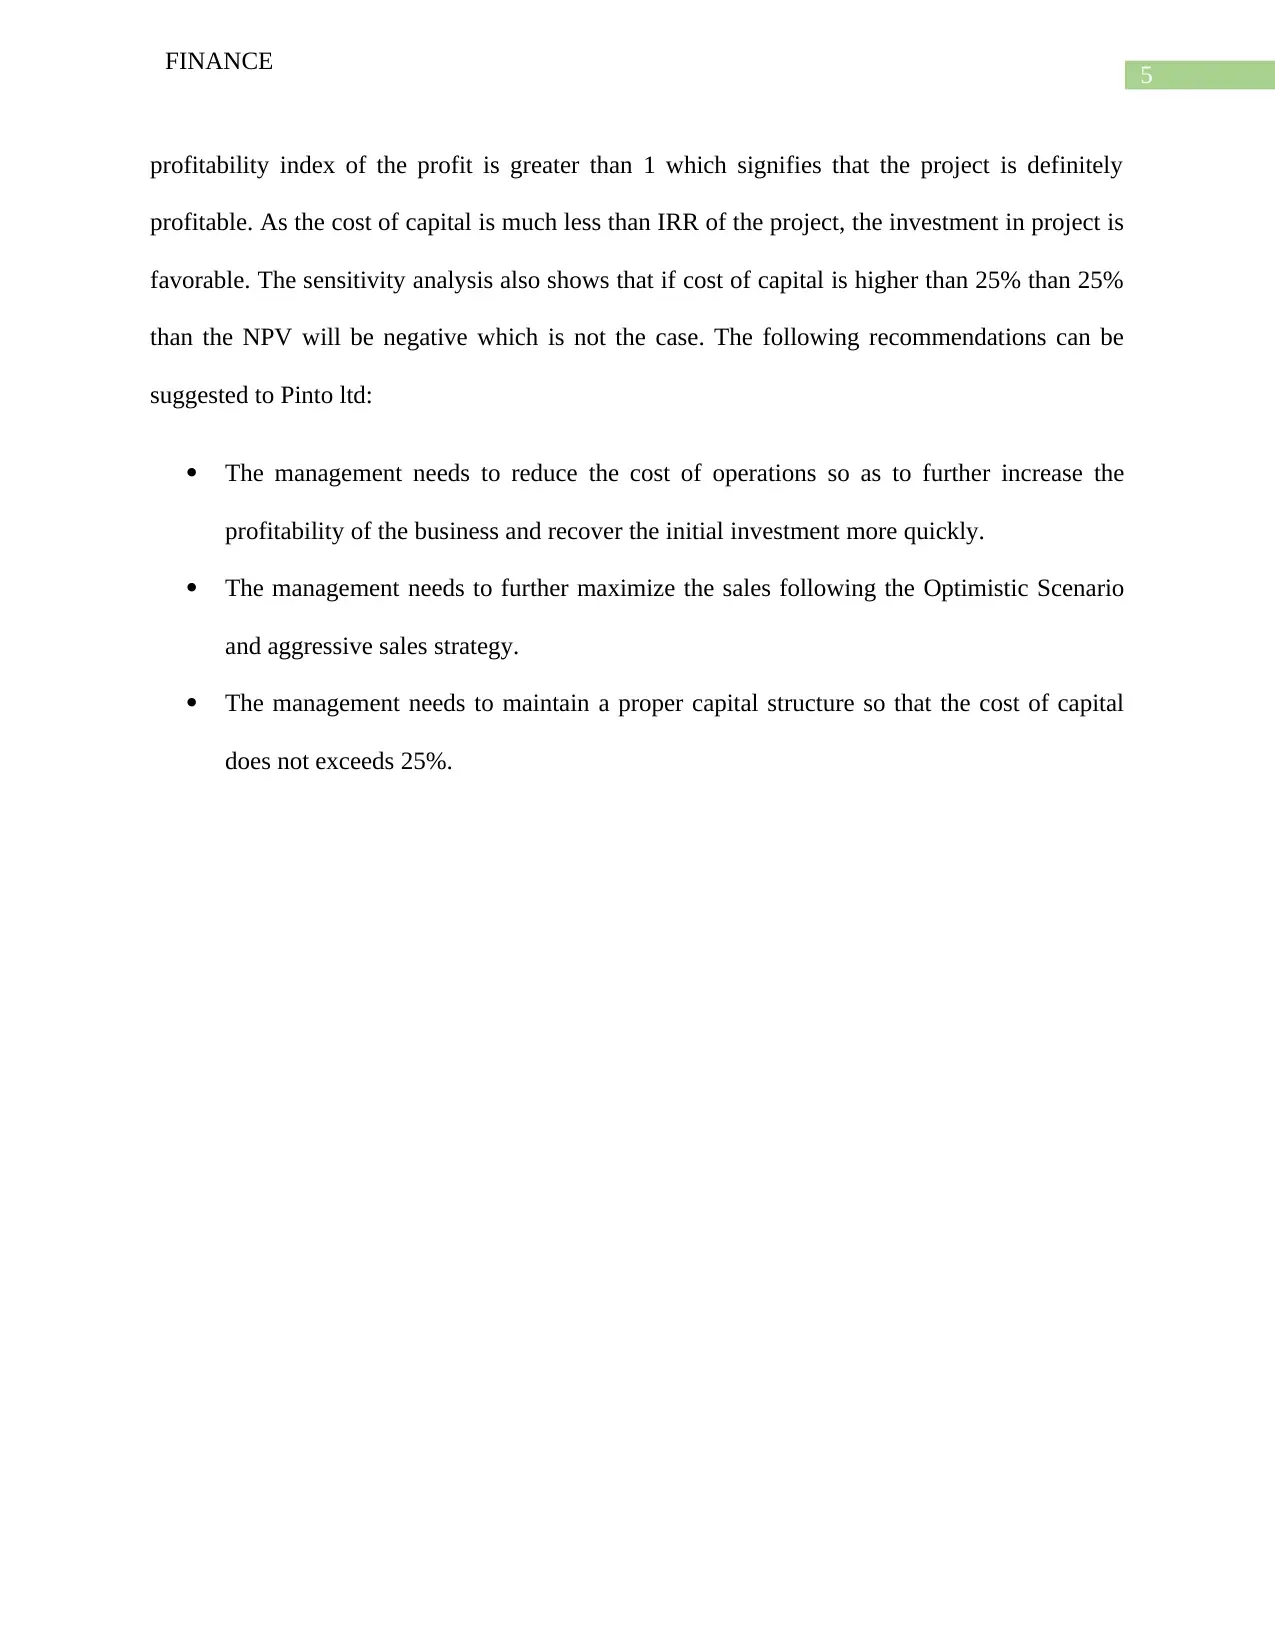
This report analyzes a capital budgeting project for Pinto Limited, evaluating the viability of a new product market investment. The report uses several capital budgeting techniques, including Net Present Value (NPV), Profitability Index, Payback Period, Discounted Payback Period, and Internal Rate of Return (IRR). The initial investment is estimated at $180,00,000, and the analysis is conducted over five years. The report also incorporates uncertainty analysis through scenario and sensitivity analysis to assess the project's risks and potential returns under optimistic and pessimistic scenarios, including changes in sales volume and selling price. The findings suggest that the project is profitable, with positive NPV, a profitability index greater than 1, and a favorable IRR compared to the cost of capital. The report recommends that Pinto Ltd. reduce operational costs, maximize sales, and maintain a proper capital structure. The report concludes that the project is a favorable investment opportunity.
tabler-icon-diamond-filled.svg

Contribute Materials

Your contribution can guide someone’s learning journey. Share your documents today.
Document Page
Running head: FINANCE
FINANCE
Name of the Student:
Name of the University:
Author’s Note
tabler-icon-diamond-filled.svg

Secure Best Marks with AI Grader

Need help grading? Try our AI Grader for instant feedback on your assignments.
Document Page
1
FINANCE
Memorandum
Memo to: Board of Directors
Company: Pinto Limited
From: Author
Subject: Capital Budgeting Techniques for the Project
Date: 20/05/2018
As per the case study which is given in the assignment, the management of Pinto Ltd is planning
to invest in a project which will take the company in a new product market. The viability of the
project needs to estimated for which the management has decided to conduct Capital Budgeting
to establish whether investing in the project will benefit the business of Pinto ltd in the long run.
The calculations for Capital Budgeting which would be including NPV analysis, profitability
index, payback and discounted payback period analysis and IRR approach is shown in the
appendix which is shown below.
The initial investment which the management estimates to be required in the projects is
around $ 180,00,000. The initial investment is made up of investments in machinery which is
shown in the calculations as $ 150,00,000 and the business will also be requiring additional
working capital which is shown to be $ 30,00,000. The analysis is conducted for a period of five
years as shown in the calculations. The management applies various techniques for estimating
the worth of the project which are NPV, profitability, payback approach and discounted payback
approach and IRR approach (Daskalakis 2013). The purpose behind calculating the NPV of the
project is to ensure that the project will be generating appropriate cash inflows which will be
Document Page
2
FINANCE
more than the cash outflows of the business (Cucchiella, D’Adamo and Gastaldi 2015). The NPV
of the project as calculated is shown in appendix area which comes to about $ 54,72,272. The
profitability index measures the profitability of the project in which the net cash inflows should
be more than the cash outflows of the business. The profitability index of the business reveals
that the company has a favorable profitability index which is shown to be 1.30 which is greater
than 1. The profitability index establishes a relationship with the cash inflows of the business and
cash outflows of the business. In the case of payback period, the calculation shows that the
payback period comes to 2.73 years. The payback period analysis shows the minimum time
which the business takes for recovering the initial investments made by the business in the
project (Wang, Xia and Zhang 2014). The method is useful as it provides the management the
minimum time in which the management can recover the initial investments made by the same.
The discounted payback period is an extension of payback period and the only difference
between the two is that discounted payback period considers the cost of capital in the
calculations. In addition to this, the method provides a clear idea as to how much time it will take
to reach breakeven point of the project. The discounted payback period of the project is
anticipated to be 3.38 years as shown in the calculations in the appendix section (Al-Alawi and
Bradley 2013). Internal rate of return is the rate at which the cash inflows of the business is equal
to the cash outflows of the business (Magni 2013). The IRR of the project as calculated is shown
to be 20.94%.
Uncertainty Analysis
The management in order to confirm whether to invest in the project or not have decided
to apply uncertainty analysis which will be including scenario analysis and sensitivity analysis
(Janssen 2013). The scenario analysis table is shown below:
Document Page
3
FINANCE
Scenario Analysis
Current Values: Optimistic Scenario Pesimistic Scenario
Selling Price Growth 3% 4% 2%
1st Yr. Sales Volume Growth 50% 70% 35%
2nd Yr. Sales Volume Growth 50% 70% 35%
3rd Yr. Sales Volume Growth -50% -40% -55%
4th Yr. Sales Volume Growth -50% -40% -55%
NET PRESENT VALUE $54,72,272 $128,22,273 $14,39,907
There are tow other approaches in a Scenario analysis which are optimistic approach and
pessimistic approach which are discussed below:
1. Optimistic Scenario: As per this scenario, it is assumed the selling price ill be growing at
4% and there will also be growth in sales volume in the first year and second year by
about 70%. The business in such a scenario will be able to generate an NPV of
$128,22,273 as shown in the above table.
2. Pessimistic Scenario: As per this scenario. The growth in selling price is anticipated to be
2% and the growth in the sales volume of the business is shown to be 35% in the 1st and
2nd year as shown in the table. The NPV which can be generated under this approach is
shown to be $ 14,39,907.
Sensitivity Analysis
The sensitivity analysis shows that the changes which takes place in the NPV of the
project when there is a small change in the cost of capital of the business which is taken at 10%
for capital budgeting (Tian 2013). A table and a graph depicting sensitivity analysis is shown
below:
tabler-icon-diamond-filled.svg

Secure Best Marks with AI Grader

Need help grading? Try our AI Grader for instant feedback on your assignments.
Document Page
4
FINANCE
Sensitivity Analysis:
Discount Rate Net Present Value
1% $121,73,700
5% $88,76,606
10% $54,72,272
15% $26,88,895
20% $3,86,913
25% -$15,36,906
30% -$31,60,048
1% 5% 10% 15% 20% 25% 30%
-$4,000,000
-$2,000,000
$0
$2,000,000
$4,000,000
$6,000,000
$8,000,000
$10,000,000
$12,000,000
$14,000,000
$12,173,700
$8,876,606
$5,472,272
$2,688,895
$386,913
-$1,536,906
-$3,160,048
Net Present VAlue
The above graph shows changes which takes place on NPV of the business when there is
slight changes in the overall cost of capital of the business. The graph also shows that the NPV
of the project becomes negative when the cost of capital increases to about 25%.
Findings and Recommendations
The above discussion makes it clear that Pinto ltd should invest in the project as the
project seems to be profitable as per Capital budgeting analysis and uncertainty analysis (Burns
and Walker 2015). The NPV of the project is shown to be positive and therefore favorable. The
Document Page
5
FINANCE
profitability index of the profit is greater than 1 which signifies that the project is definitely
profitable. As the cost of capital is much less than IRR of the project, the investment in project is
favorable. The sensitivity analysis also shows that if cost of capital is higher than 25% than 25%
than the NPV will be negative which is not the case. The following recommendations can be
suggested to Pinto ltd:
The management needs to reduce the cost of operations so as to further increase the
profitability of the business and recover the initial investment more quickly.
The management needs to further maximize the sales following the Optimistic Scenario
and aggressive sales strategy.
The management needs to maintain a proper capital structure so that the cost of capital
does not exceeds 25%.
Document Page
6
FINANCE
Reference
Al-Alawi, B.M. and Bradley, T.H., 2013. Total cost of ownership, payback, and consumer
preference modeling of plug-in hybrid electric vehicles. Applied Energy, 103, pp.488-506.
Burns, R. and Walker, J., 2015. Capital budgeting surveys: the future is now.
Cucchiella, F., D’Adamo, I. and Gastaldi, M., 2015. Financial analysis for investment and policy
decisions in the renewable energy sector. Clean Technologies and Environmental Policy, 17(4),
pp.887-904.
Daskalakis, G., 2013. On the efficiency of the European carbon market: New evidence from
Phase II. Energy Policy, 54, pp.369-375.
Janssen, H., 2013. Monte-Carlo based uncertainty analysis: Sampling efficiency and sampling
convergence. Reliability Engineering & System Safety, 109, pp.123-132.
Magni, C.A., 2013. The internal rate of return approach and the AIRR paradigm: a refutation and
a corroboration. The Engineering Economist, 58(2), pp.73-111.
Tian, W., 2013. A review of sensitivity analysis methods in building energy analysis. Renewable
and Sustainable Energy Reviews, 20, pp.411-419.
Wang, B., Xia, X. and Zhang, J., 2014. A multi-objective optimization model for the life-cycle
cost analysis and retrofitting planning of buildings. Energy and Buildings, 77, pp.227-235.
chevron_up_icon
1 out of 7
circle_padding
hide_on_mobile
zoom_out_icon
logo.png

Your All-in-One AI-Powered Toolkit for Academic Success.

Available 24*7 on WhatsApp / Email

[object Object]