Capital Budgeting Analysis: Vina-Temasek Joint Ventures Project Report
VerifiedAdded on 2023/06/10
|11
|2375
|435
Project
AI Summary
This assignment presents a comprehensive capital budgeting analysis for Vina-Temasek Joint Ventures Limited, comparing two investment projects (Project A and Project B) using various financial metrics. The analysis includes detailed calculations of Net Present Value (NPV), Internal Rate of Return (IRR), payback period, and Profitability Index (PI) for each project. The assignment also considers capital rationing, recommending an optimal investment strategy given a limited budget of $500,000. The solution further discusses the implications of these techniques and provides a justification for the investment recommendations, emphasizing the importance of considering multiple capital budgeting methods and addressing potential limitations like the multiplicity of rates of return and discounting rates associated with IRR.

Running Head: Capital Budgeting Analysis
TECHNIQUES OF CAPITAL BUDGETING
TECHNIQUES OF CAPITAL BUDGETING
Paraphrase This Document
Need a fresh take? Get an instant paraphrase of this document with our AI Paraphraser
Capital Budgeting Analysis 10
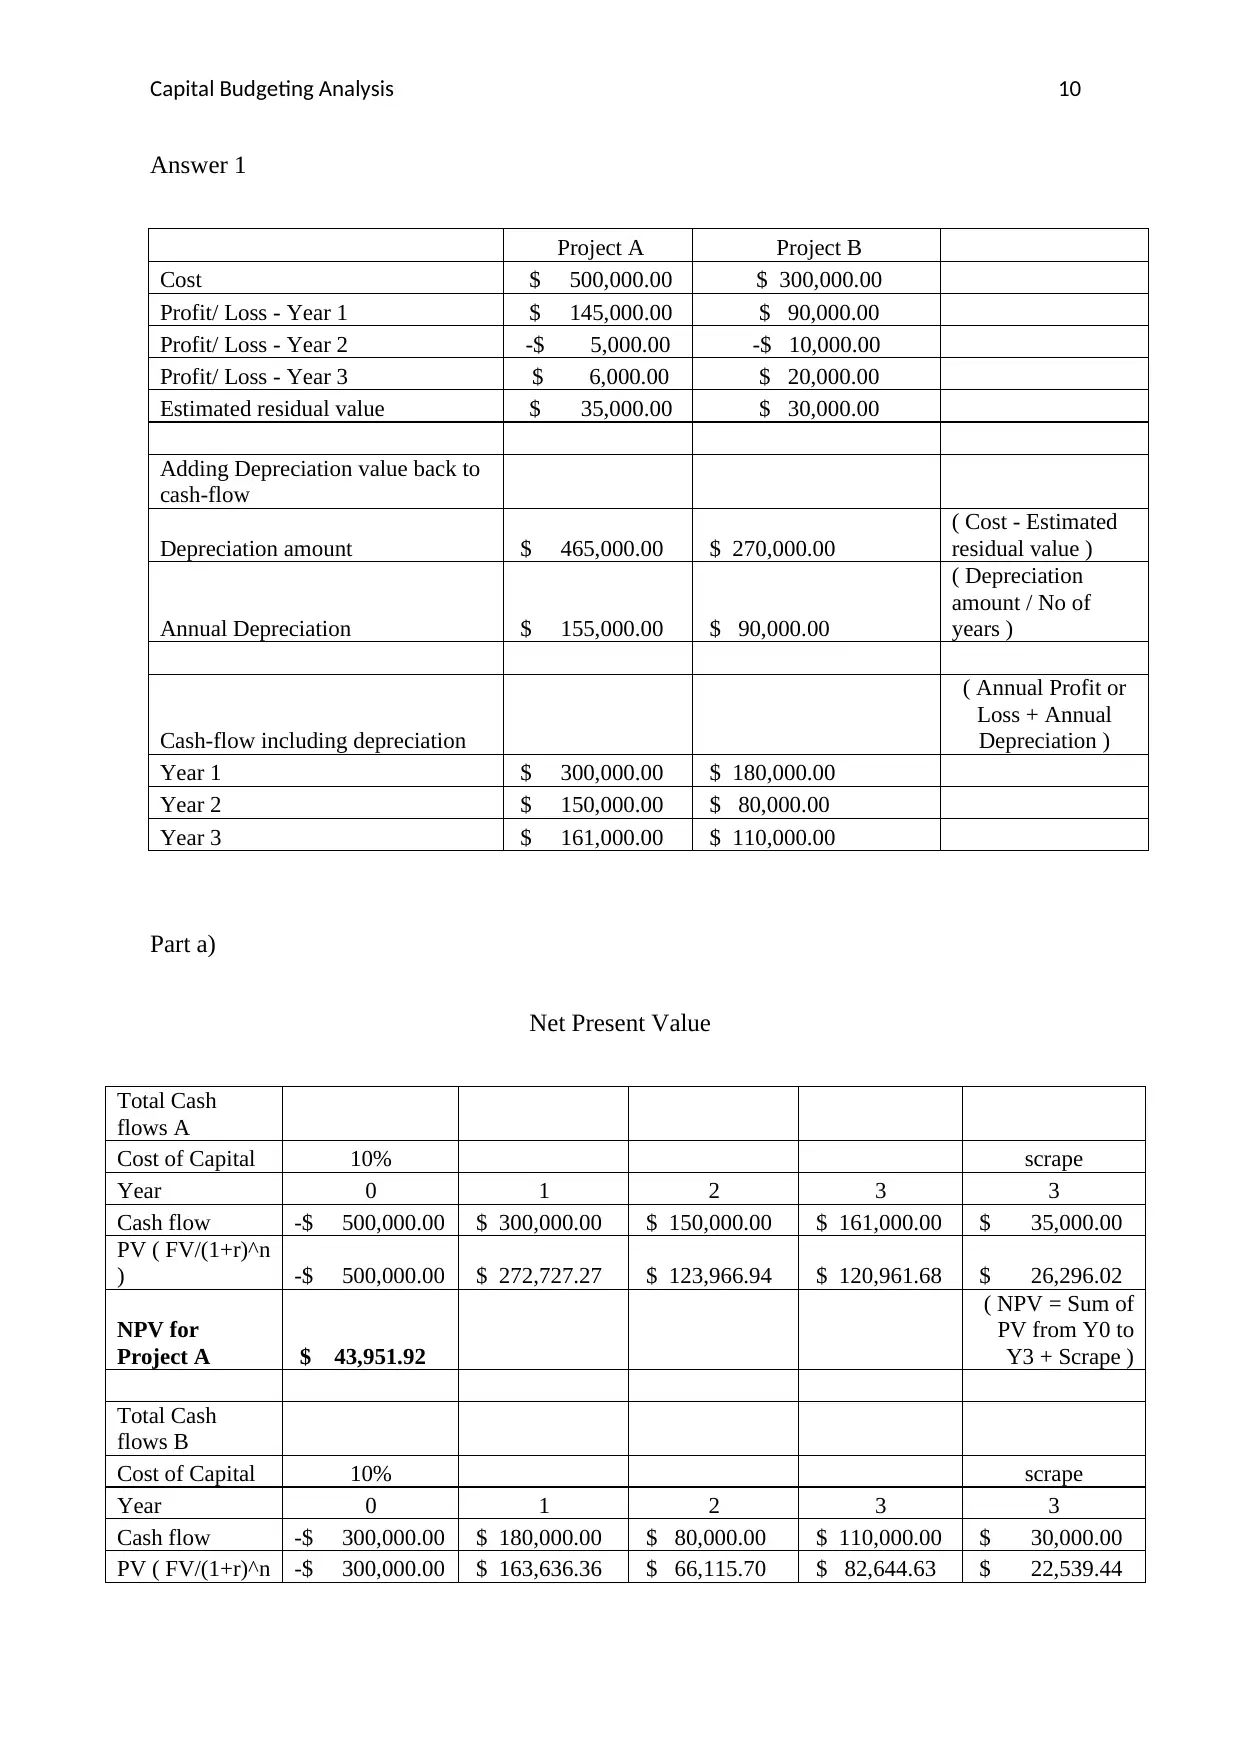
Answer 1
Project A Project B
Cost $ 500,000.00 $ 300,000.00
Profit/ Loss - Year 1 $ 145,000.00 $ 90,000.00
Profit/ Loss - Year 2 -$ 5,000.00 -$ 10,000.00
Profit/ Loss - Year 3 $ 6,000.00 $ 20,000.00
Estimated residual value $ 35,000.00 $ 30,000.00
Adding Depreciation value back to
cash-flow
Depreciation amount $ 465,000.00 $ 270,000.00
( Cost - Estimated
residual value )
Annual Depreciation $ 155,000.00 $ 90,000.00
( Depreciation
amount / No of
years )
Cash-flow including depreciation
( Annual Profit or
Loss + Annual
Depreciation )
Year 1 $ 300,000.00 $ 180,000.00
Year 2 $ 150,000.00 $ 80,000.00
Year 3 $ 161,000.00 $ 110,000.00
Part a)
Net Present Value
Total Cash
flows A
Cost of Capital 10% scrape
Year 0 1 2 3 3
Cash flow -$ 500,000.00 $ 300,000.00 $ 150,000.00 $ 161,000.00 $ 35,000.00
PV ( FV/(1+r)^n
) -$ 500,000.00 $ 272,727.27 $ 123,966.94 $ 120,961.68 $ 26,296.02
NPV for
Project A $ 43,951.92
( NPV = Sum of
PV from Y0 to
Y3 + Scrape )
Total Cash
flows B
Cost of Capital 10% scrape
Year 0 1 2 3 3
Cash flow -$ 300,000.00 $ 180,000.00 $ 80,000.00 $ 110,000.00 $ 30,000.00
PV ( FV/(1+r)^n -$ 300,000.00 $ 163,636.36 $ 66,115.70 $ 82,644.63 $ 22,539.44
Capital Budgeting Analysis 10
)
NPV for
Project B $ 34,936.14
( NPV = Sum of
PV from Y0 to
Y3 + Scrape )
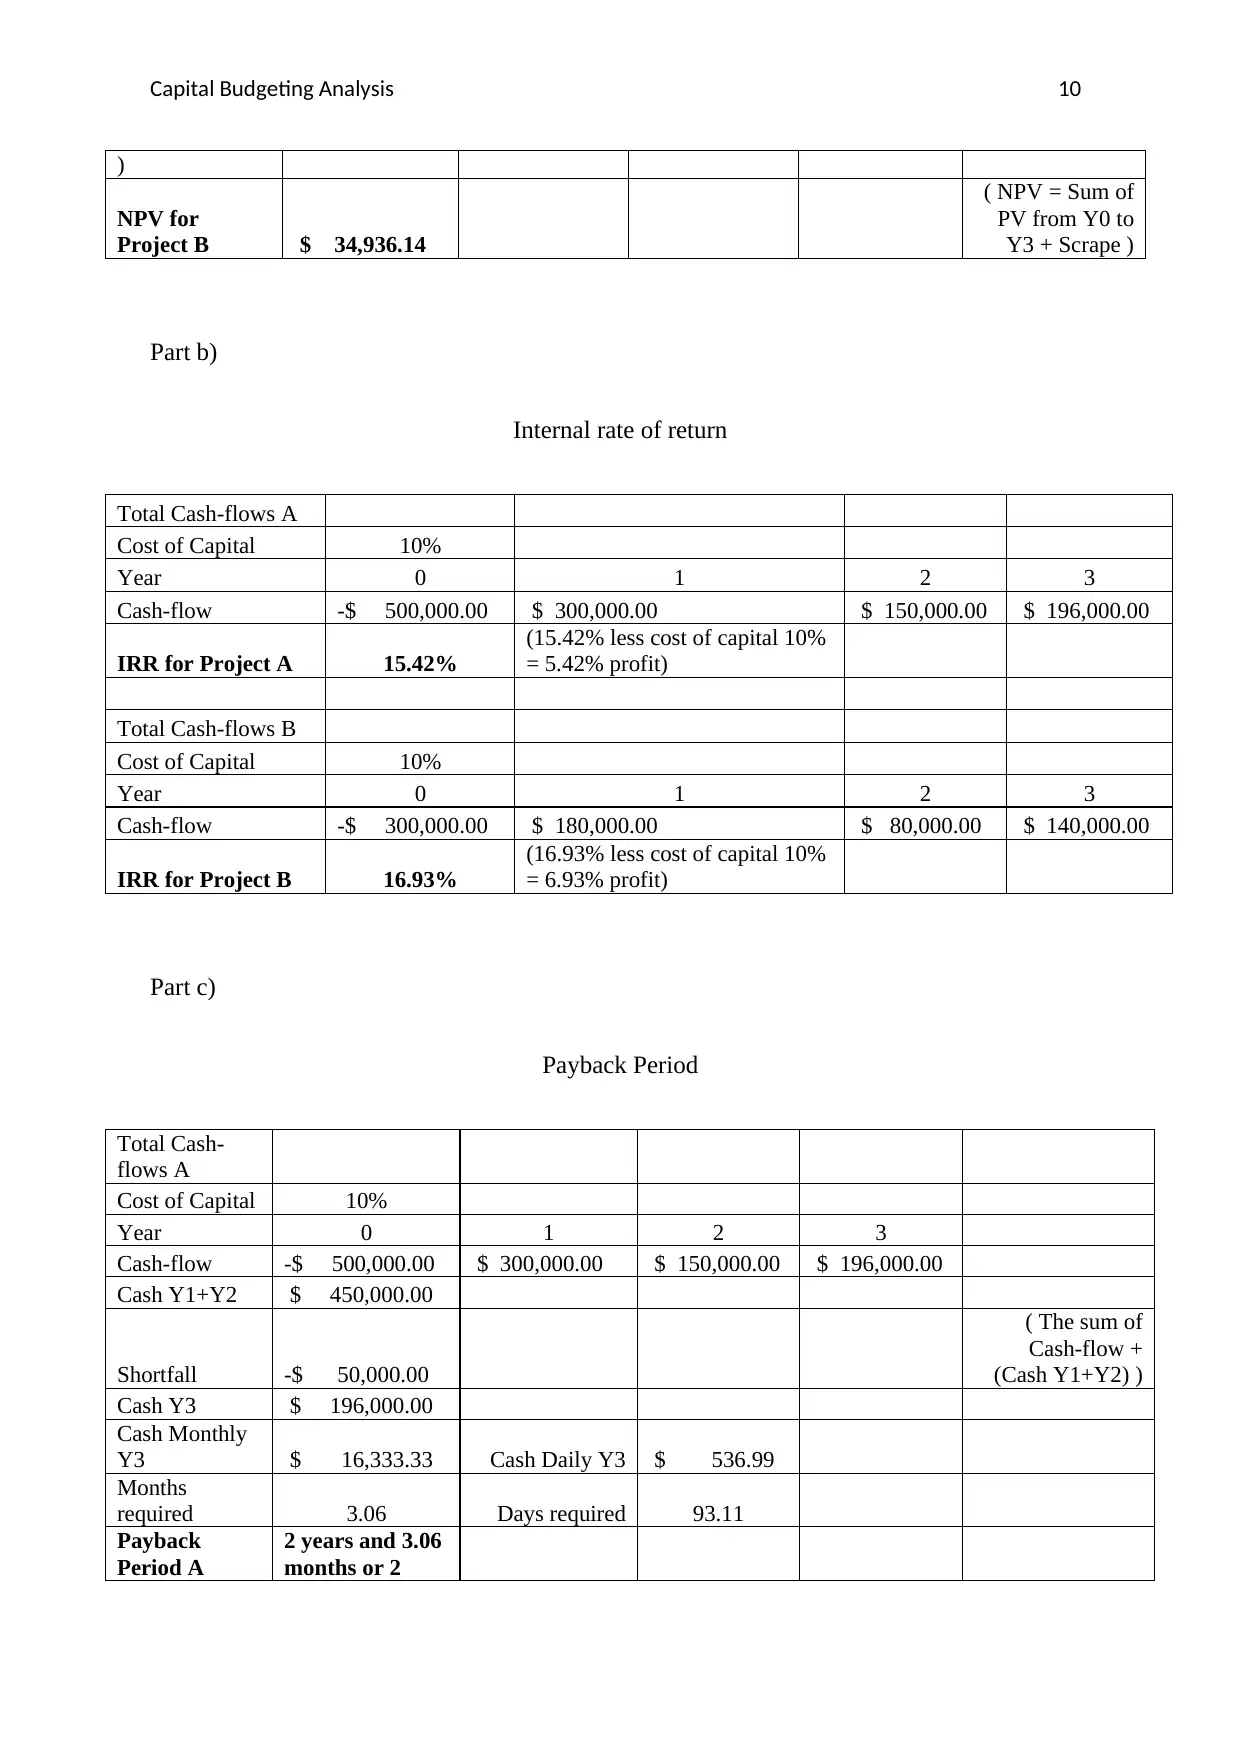
Part b)
Internal rate of return
Total Cash-flows A
Cost of Capital 10%
Year 0 1 2 3
Cash-flow -$ 500,000.00 $ 300,000.00 $ 150,000.00 $ 196,000.00
IRR for Project A 15.42%
(15.42% less cost of capital 10%
= 5.42% profit)
Total Cash-flows B
Cost of Capital 10%
Year 0 1 2 3
Cash-flow -$ 300,000.00 $ 180,000.00 $ 80,000.00 $ 140,000.00
IRR for Project B 16.93%
(16.93% less cost of capital 10%
= 6.93% profit)
Part c)
Payback Period
Total Cash-
flows A
Cost of Capital 10%
Year 0 1 2 3
Cash-flow -$ 500,000.00 $ 300,000.00 $ 150,000.00 $ 196,000.00
Cash Y1+Y2 $ 450,000.00
Shortfall -$ 50,000.00
( The sum of
Cash-flow +
(Cash Y1+Y2) )
Cash Y3 $ 196,000.00
Cash Monthly
Y3 $ 16,333.33 Cash Daily Y3 $ 536.99
Months
required 3.06 Days required 93.11
Payback
Period A
2 years and 3.06
months or 2
)
NPV for
Project B $ 34,936.14
( NPV = Sum of
PV from Y0 to
Y3 + Scrape )
Part b)
Internal rate of return
Total Cash-flows A
Cost of Capital 10%
Year 0 1 2 3
Cash-flow -$ 500,000.00 $ 300,000.00 $ 150,000.00 $ 196,000.00
IRR for Project A 15.42%
(15.42% less cost of capital 10%
= 5.42% profit)
Total Cash-flows B
Cost of Capital 10%
Year 0 1 2 3
Cash-flow -$ 300,000.00 $ 180,000.00 $ 80,000.00 $ 140,000.00
IRR for Project B 16.93%
(16.93% less cost of capital 10%
= 6.93% profit)
Part c)
Payback Period
Total Cash-
flows A
Cost of Capital 10%
Year 0 1 2 3
Cash-flow -$ 500,000.00 $ 300,000.00 $ 150,000.00 $ 196,000.00
Cash Y1+Y2 $ 450,000.00
Shortfall -$ 50,000.00
( The sum of
Cash-flow +
(Cash Y1+Y2) )
Cash Y3 $ 196,000.00
Cash Monthly
Y3 $ 16,333.33 Cash Daily Y3 $ 536.99
Months
required 3.06 Days required 93.11
Payback
Period A
2 years and 3.06
months or 2
⊘ This is a preview!⊘
Do you want full access?
Subscribe today to unlock all pages.
Trusted by 1+ million students worldwide
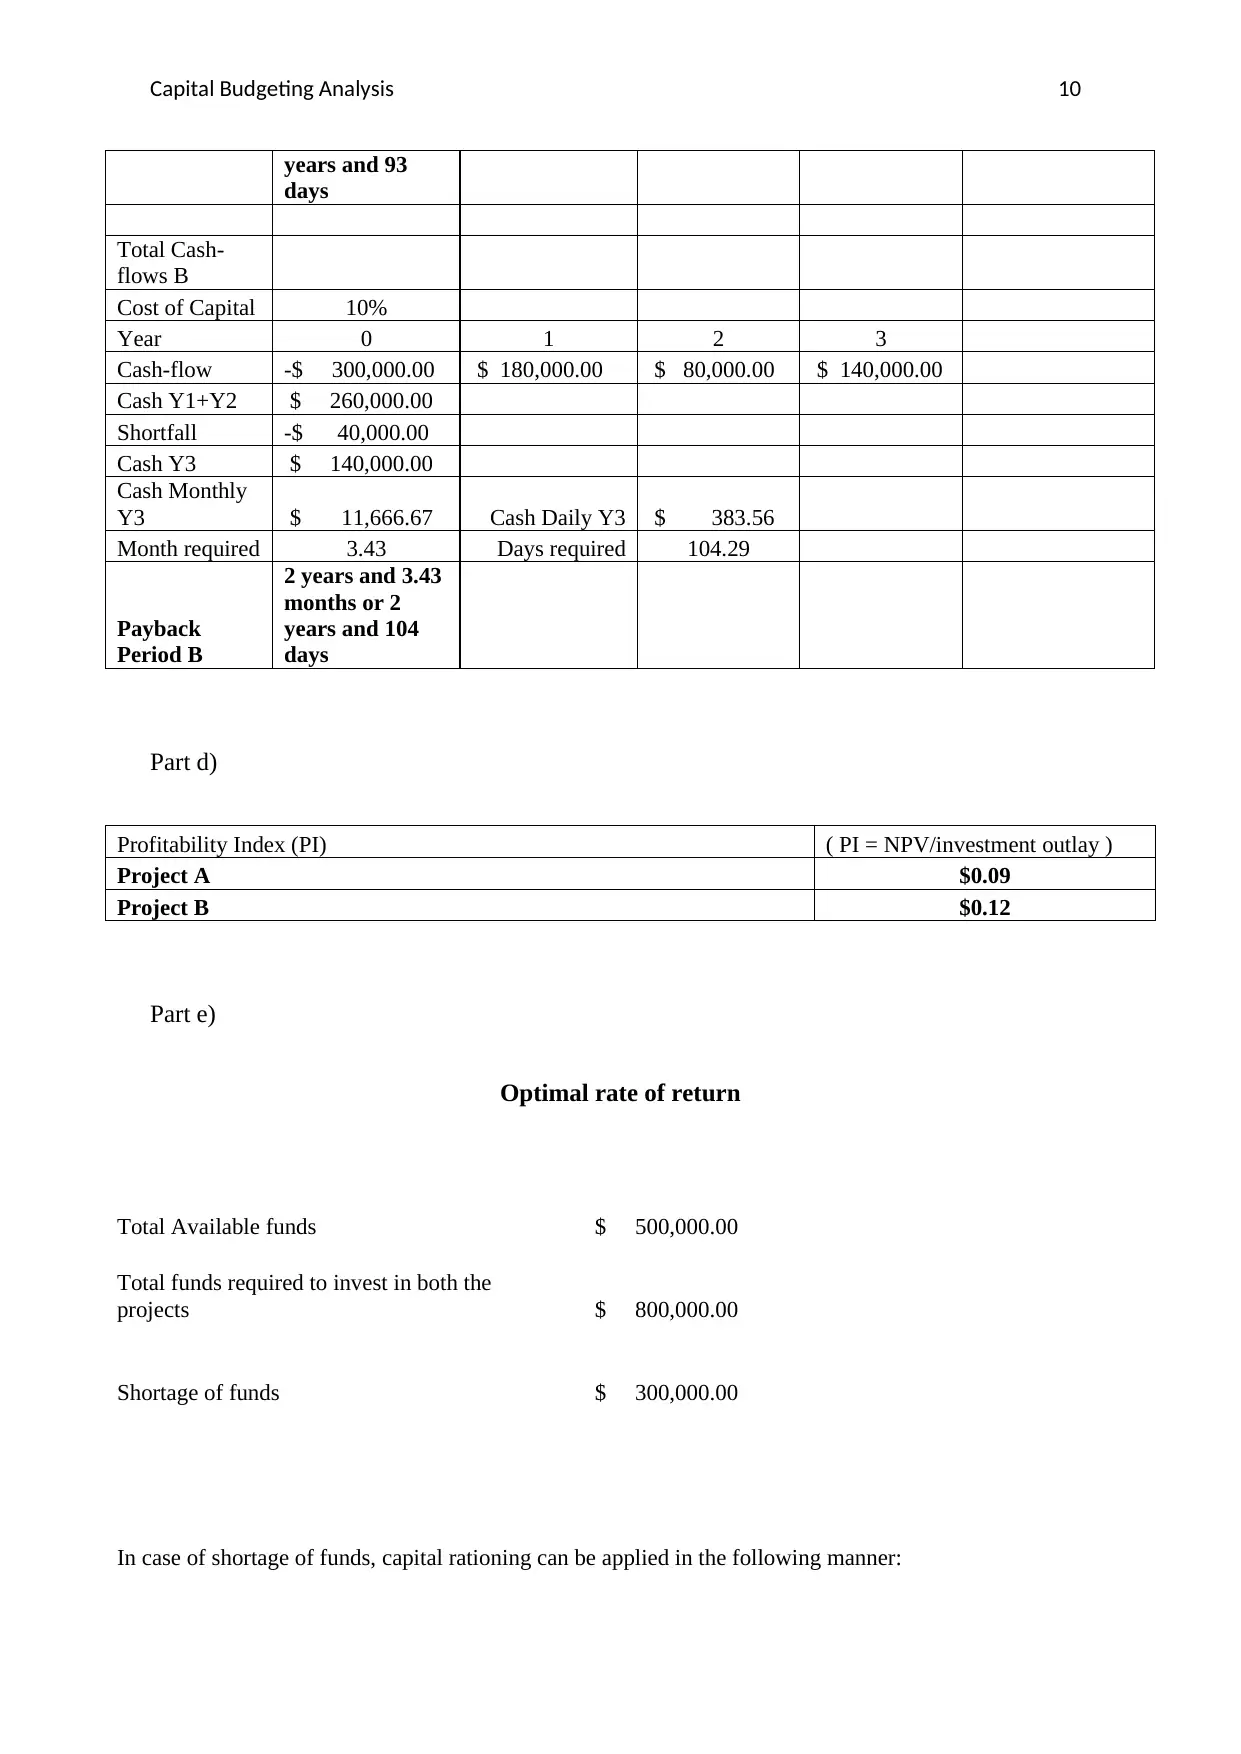
Capital Budgeting Analysis 10
years and 93
days
Total Cash-
flows B
Cost of Capital 10%
Year 0 1 2 3
Cash-flow -$ 300,000.00 $ 180,000.00 $ 80,000.00 $ 140,000.00
Cash Y1+Y2 $ 260,000.00
Shortfall -$ 40,000.00
Cash Y3 $ 140,000.00
Cash Monthly
Y3 $ 11,666.67 Cash Daily Y3 $ 383.56
Month required 3.43 Days required 104.29
Payback
Period B
2 years and 3.43
months or 2
years and 104
days
Part d)
Profitability Index (PI) ( PI = NPV/investment outlay )
Project A $0.09
Project B $0.12
Part e)
Optimal rate of return
Total Available funds $ 500,000.00
Total funds required to invest in both the
projects $ 800,000.00
Shortage of funds $ 300,000.00
In case of shortage of funds, capital rationing can be applied in the following manner:
Paraphrase This Document
Need a fresh take? Get an instant paraphrase of this document with our AI Paraphraser
Capital Budgeting Analysis 10
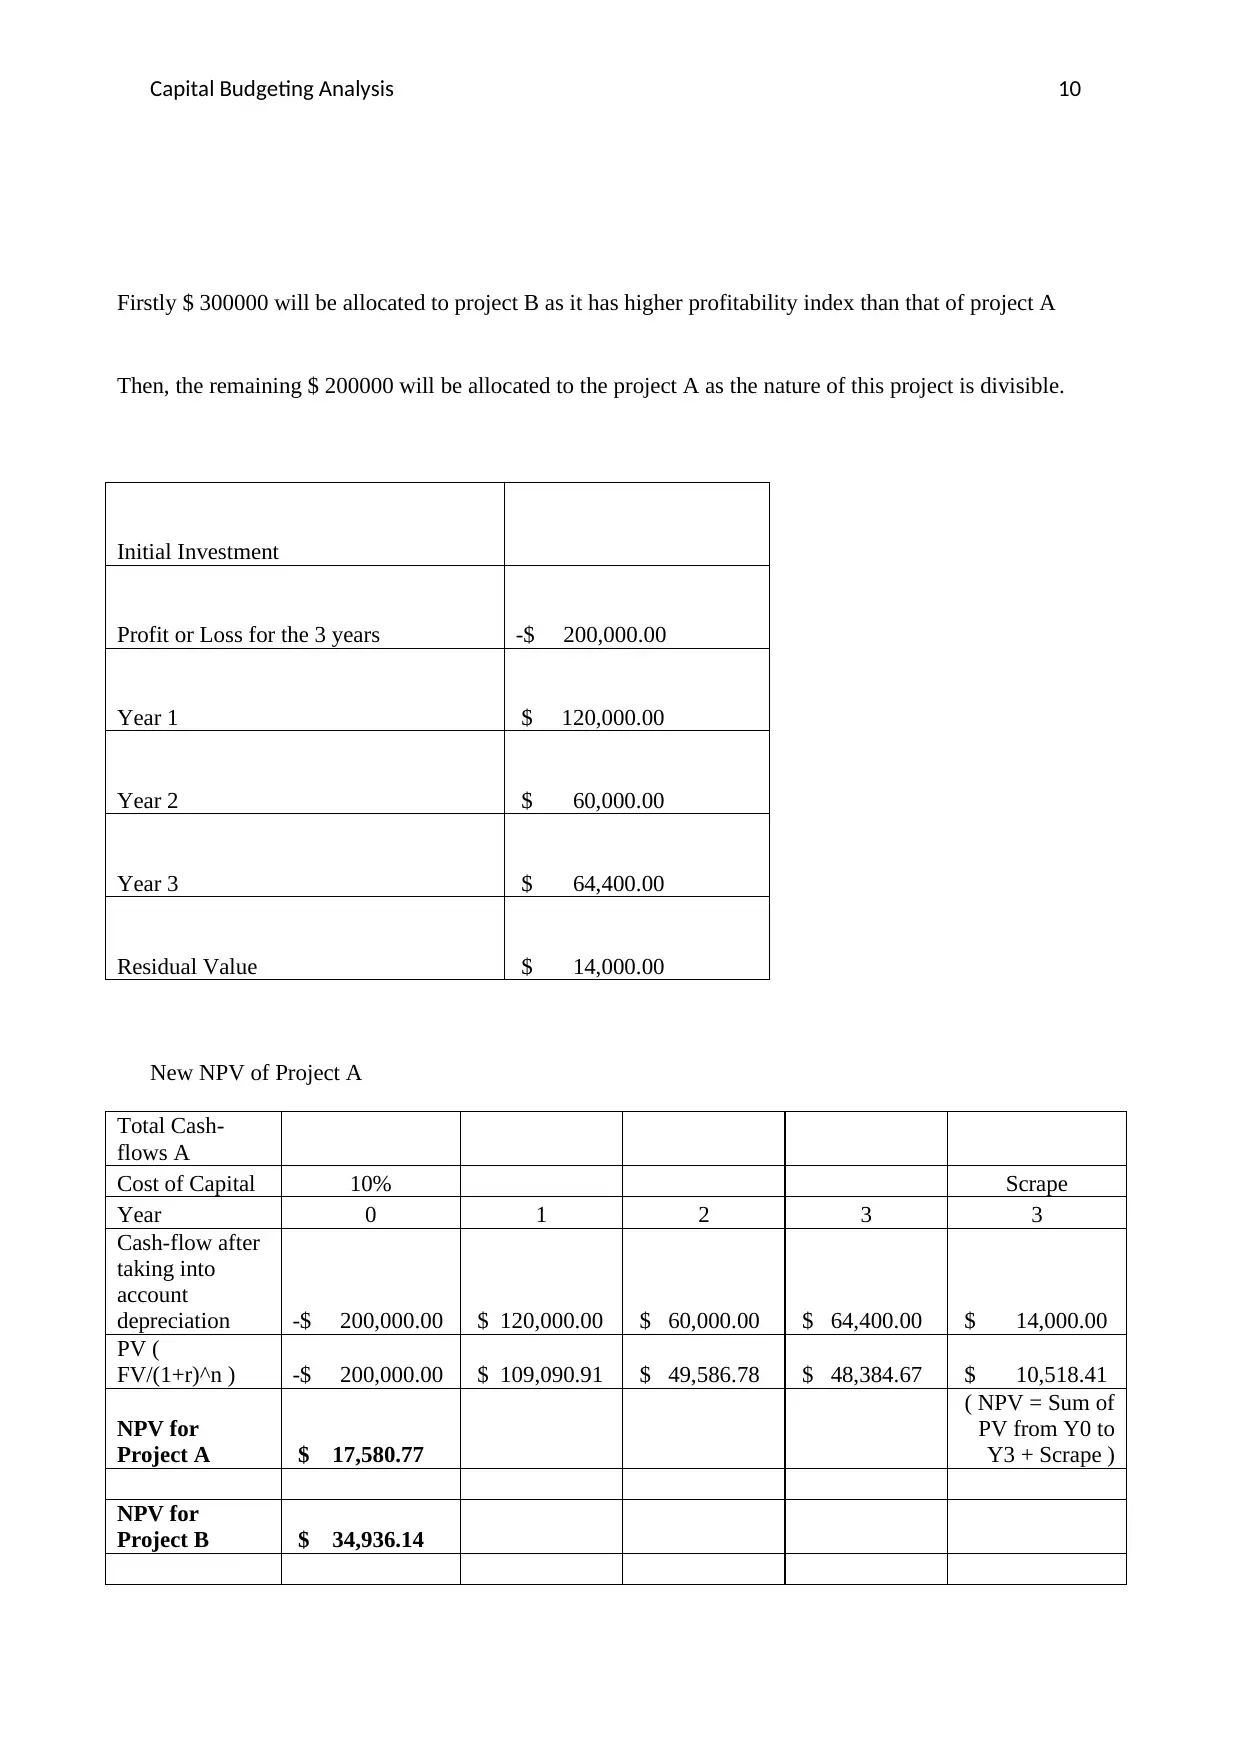
Firstly $ 300000 will be allocated to project B as it has higher profitability index than that of project A
Then, the remaining $ 200000 will be allocated to the project A as the nature of this project is divisible.
Initial Investment
Profit or Loss for the 3 years -$ 200,000.00
Year 1 $ 120,000.00
Year 2 $ 60,000.00
Year 3 $ 64,400.00
Residual Value $ 14,000.00
New NPV of Project A
Total Cash-
flows A
Cost of Capital 10% Scrape
Year 0 1 2 3 3
Cash-flow after
taking into
account
depreciation -$ 200,000.00 $ 120,000.00 $ 60,000.00 $ 64,400.00 $ 14,000.00
PV (
FV/(1+r)^n ) -$ 200,000.00 $ 109,090.91 $ 49,586.78 $ 48,384.67 $ 10,518.41
NPV for
Project A $ 17,580.77
( NPV = Sum of
PV from Y0 to
Y3 + Scrape )
NPV for
Project B $ 34,936.14
Capital Budgeting Analysis 10
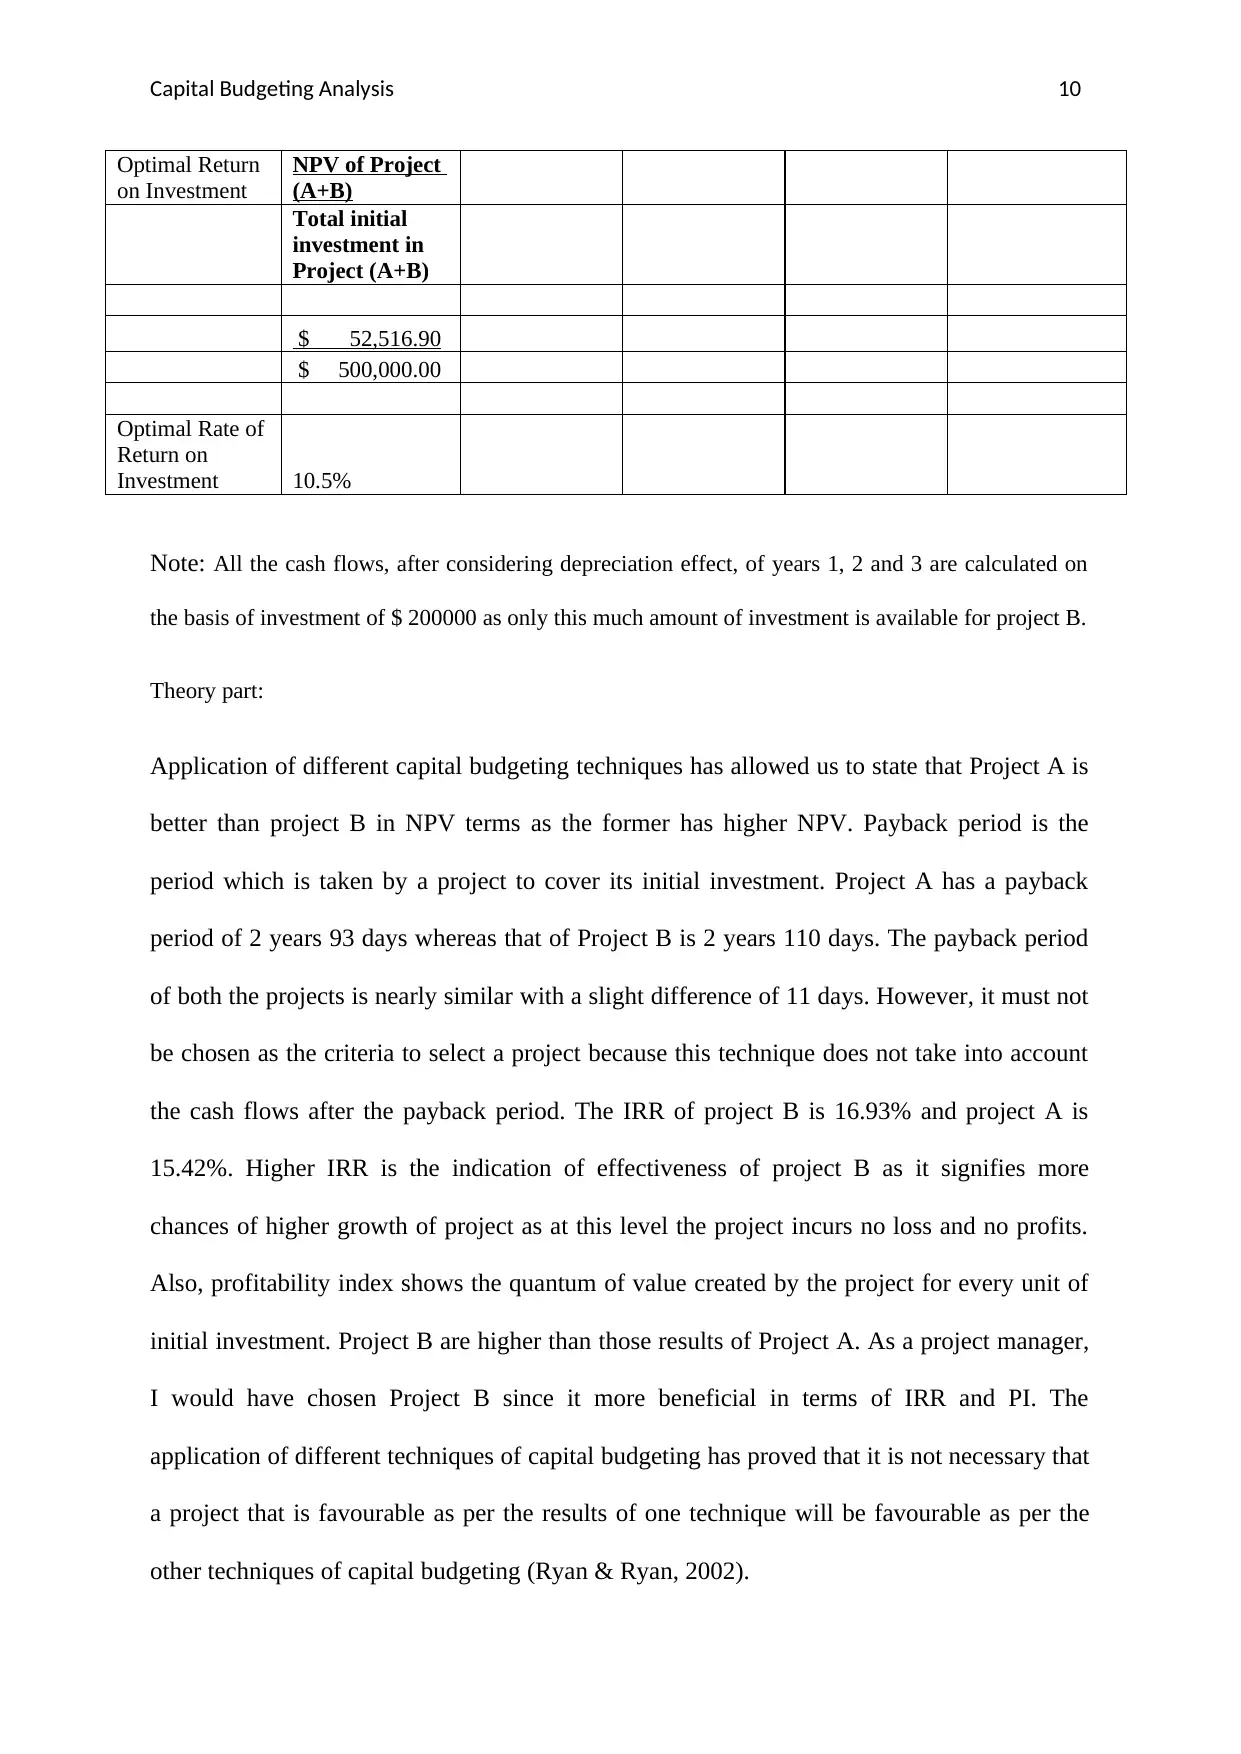
Optimal Return
on Investment
NPV of Project
(A+B)
Total initial
investment in
Project (A+B)
$ 52,516.90
$ 500,000.00
Optimal Rate of
Return on
Investment 10.5%
Note: All the cash flows, after considering depreciation effect, of years 1, 2 and 3 are calculated on
the basis of investment of $ 200000 as only this much amount of investment is available for project B.
Theory part:
Application of different capital budgeting techniques has allowed us to state that Project A is
better than project B in NPV terms as the former has higher NPV. Payback period is the
period which is taken by a project to cover its initial investment. Project A has a payback
period of 2 years 93 days whereas that of Project B is 2 years 110 days. The payback period
of both the projects is nearly similar with a slight difference of 11 days. However, it must not
be chosen as the criteria to select a project because this technique does not take into account
the cash flows after the payback period. The IRR of project B is 16.93% and project A is
15.42%. Higher IRR is the indication of effectiveness of project B as it signifies more
chances of higher growth of project as at this level the project incurs no loss and no profits.
Also, profitability index shows the quantum of value created by the project for every unit of
initial investment. Project B are higher than those results of Project A. As a project manager,
I would have chosen Project B since it more beneficial in terms of IRR and PI. The
application of different techniques of capital budgeting has proved that it is not necessary that
a project that is favourable as per the results of one technique will be favourable as per the
other techniques of capital budgeting (Ryan & Ryan, 2002).
⊘ This is a preview!⊘
Do you want full access?
Subscribe today to unlock all pages.
Trusted by 1+ million students worldwide
Capital Budgeting Analysis 10
Yes, it is correct to say that all the shareholders whether small or larger ones are treated
equally in the eyes of law except the fact that bigger shareholders have higher voting rights.
All the shareholders are provided equal rate of returns by way of dividend, irrespective of the
fact that how many shares are held by them. For example, if a shareholder of the company is
holding only 20 shares and the other shareholder is holding 500 shares. Now, if the company
declares the dividend at 14 %, then all the shareholders will be given a dividend per share at
14% of the face value of the shares held by them. However, corporate law states that for each
share, there is one voting rights. This shows that all the shareholders whether small or bigger
ones have equal voting right per shares. But, whenever a decision is to be taken in the
company the voting rights of large shareholders will prevail over small shareholders as the
former will have more voting rights because of more number of shares held by them (Wong,
2013).
There are various sources of finance available to a company. But majorly finance is raised
either through the issue of equity shares or preference shares or banks loans or through the
issuance of debentures or bonds (Beck, Levine & Loayza, 2000). With each source of
finance, there are some qualities attached like equity shareholders of the company are its
owners whereas banks or debenture-holders are the lenders of the company who charge
interest in consideration of provision of debt financing to the company. However, the
preference shareholders of the company are hybrid natured as they are neither the pure
owners nor the pure lenders of debt to the company (Beck, Demirgüç-Kunt, & Maksimovic,
2008). They enjoy preference of dividend over the equity shareholders of the company as
they are offered the dividend firstly and in case if there remains any surplus after payment of
preference dividend, then only equity shareholders are entitled to the dividend. Also, since
equity shareholders obtain ownership of the company they have the privilege to participate in
Paraphrase This Document
Need a fresh take? Get an instant paraphrase of this document with our AI Paraphraser
Capital Budgeting Analysis 10
the important business matters through their voting rights so that they can satisfy themselves
about the functioning of company.
Answer 2:
Internal rate of return is one of key technique used while making capital budgeting related
decisions. It is the important metric that is applied to determine whether to invest funds and
other resources in a particular investment or not (Management Study Guide, 2018).
Calculation of IRR requires taking into consideration the concept of money’s time value.
Also, the total cash flows that the project is going to generate are considered by it. The results
obtained under this technique are sophisticated and realistic in nature but it suffers from
certain limitations and pitfalls which will be discussed further.
Problem 1: Multiplicity of rate of returns:
The mathematical formula that is used to calculate IRR is quite complex and not every time it
provides the correct and realistic answers. In various cases, the IRR calculation actually ends
up offering multiple rates due to the pattern of cash flows occurred in such situations.
Therefore, in those cases results for IRR comes out multiple rates instead of one particular
rate that can be used and analysed by the project manager to understand the project’s
feasibility. At times, IRR comes out as negative which indicates that the project firm is
actually losing its value. However, in the practical world it is not possible. In cases where
cash flows varies on both positive and negative sides with the change in time, application of
IRR method to select a capital project, leads to incorrect decisions. In such cases Net present
Value technique of capital budgeting proves to be correct as it provides better results even in
the case of changes in the pattern of project’s cash flows (Management Study Guide, 2018).
Capital Budgeting Analysis 10
Problem 2: Multiplicity of discounting rates:
IRR takes into account the Time Value of Money (TVM) and the concept of TVM tell that
there are different cost of capital that keeps on changing because of increase in the number of
project years. To use the method of IRR in such cases, a project manager must either use IRR
and the discounting rate factors at such rate for each year or they can compute a weighted
average IRR to take project decisions. However, in either ways, the calculation becomes
hassle and also the interpretation of outcomes of IRR gets tough. Use of NPV is quite easier
in such cases as it takes into account all the cash flows throughout the project life and on the
basis of their present values, provides the final outcome that is used to determine the project
feasibility (Bennouna, K., Meredith & Marchant, 2010).
At IRR, NPV of the project is zero and NPV calculates the amount that will be added to the
shareholder’s wealth if the project is accepted. IRR method doesn’t understand the value of
economies of scale and therefore it neglects the project’s dollar value. If two projects have
identical IRR but different dollar values, IRR would not differentiate between those two
projects and that often leads to the wrong decisions by the project manager and ultimately it
affects the profitability of project that in turn affects the returns of project’s shareholders.
However, NPV offers results in absolute dollar terms therefore it enables the managers to
undertake the decisions that positively contributes to enhancement of shareholder’s wealth
(Finance Management, 2018).
⊘ This is a preview!⊘
Do you want full access?
Subscribe today to unlock all pages.
Trusted by 1+ million students worldwide

Capital Budgeting Analysis 10
References:
Beck, T., Demirgüç-Kunt, A., & Maksimovic, V. (2008). Financing patterns around the
world: Are small firms different?. Journal of Financial Economics, 89(3), 467-487.
Beck, T., Levine, R., & Loayza, N. (2000). Finance and the Sources of Growth. Journal of
financial economics, 58(1-2), 261-300.
Bennouna, K., Meredith, G. G., & Marchant, T. (2010). Improved capital budgeting decision
making: evidence from Canada. Management decision, 48(2), 225-247.
Finance Management. (2018). Why Net Present Value is the Best Measure for Investment
Appraisal? Retrieved from:
https://efinancemanagement.com/investment-decisions/why-net-present-value-is-the-
best-measure-for-investment-appraisal
Management Study Guide. (2018). Problems With Using Internal Rate of Return (IRR) for
Investment Decision Making. Retrieved from:
https://www.managementstudyguide.com/problems-with-using-internal-rate-of-
return.htm
Management Study Guide. (2018). What is Internal Rate of Return (IRR) ? Retrieved from:
https://www.managementstudyguide.com/internal-rate-of-return.htm
Ryan, P. A., & Ryan, G. P. (2002). Capital budgeting practices of the Fortune 1000: how
have things changed. Journal of business and management, 8(4), 355-364.
Wong., S. (2013). Rethinking “One Share, One Vote”. Retrieved from:
https://hbr.org/2013/01/rethinking-one-share-one-vote.
Paraphrase This Document
Need a fresh take? Get an instant paraphrase of this document with our AI Paraphraser

Capital Budgeting Analysis 10
1 out of 11
Related Documents


Your All-in-One AI-Powered Toolkit for Academic Success.
+13062052269
info@desklib.com
Available 24*7 on WhatsApp / Email
![[object Object]](/_next/static/media/star-bottom.7253800d.svg)
Unlock your academic potential
Copyright © 2020–2026 A2Z Services. All Rights Reserved. Developed and managed by ZUCOL.