Financial Viability: Capital Budgeting and Ratio Analysis Methods

Verified

Added on  2023/06/18

|16
|2669
|105
Report
AI Summary
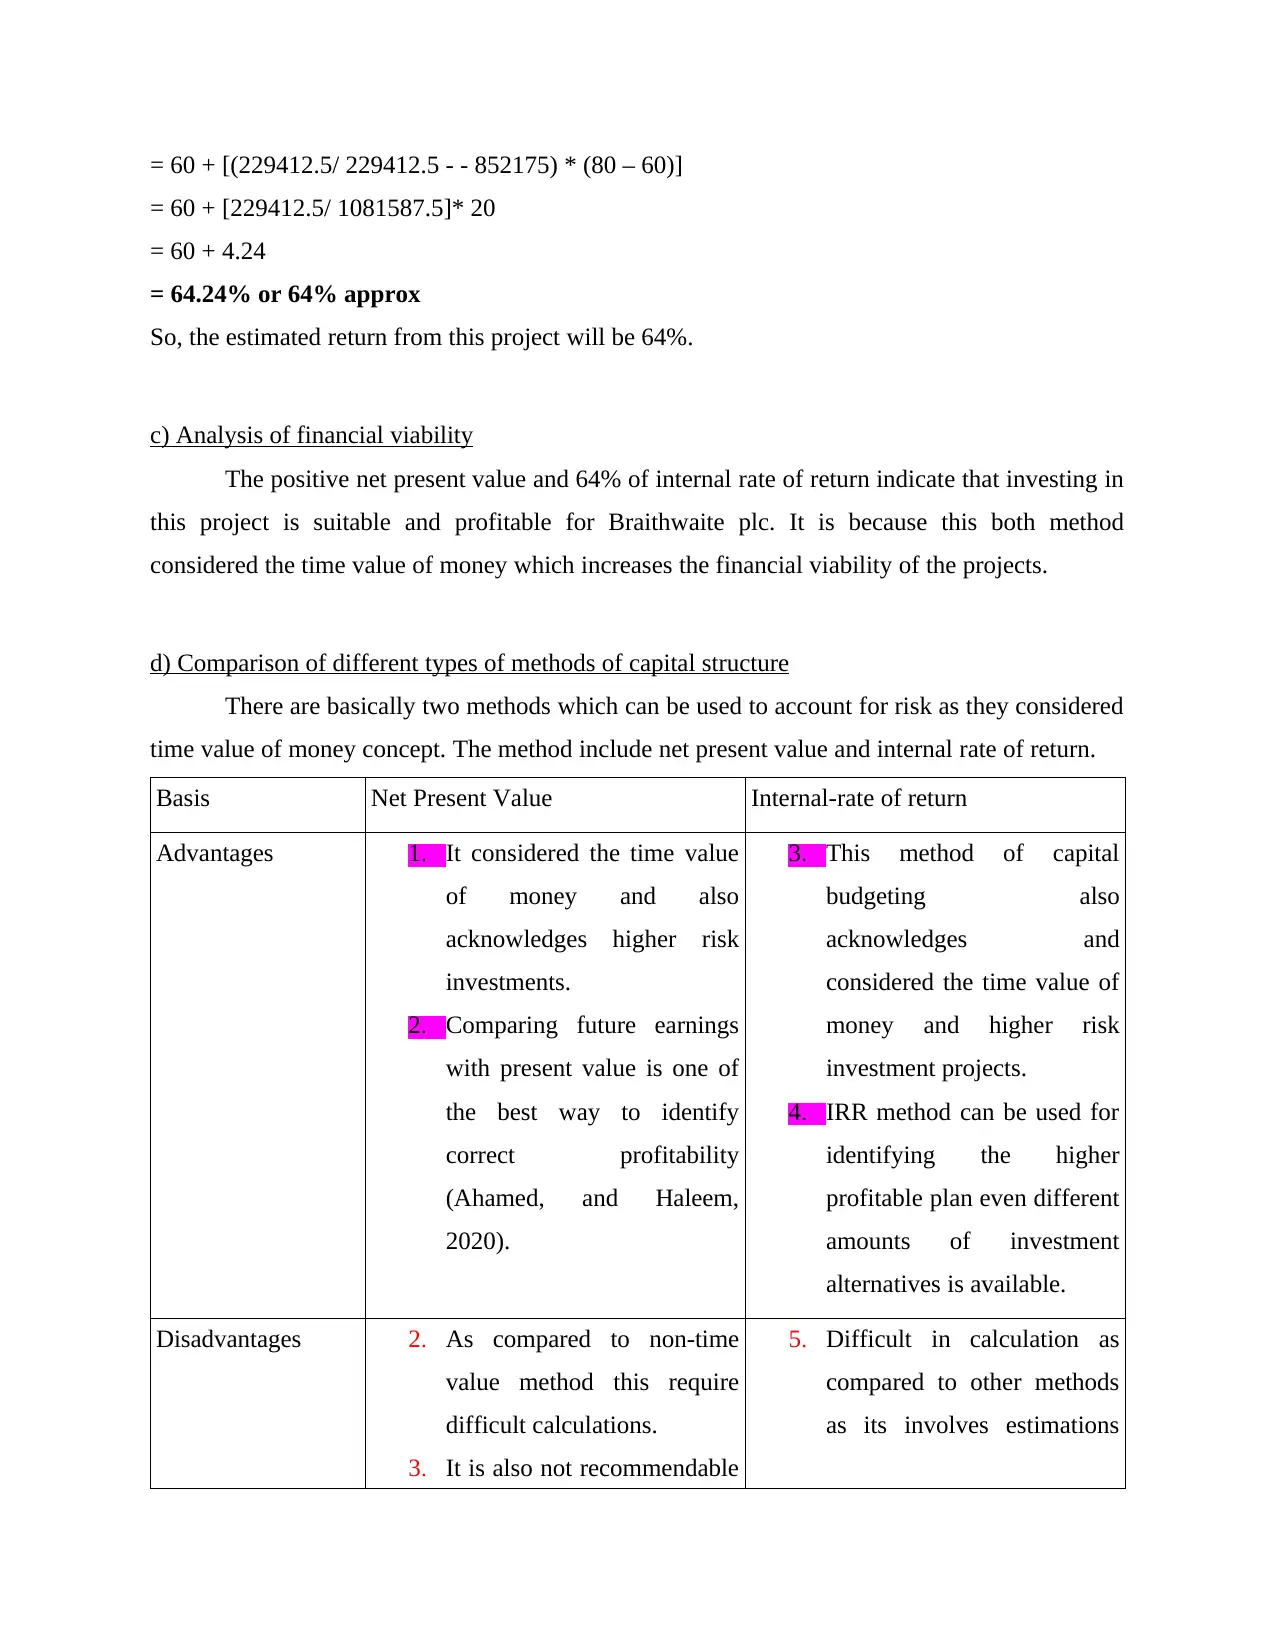
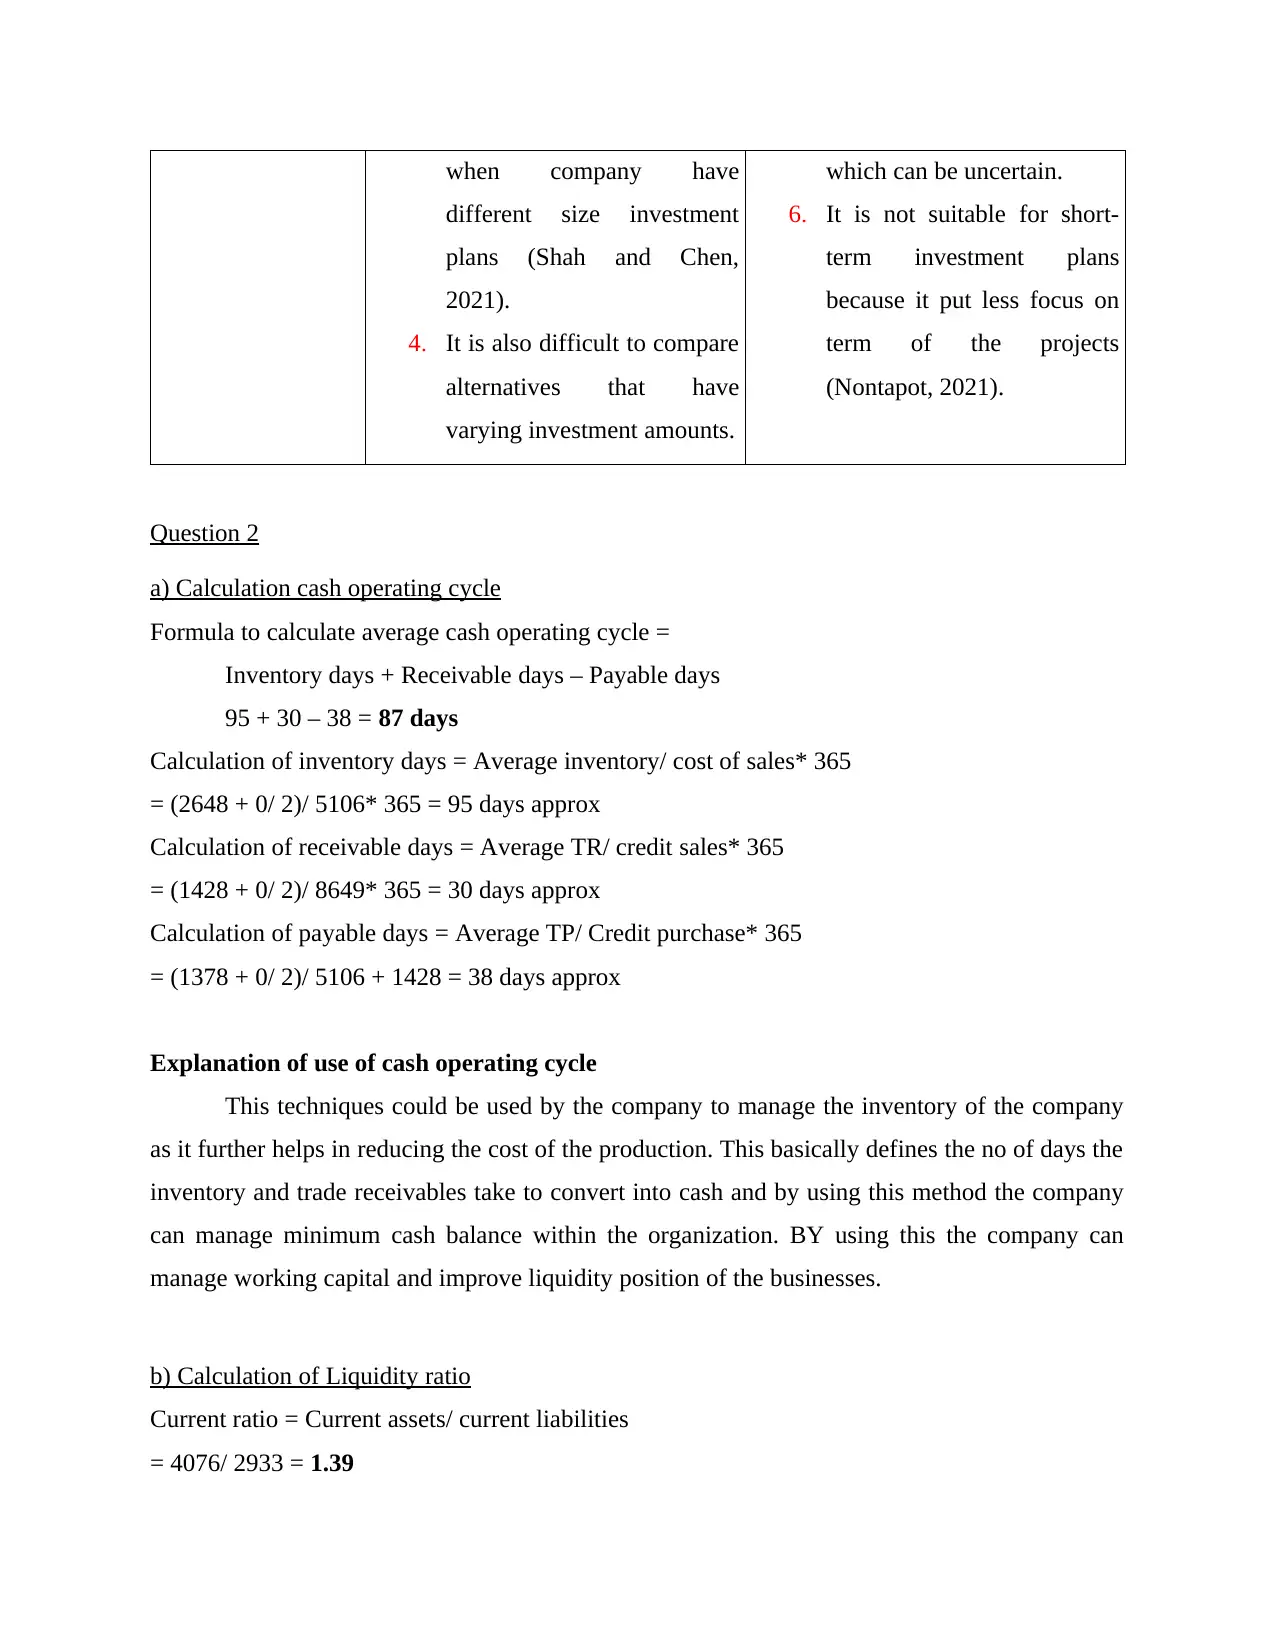
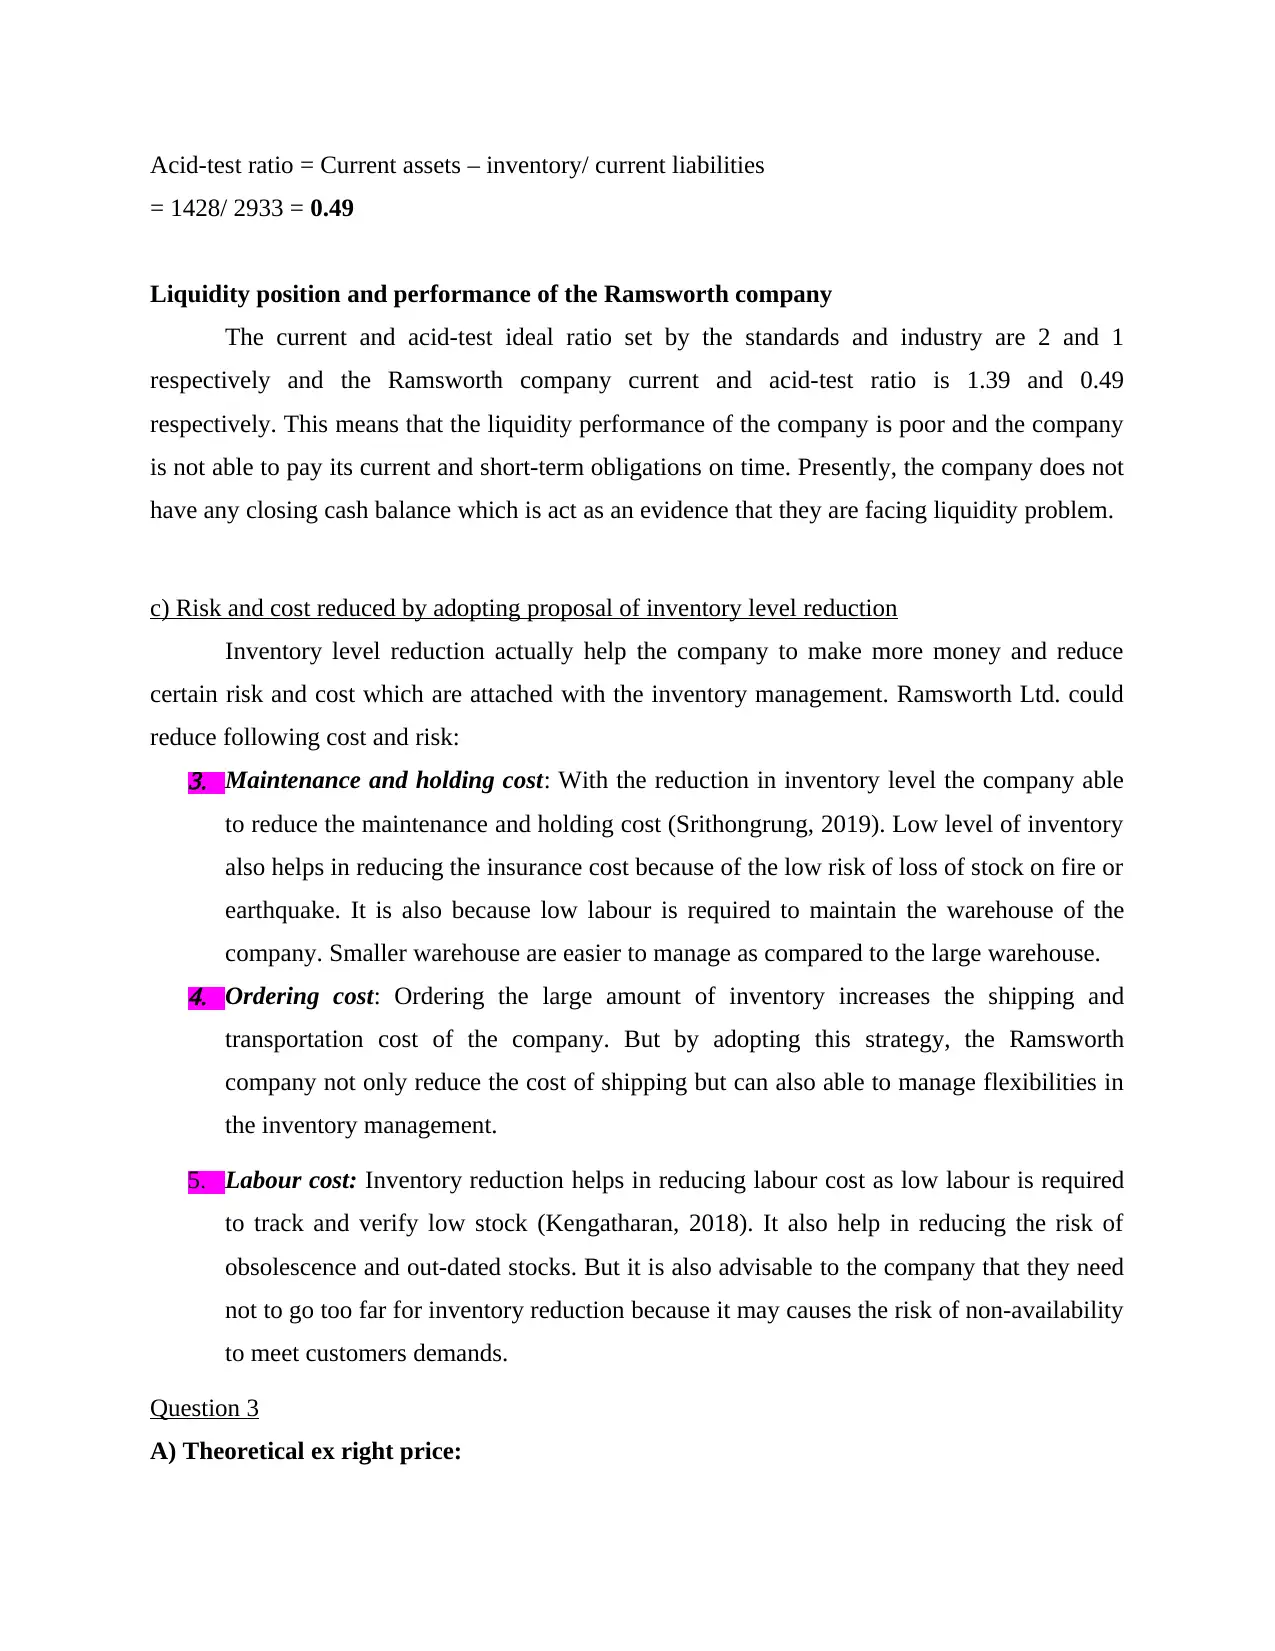
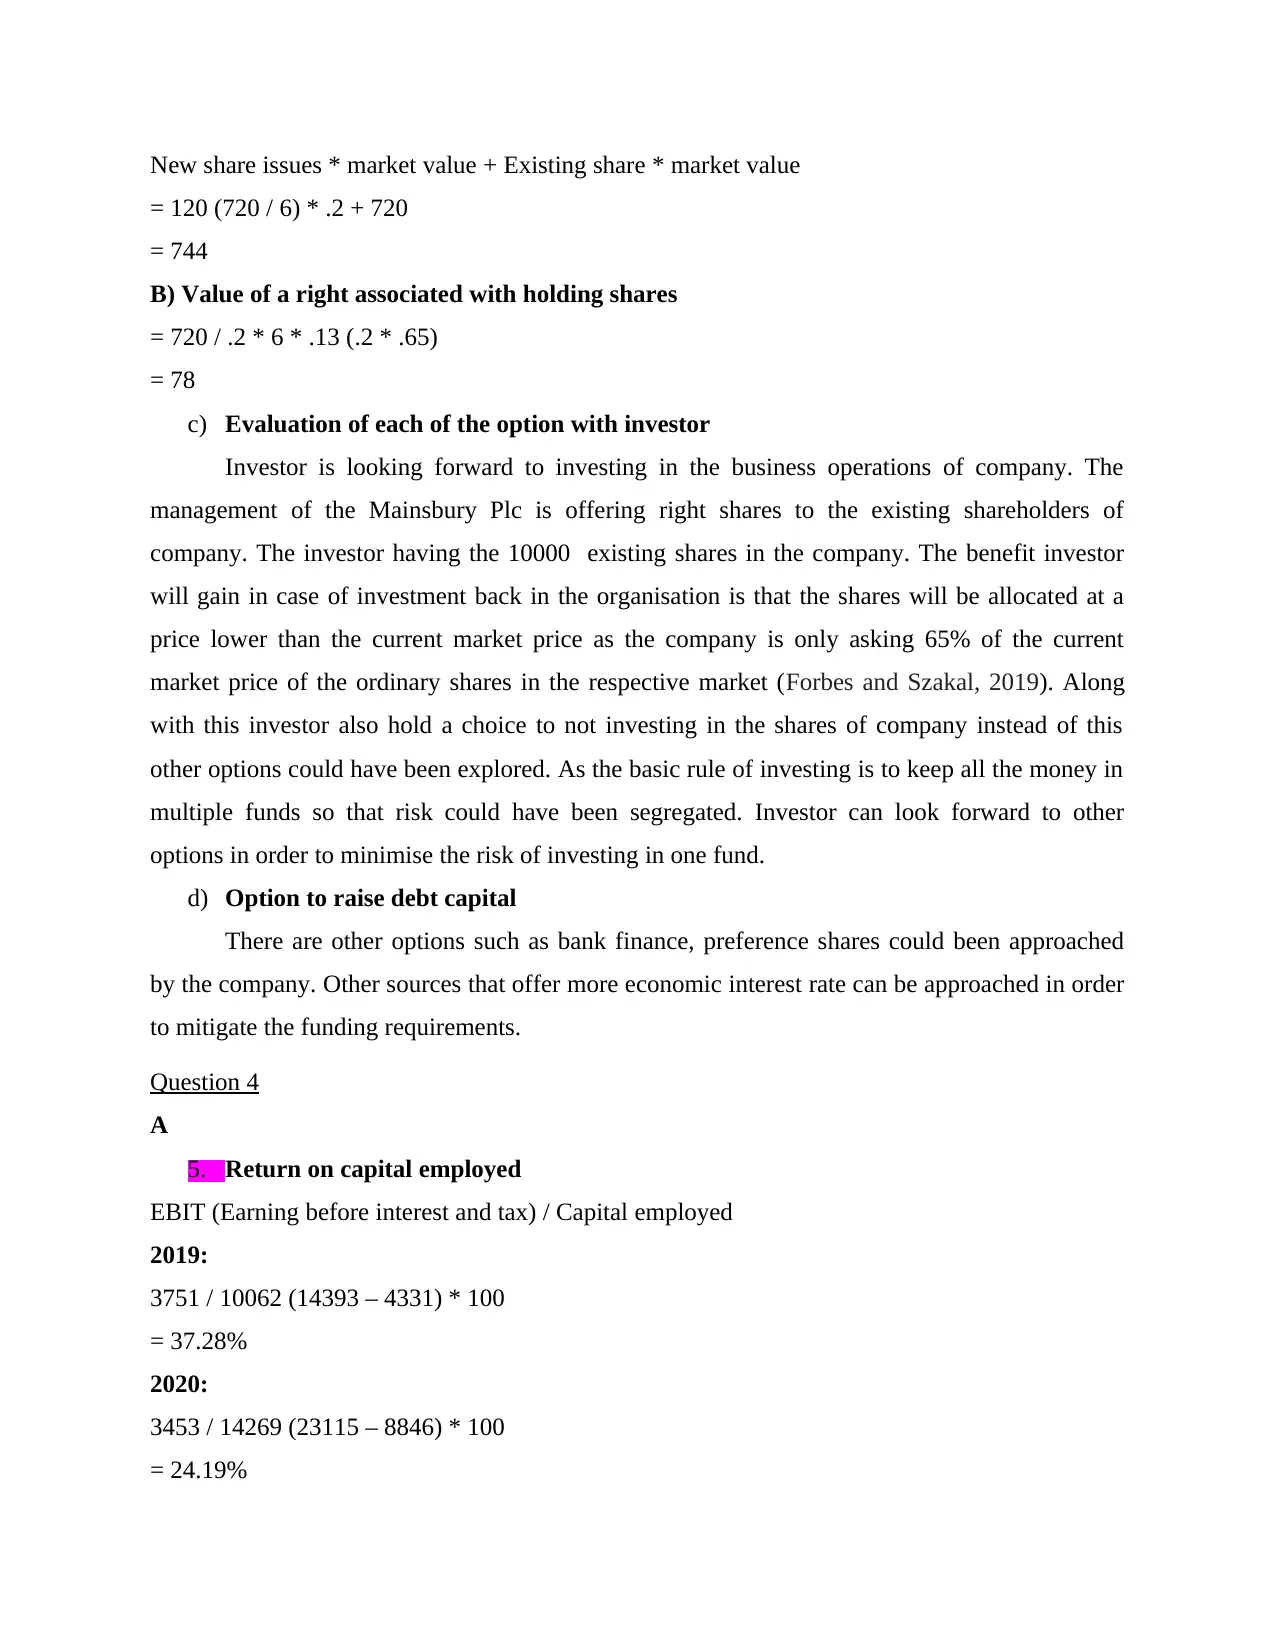
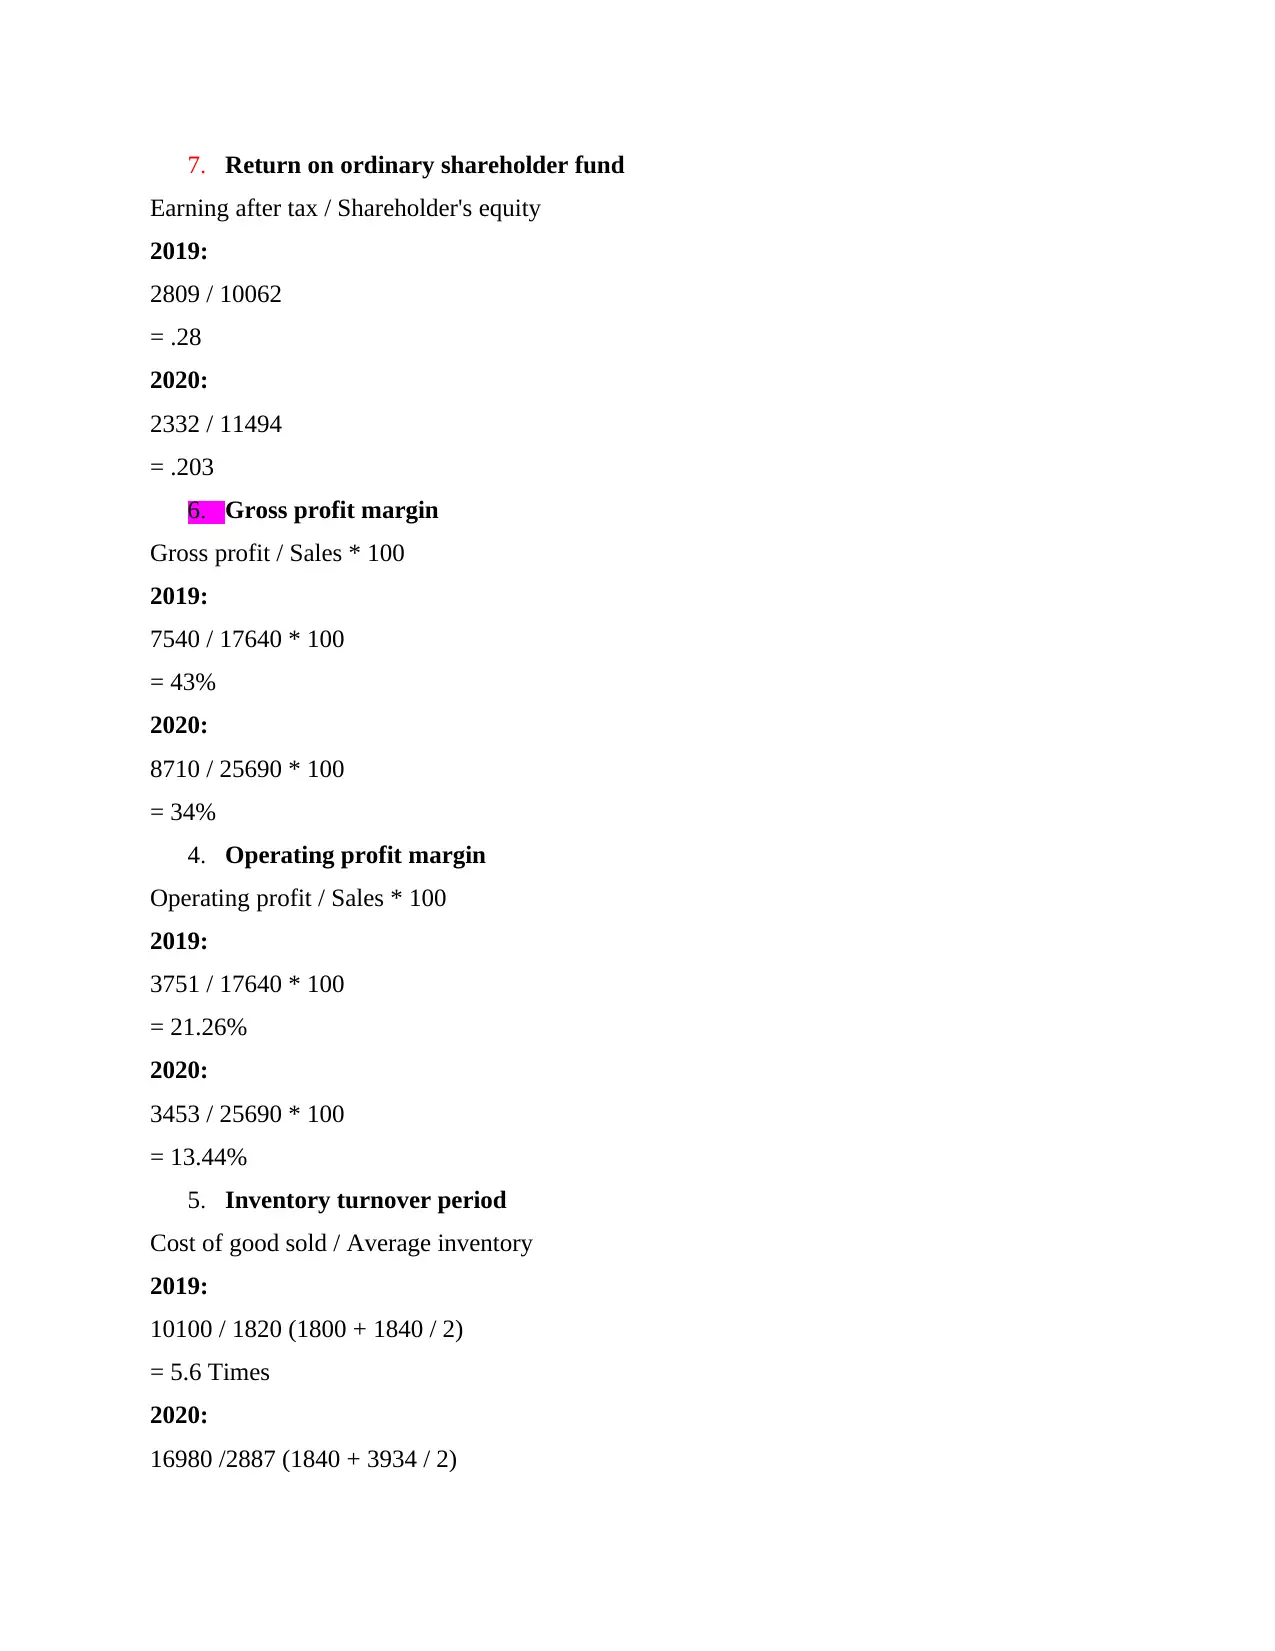
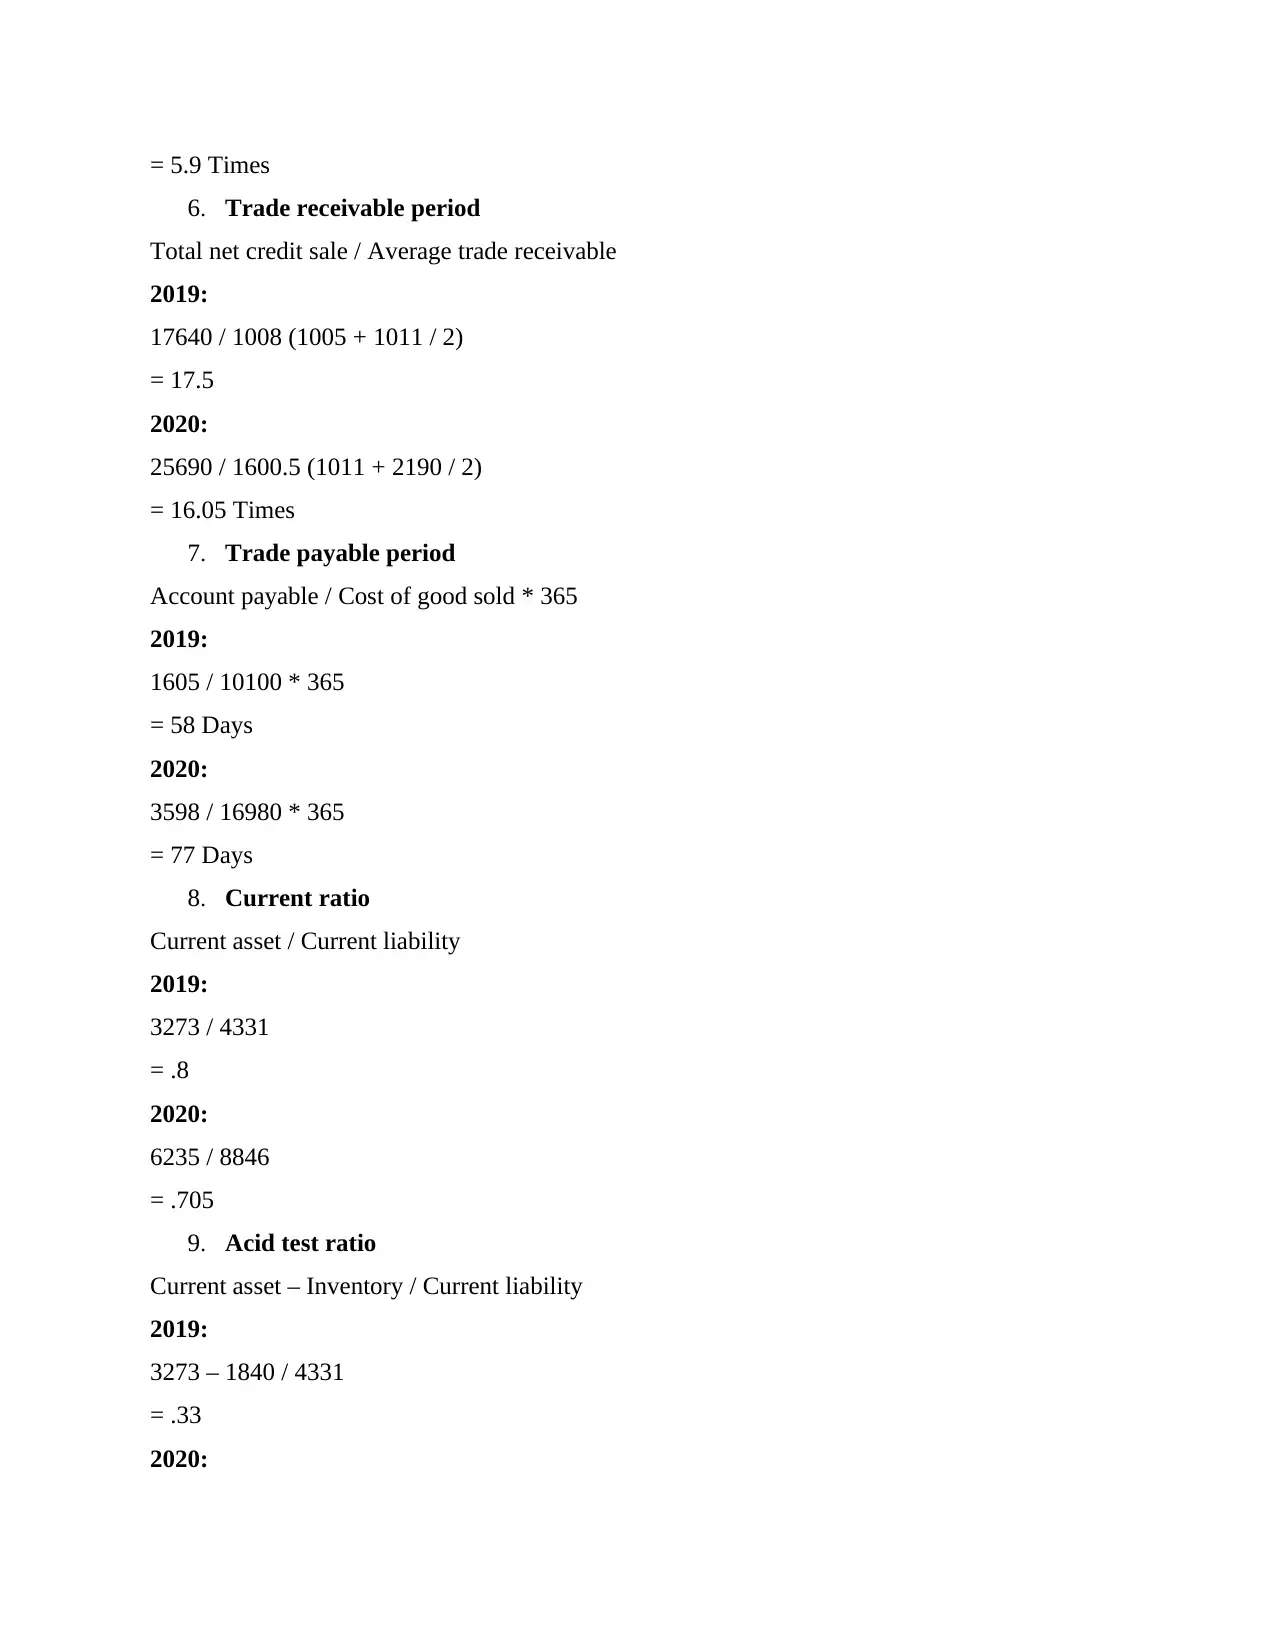
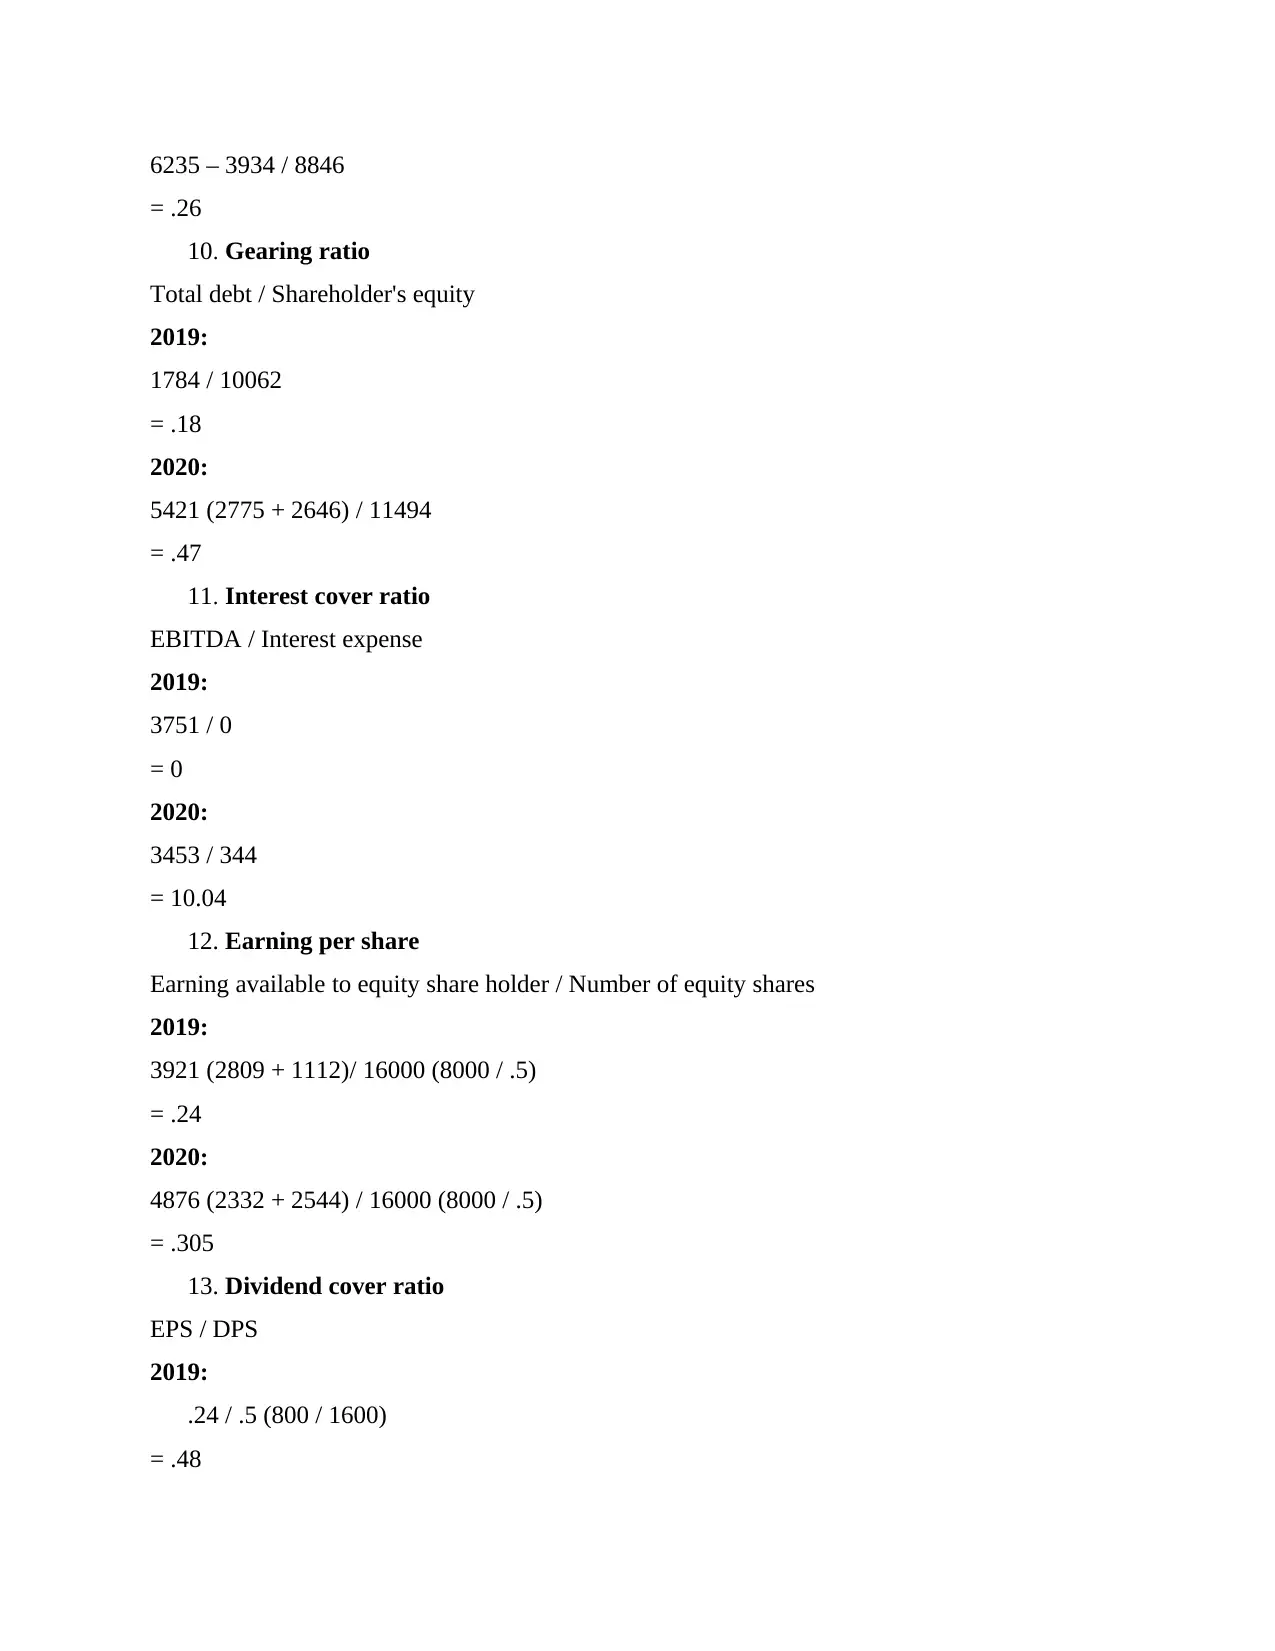
This assignment provides a detailed analysis of business finance concepts, focusing on capital budgeting and ratio analysis. It begins with calculating annual relevant cash flows and net present value for a project, followed by determining the internal rate of return (IRR) and assessing the project's financial viability. The report also compares different capital structure methods, including net present value and internal rate of return, highlighting their advantages and disadvantages. Furthermore, the assignment calculates the cash operating cycle, liquidity ratios (current and acid-test ratios), and discusses how reducing inventory levels can lower costs and risks for a company. Finally, it evaluates right share options for investors and analyzes various financial ratios to assess a company's financial position, including return on capital employed, gross profit margin, operating profit margin, inventory turnover period, trade receivable period, trade payable period, current ratio, acid test ratio, gearing ratio, interest cover ratio, earning per share, and dividend cover ratio.
Document Page
BUSINESS FINANCE
tabler-icon-diamond-filled.svg

Secure Best Marks with AI Grader

Need help grading? Try our AI Grader for instant feedback on your assignments.
Document Page
Table of Contents
INTRODUCTION...........................................................................................................................5
Question 1...................................................................................................................................5
a) Calculation of Annual relevant cash flows and Net Present Value........................................5
b) Calculation of Internal Rate of Return....................................................................................7
c) Analysis of financial viability.................................................................................................9
d) Comparison of different types of methods of capital structure..............................................9
Question 2.................................................................................................................................10
a) Calculation cash operating cycle...........................................................................................10
b) Calculation of Liquidity ratio...............................................................................................10
c) Risk and cost reduced by adopting proposal of inventory level reduction...........................11
Question 3.................................................................................................................................11
Question 4.................................................................................................................................12
CONCLUDION.............................................................................................................................16
REFERENCES................................................................................................................................1
REFERENCES................................................................................................................................2
Document Page
INTRODUCTION
Business Finance means management of various sources of finance with the help of
which company can manage their different business activities. Starting the businesses and
managing it requires lot of money which are basically one of the crucial part of top management.
The report will discuss the various methods and concepts of capital budgeting and ratio analysis.
Further, the report will also calculate the cash operating cycle along and discuss the use of it to
the businesses.
Question 1
a) Calculation of Annual relevant cash flows and Net Present Value
Annual Relevant Cash Flows
Calculation of Initial cost of project
= Present value of Lease rent + Initial cost of Plant
= £2376000 + £2500000 = £4876000
Document Page
Calculation of Net present value of the project
b) Calculation of Internal Rate of Return
Years Cash flows
(£)
Discounting
factor @ 80%
Present value
of cash flows
Discounting
tabler-icon-diamond-filled.svg

Secure Best Marks with AI Grader

Need help grading? Try our AI Grader for instant feedback on your assignments.
Document Page
(£) factor @60%
Initial cost or
present value
of cash
outflow (A)
4876000 1 4876000 1 4876000
Present Value
of the cash
inflow:
2011 3240000 0.55 1782000 0.63 2041200
2012 3581250 0.31 1110187.5 0.39 1396688
2013 4503750 0.17 765637.5 0.24 1080900
2014 2907500 0.1 290750 0.15 436125
2015 1505000 0.05 75250 0.1 150500
Total Present
value of cash
inflow (B)
4023825 5105412.5
Net Present Value (B) - (A) -852175 229412.5
Formula of IRR:
Document Page
= 60 + [(229412.5/ 229412.5 - - 852175) * (80 – 60)]
= 60 + [229412.5/ 1081587.5]* 20
= 60 + 4.24
= 64.24% or 64% approx
So, the estimated return from this project will be 64%.
c) Analysis of financial viability
The positive net present value and 64% of internal rate of return indicate that investing in
this project is suitable and profitable for Braithwaite plc. It is because this both method
considered the time value of money which increases the financial viability of the projects.
d) Comparison of different types of methods of capital structure
There are basically two methods which can be used to account for risk as they considered
time value of money concept. The method include net present value and internal rate of return.
Basis Net Present Value Internal-rate of return
Advantages 1. It considered the time value
of money and also
acknowledges higher risk
investments.
2. Comparing future earnings
with present value is one of
the best way to identify
correct profitability
(Ahamed, and Haleem,
2020).
3. This method of capital
budgeting also
acknowledges and
considered the time value of
money and higher risk
investment projects.
4. IRR method can be used for
identifying the higher
profitable plan even different
amounts of investment
alternatives is available.
Disadvantages 2. As compared to non-time
value method this require
difficult calculations.
3. It is also not recommendable
5. Difficult in calculation as
compared to other methods
as its involves estimations
Document Page
when company have
different size investment
plans (Shah and Chen,
2021).
4. It is also difficult to compare
alternatives that have
varying investment amounts.
which can be uncertain.
6. It is not suitable for short-
term investment plans
because it put less focus on
term of the projects
(Nontapot, 2021).
Question 2
a) Calculation cash operating cycle
Formula to calculate average cash operating cycle =
Inventory days + Receivable days – Payable days
95 + 30 – 38 = 87 days
Calculation of inventory days = Average inventory/ cost of sales* 365
= (2648 + 0/ 2)/ 5106* 365 = 95 days approx
Calculation of receivable days = Average TR/ credit sales* 365
= (1428 + 0/ 2)/ 8649* 365 = 30 days approx
Calculation of payable days = Average TP/ Credit purchase* 365
= (1378 + 0/ 2)/ 5106 + 1428 = 38 days approx
Explanation of use of cash operating cycle
This techniques could be used by the company to manage the inventory of the company
as it further helps in reducing the cost of the production. This basically defines the no of days the
inventory and trade receivables take to convert into cash and by using this method the company
can manage minimum cash balance within the organization. BY using this the company can
manage working capital and improve liquidity position of the businesses.
b) Calculation of Liquidity ratio
Current ratio = Current assets/ current liabilities
= 4076/ 2933 = 1.39
tabler-icon-diamond-filled.svg

Paraphrase This Document

Need a fresh take? Get an instant paraphrase of this document with our AI Paraphraser
Document Page
Acid-test ratio = Current assets – inventory/ current liabilities
= 1428/ 2933 = 0.49
Liquidity position and performance of the Ramsworth company
The current and acid-test ideal ratio set by the standards and industry are 2 and 1
respectively and the Ramsworth company current and acid-test ratio is 1.39 and 0.49
respectively. This means that the liquidity performance of the company is poor and the company
is not able to pay its current and short-term obligations on time. Presently, the company does not
have any closing cash balance which is act as an evidence that they are facing liquidity problem.
c) Risk and cost reduced by adopting proposal of inventory level reduction
Inventory level reduction actually help the company to make more money and reduce
certain risk and cost which are attached with the inventory management. Ramsworth Ltd. could
reduce following cost and risk:3. Maintenance and holding cost: With the reduction in inventory level the company able
to reduce the maintenance and holding cost (Srithongrung, 2019). Low level of inventory
also helps in reducing the insurance cost because of the low risk of loss of stock on fire or
earthquake. It is also because low labour is required to maintain the warehouse of the
company. Smaller warehouse are easier to manage as compared to the large warehouse.4. Ordering cost: Ordering the large amount of inventory increases the shipping and
transportation cost of the company. But by adopting this strategy, the Ramsworth
company not only reduce the cost of shipping but can also able to manage flexibilities in
the inventory management.
5. Labour cost: Inventory reduction helps in reducing labour cost as low labour is required
to track and verify low stock (Kengatharan, 2018). It also help in reducing the risk of
obsolescence and out-dated stocks. But it is also advisable to the company that they need
not to go too far for inventory reduction because it may causes the risk of non-availability
to meet customers demands.
Question 3
A) Theoretical ex right price:
Document Page
New share issues * market value + Existing share * market value
= 120 (720 / 6) * .2 + 720
= 744
B) Value of a right associated with holding shares
= 720 / .2 * 6 * .13 (.2 * .65)
= 78
c) Evaluation of each of the option with investor
Investor is looking forward to investing in the business operations of company. The
management of the Mainsbury Plc is offering right shares to the existing shareholders of
company. The investor having the 10000 existing shares in the company. The benefit investor
will gain in case of investment back in the organisation is that the shares will be allocated at a
price lower than the current market price as the company is only asking 65% of the current
market price of the ordinary shares in the respective market (Forbes and Szakal, 2019). Along
with this investor also hold a choice to not investing in the shares of company instead of this
other options could have been explored. As the basic rule of investing is to keep all the money in
multiple funds so that risk could have been segregated. Investor can look forward to other
options in order to minimise the risk of investing in one fund.
d) Option to raise debt capital
There are other options such as bank finance, preference shares could been approached
by the company. Other sources that offer more economic interest rate can be approached in order
to mitigate the funding requirements.
Question 4
A
5. Return on capital employed
EBIT (Earning before interest and tax) / Capital employed
2019:
3751 / 10062 (14393 – 4331) * 100
= 37.28%
2020:
3453 / 14269 (23115 – 8846) * 100
= 24.19%
Document Page
7. Return on ordinary shareholder fund
Earning after tax / Shareholder's equity
2019:
2809 / 10062
= .28
2020:
2332 / 11494
= .203
6. Gross profit margin
Gross profit / Sales * 100
2019:
7540 / 17640 * 100
= 43%
2020:
8710 / 25690 * 100
= 34%
4. Operating profit margin
Operating profit / Sales * 100
2019:
3751 / 17640 * 100
= 21.26%
2020:
3453 / 25690 * 100
= 13.44%
5. Inventory turnover period
Cost of good sold / Average inventory
2019:
10100 / 1820 (1800 + 1840 / 2)
= 5.6 Times
2020:
16980 /2887 (1840 + 3934 / 2)
tabler-icon-diamond-filled.svg

Secure Best Marks with AI Grader

Need help grading? Try our AI Grader for instant feedback on your assignments.
Document Page
= 5.9 Times
6. Trade receivable period
Total net credit sale / Average trade receivable
2019:
17640 / 1008 (1005 + 1011 / 2)
= 17.5
2020:
25690 / 1600.5 (1011 + 2190 / 2)
= 16.05 Times
7. Trade payable period
Account payable / Cost of good sold * 365
2019:
1605 / 10100 * 365
= 58 Days
2020:
3598 / 16980 * 365
= 77 Days
8. Current ratio
Current asset / Current liability
2019:
3273 / 4331
= .8
2020:
6235 / 8846
= .705
9. Acid test ratio
Current asset – Inventory / Current liability
2019:
3273 – 1840 / 4331
= .33
2020:
Document Page
6235 – 3934 / 8846
= .26
10. Gearing ratio
Total debt / Shareholder's equity
2019:
1784 / 10062
= .18
2020:
5421 (2775 + 2646) / 11494
= .47
11. Interest cover ratio
EBITDA / Interest expense
2019:
3751 / 0
= 0
2020:
3453 / 344
= 10.04
12. Earning per share
Earning available to equity share holder / Number of equity shares
2019:
3921 (2809 + 1112)/ 16000 (8000 / .5)
= .24
2020:
4876 (2332 + 2544) / 16000 (8000 / .5)
= .305
13. Dividend cover ratio
EPS / DPS
2019:
.24 / .5 (800 / 1600)
= .48
Document Page
2020:
.305 / .5625 (900 / 1600)
= .54
b) Changes in the financial position of company
Return on capital employed is determined as 37.28% for the financial year 2019 whereas,
the same is for the year 2020 is 24.19%. Return on ordinary shareholder fund is .28 for the
financial year 2019 and the same ratio is for the financial year 2020 is .203. Gross profit margin
for the company in the year 2019 is 43% and on the other side the ratio is the year 2020 is 34%.
Operating profit margin that is identified as the profitability company has witnessed against
channelising the operations of company (Sugawara and et.al., 2017). The ratio is identified as
21.26% in the year 2019 whereas the same ratio is 13.44% in the financial year 2020. Inventory
turnover period evaluated and identified as 5.6 times in the year 2019 whereas, for the financial
year 2020 the ratio is 5.9 times. Trade receivable period is 17.5 times and in context to the
financial year 2020 the ratio is 16.05 times. Trade payable days for the year 2019 is 58 days and
on the other side the days are 77 in numbers for the financial year 2020. Current ratio identified
as .8 in the year 2019 and on the other hand the ratio is .705 for the year 2020. Acid test ratio
is .33 for the financial year 2019 and the same in the year 2020 is .26. The other ratios are also
decreased in the year 2020. This can certainly demonstrate the fact that the overall performance
of the organisation is decreased in the financial year 2020 whereas the same was much better in
the year 2019 (Maden and et.al., 2018). This can be indicated that the liquidity situation also got
affected in the year 2020 whereas the liquidity situation was much better in the year 2019 that
also became a reason behind the decline in the overall performance of the business organisation.
CONCLUDION
Cash flow position is the situation of all the cash inflow and outflow from the business
organisation. Ratio analysis is the bets way to assess the overall performance of the business
organisation. This is significantly determined as a fact that the organisation is performed better in
the financial year 2019 whereas in comparison to the year 2020 the performance is slightly
declined for the company.
tabler-icon-diamond-filled.svg

Paraphrase This Document

Need a fresh take? Get an instant paraphrase of this document with our AI Paraphraser
Document Page
REFERENCES
Books and journals
Ahamed, S. T. and Haleem, A., 2020. The influence of cognitive bias of the managers in the
selection and use of capital budgeting techniques: evidence of Sri Lanka.
Forbes, T. P. and Szakal, C., 2019. Considerations for uranium isotope ratio analysis by
atmospheric pressure ionization mass spectrometry. Analyst. 144(1). pp.317-323.
Kengatharan, L., 2018. Capital Budgeting Theory and Practice: A review and agenda for future
research. American Journal of economics and business management. 1(1). pp.20-53.
Maden, C. and et.al., 2018. Design of a prototype thermal ionization cavity source intended for
isotope ratio analysis. International Journal of Mass Spectrometry, 434, pp.70-80.
Nontapot, P., 2021. Inventory reduction by smaller production batch size: case study of a
confectionery company.
Shah, S. and Chen, S., 2021, March. Use of Improvement Strategies for Excessive Inventory
Levels Reduction. In 2021 International Conference on Computational Intelligence and
Knowledge Economy (ICCIKE) (pp. 181-186). IEEE.
Srithongrung, A., 2019. Testing public capital budgeting and management theory using panel
data analysis methods. SAGE Publications Ltd.
Sugawara, N. and et.al., 2017. Application of a stratum-specific likelihood ratio analysis in a
screen for depression among a community-dwelling population in
Japan. Neuropsychiatric disease and treatment. 13. p.2369.
1
Document Page
REFERENCES
2
Document Page
Books and Journal
3
chevron_up_icon
1 out of 16
circle_padding
hide_on_mobile
zoom_out_icon
logo.png

Your All-in-One AI-Powered Toolkit for Academic Success.

Available 24*7 on WhatsApp / Email

[object Object]