Financial Report: Capital Budgeting Analysis for Powerboat Projects

Verified

Added on  2021/06/15

|4
|1108
|27
Report
AI Summary
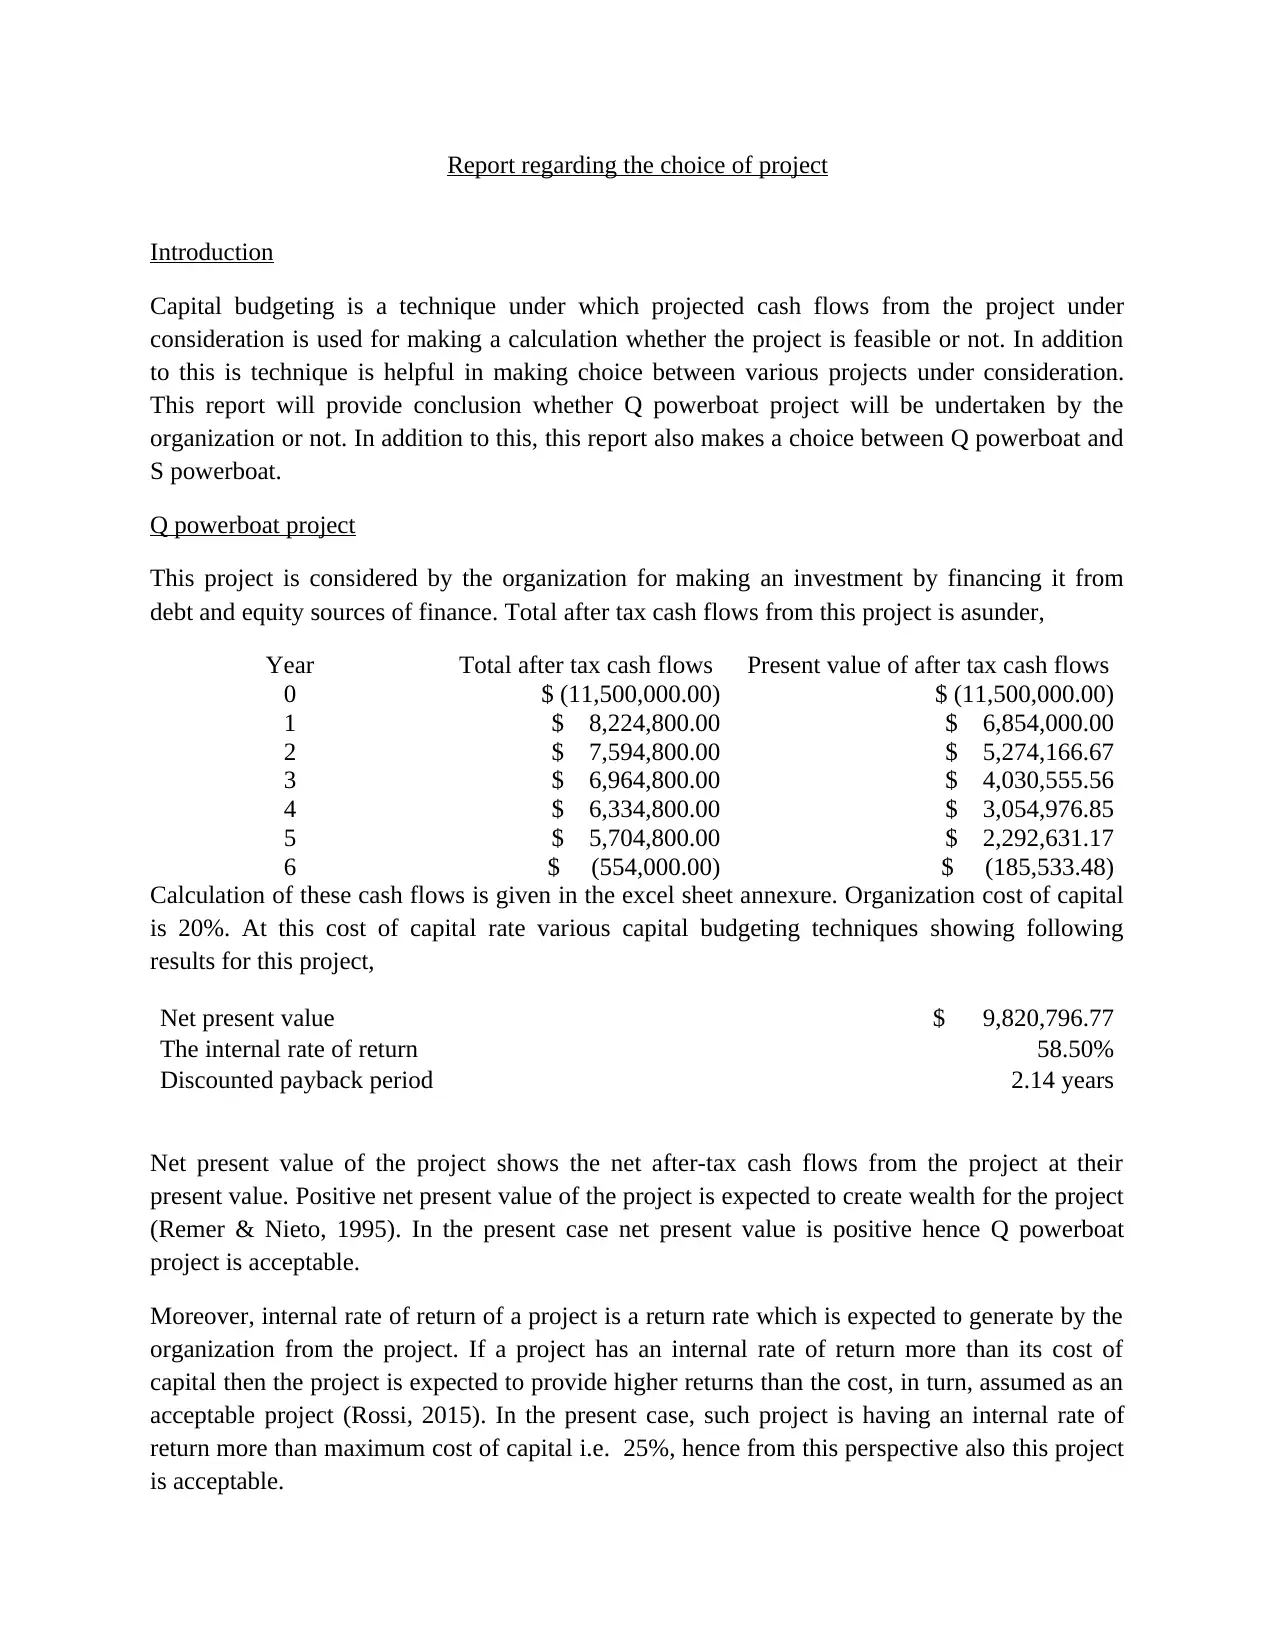
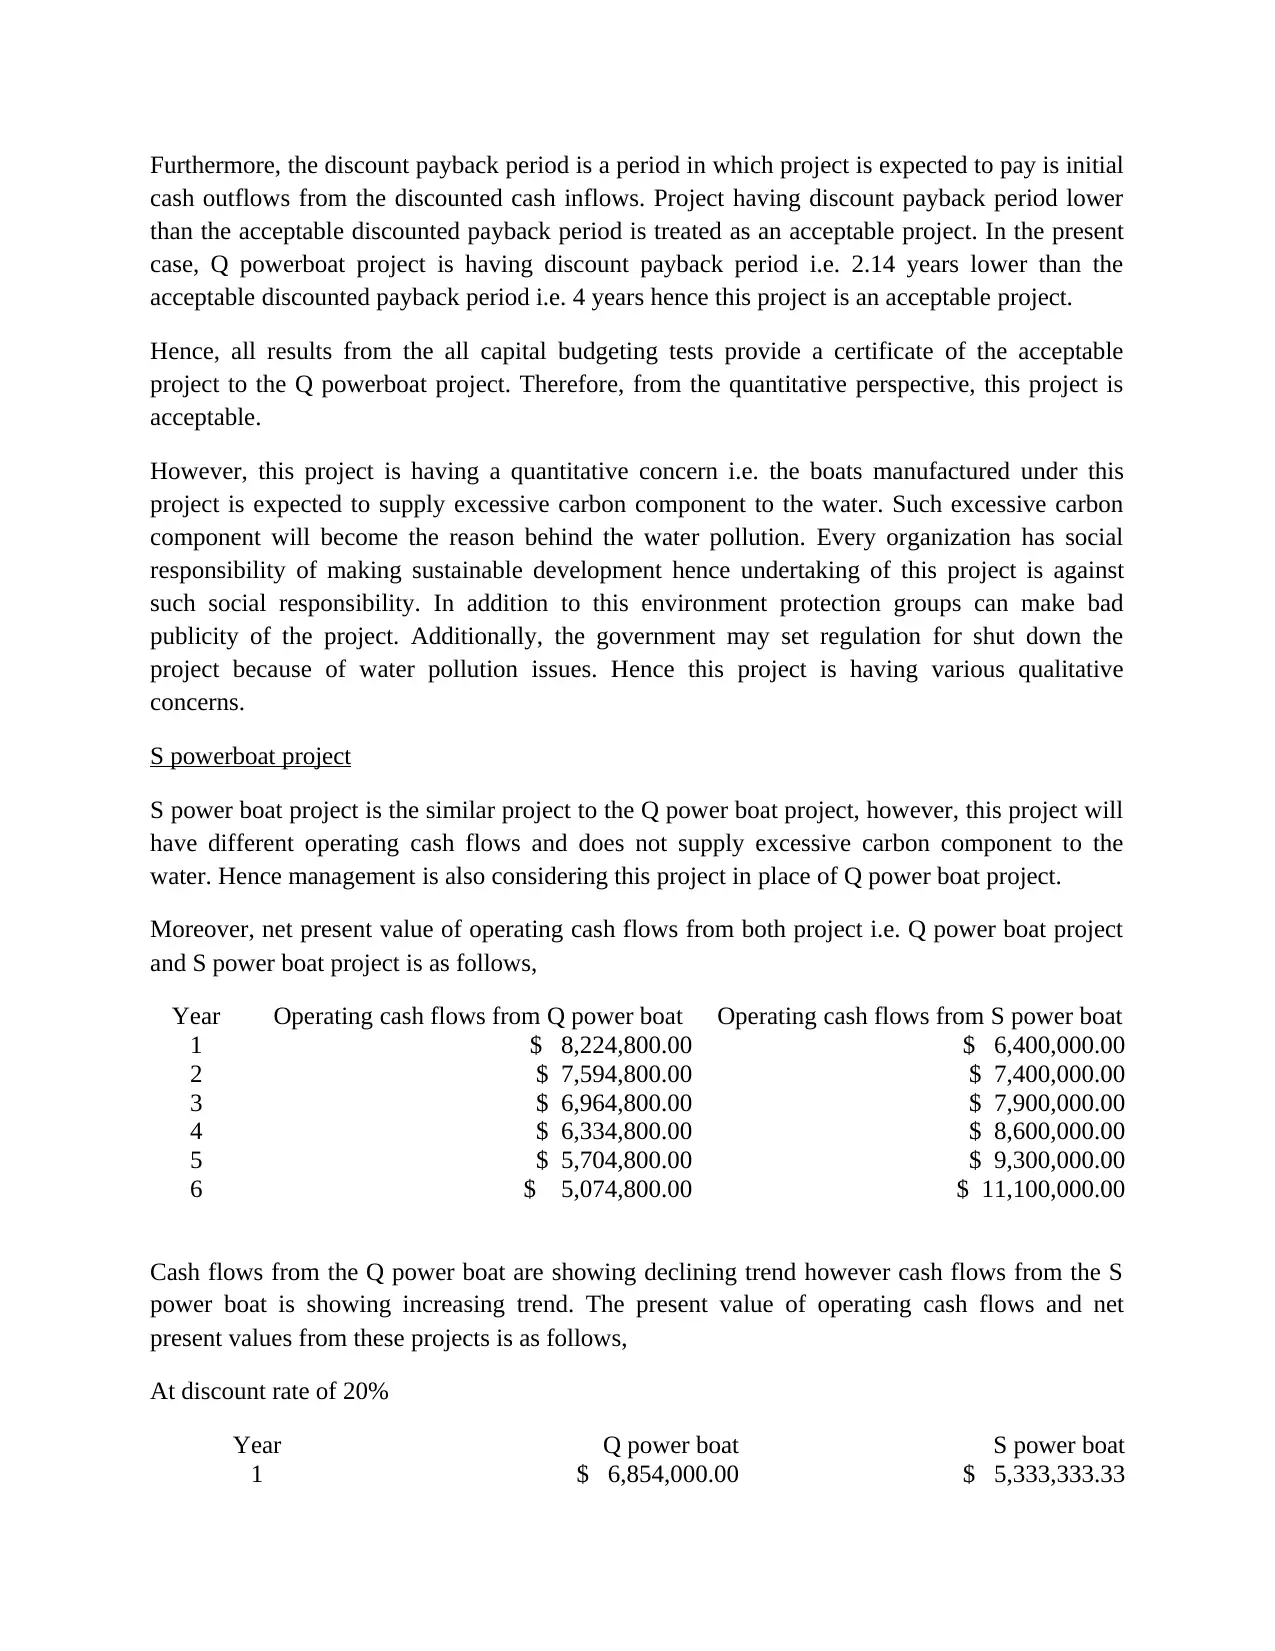
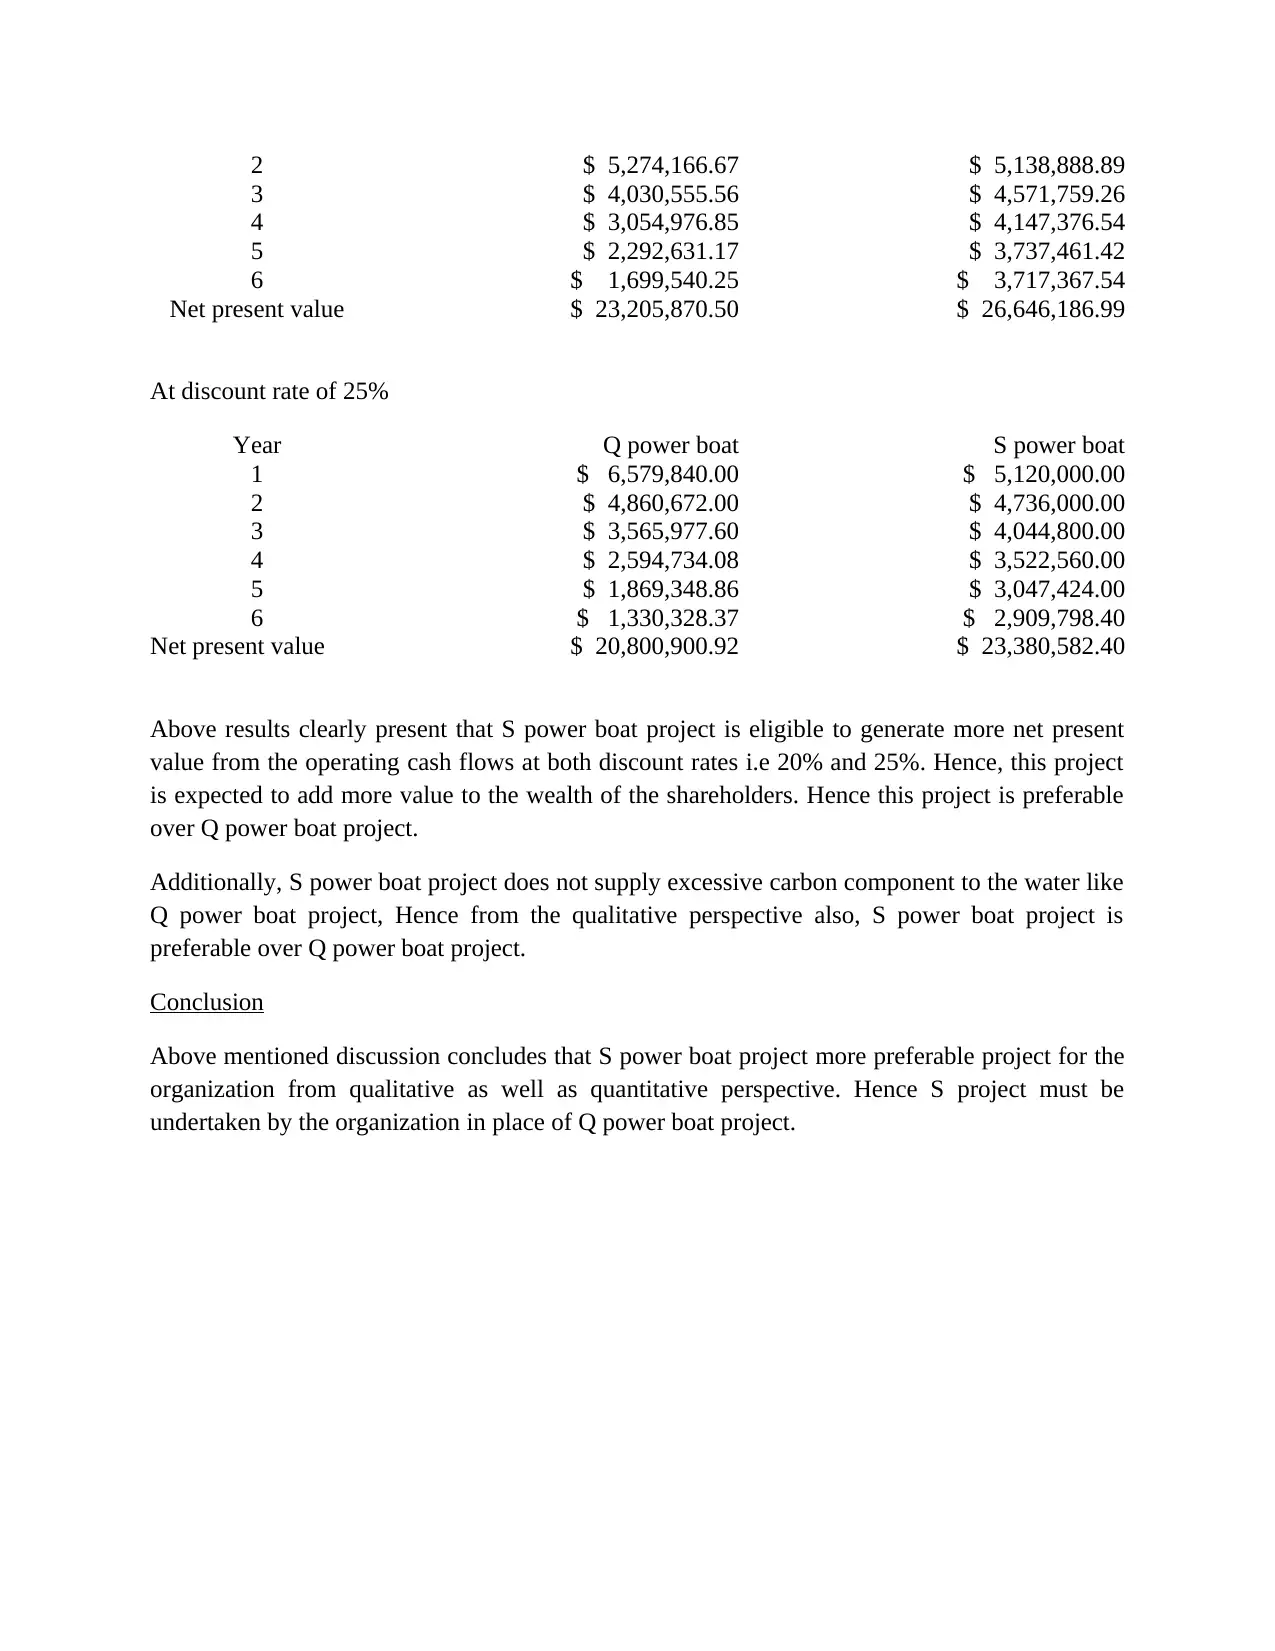
This report provides a capital budgeting analysis comparing two powerboat projects, Q and S, to determine which is a more viable investment. The analysis utilizes various capital budgeting techniques such as Net Present Value (NPV), Internal Rate of Return (IRR), and discounted payback period to assess the financial feasibility of each project. The Q powerboat project initially appears acceptable based on its positive NPV, high IRR, and short discounted payback period. However, the report also considers qualitative factors, particularly the environmental impact of the Q project due to its contribution to water pollution, which leads to concerns regarding social responsibility and potential government regulations. The S powerboat project is then introduced as an alternative, with a comparative analysis showing that it generates a higher NPV at both 20% and 25% discount rates and does not pose the same environmental risks. Consequently, the report concludes that the S powerboat project is the more favorable choice from both quantitative and qualitative standpoints, recommending its implementation over the Q powerboat project.
Document Page
Report regarding the choice of project
Introduction
Capital budgeting is a technique under which projected cash flows from the project under
consideration is used for making a calculation whether the project is feasible or not. In addition
to this is technique is helpful in making choice between various projects under consideration.
This report will provide conclusion whether Q powerboat project will be undertaken by the
organization or not. In addition to this, this report also makes a choice between Q powerboat and
S powerboat.
Q powerboat project
This project is considered by the organization for making an investment by financing it from
debt and equity sources of finance. Total after tax cash flows from this project is asunder,
Year Total after tax cash flows Present value of after tax cash flows
0 $ (11,500,000.00) $ (11,500,000.00)
1 $ 8,224,800.00 $ 6,854,000.00
2 $ 7,594,800.00 $ 5,274,166.67
3 $ 6,964,800.00 $ 4,030,555.56
4 $ 6,334,800.00 $ 3,054,976.85
5 $ 5,704,800.00 $ 2,292,631.17
6 $ (554,000.00) $ (185,533.48)
Calculation of these cash flows is given in the excel sheet annexure. Organization cost of capital
is 20%. At this cost of capital rate various capital budgeting techniques showing following
results for this project,
Net present value $ 9,820,796.77
The internal rate of return 58.50%
Discounted payback period 2.14 years
Net present value of the project shows the net after-tax cash flows from the project at their
present value. Positive net present value of the project is expected to create wealth for the project
(Remer & Nieto, 1995). In the present case net present value is positive hence Q powerboat
project is acceptable.
Moreover, internal rate of return of a project is a return rate which is expected to generate by the
organization from the project. If a project has an internal rate of return more than its cost of
capital then the project is expected to provide higher returns than the cost, in turn, assumed as an
acceptable project (Rossi, 2015). In the present case, such project is having an internal rate of
return more than maximum cost of capital i.e. 25%, hence from this perspective also this project
is acceptable.
tabler-icon-diamond-filled.svg

Secure Best Marks with AI Grader

Need help grading? Try our AI Grader for instant feedback on your assignments.
Document Page
Furthermore, the discount payback period is a period in which project is expected to pay is initial
cash outflows from the discounted cash inflows. Project having discount payback period lower
than the acceptable discounted payback period is treated as an acceptable project. In the present
case, Q powerboat project is having discount payback period i.e. 2.14 years lower than the
acceptable discounted payback period i.e. 4 years hence this project is an acceptable project.
Hence, all results from the all capital budgeting tests provide a certificate of the acceptable
project to the Q powerboat project. Therefore, from the quantitative perspective, this project is
acceptable.
However, this project is having a quantitative concern i.e. the boats manufactured under this
project is expected to supply excessive carbon component to the water. Such excessive carbon
component will become the reason behind the water pollution. Every organization has social
responsibility of making sustainable development hence undertaking of this project is against
such social responsibility. In addition to this environment protection groups can make bad
publicity of the project. Additionally, the government may set regulation for shut down the
project because of water pollution issues. Hence this project is having various qualitative
concerns.
S powerboat project
S power boat project is the similar project to the Q power boat project, however, this project will
have different operating cash flows and does not supply excessive carbon component to the
water. Hence management is also considering this project in place of Q power boat project.
Moreover, net present value of operating cash flows from both project i.e. Q power boat project
and S power boat project is as follows,
Year Operating cash flows from Q power boat Operating cash flows from S power boat
1 $ 8,224,800.00 $ 6,400,000.00
2 $ 7,594,800.00 $ 7,400,000.00
3 $ 6,964,800.00 $ 7,900,000.00
4 $ 6,334,800.00 $ 8,600,000.00
5 $ 5,704,800.00 $ 9,300,000.00
6 $ 5,074,800.00 $ 11,100,000.00
Cash flows from the Q power boat are showing declining trend however cash flows from the S
power boat is showing increasing trend. The present value of operating cash flows and net
present values from these projects is as follows,
At discount rate of 20%
Year Q power boat S power boat
1 $ 6,854,000.00 $ 5,333,333.33
Document Page
2 $ 5,274,166.67 $ 5,138,888.89
3 $ 4,030,555.56 $ 4,571,759.26
4 $ 3,054,976.85 $ 4,147,376.54
5 $ 2,292,631.17 $ 3,737,461.42
6 $ 1,699,540.25 $ 3,717,367.54
Net present value $ 23,205,870.50 $ 26,646,186.99
At discount rate of 25%
Year Q power boat S power boat
1 $ 6,579,840.00 $ 5,120,000.00
2 $ 4,860,672.00 $ 4,736,000.00
3 $ 3,565,977.60 $ 4,044,800.00
4 $ 2,594,734.08 $ 3,522,560.00
5 $ 1,869,348.86 $ 3,047,424.00
6 $ 1,330,328.37 $ 2,909,798.40
Net present value $ 20,800,900.92 $ 23,380,582.40
Above results clearly present that S power boat project is eligible to generate more net present
value from the operating cash flows at both discount rates i.e 20% and 25%. Hence, this project
is expected to add more value to the wealth of the shareholders. Hence this project is preferable
over Q power boat project.
Additionally, S power boat project does not supply excessive carbon component to the water like
Q power boat project, Hence from the qualitative perspective also, S power boat project is
preferable over Q power boat project.
Conclusion
Above mentioned discussion concludes that S power boat project more preferable project for the
organization from qualitative as well as quantitative perspective. Hence S project must be
undertaken by the organization in place of Q power boat project.
Document Page
Works Cited
Remer, D., & Nieto, A. (1995). A compendium and comparison of 25 project evaluation
techniques. Part 1: Net present value and rate of return methods. International Journal of
Production Economics , 42 (1), 79-96.
Rossi, M. (2015). The use of capital budgeting techniques: an outlook from Italy. International
Journal of Management Practice , 8 (1), 43-56.
chevron_up_icon
1 out of 4
circle_padding
hide_on_mobile
zoom_out_icon
[object Object]