Accounting and Finance Report: Capital Budgeting, Structure and Ratios
VerifiedAdded on 2021/06/17
|17
|2299
|69
Report
AI Summary
This report provides a comprehensive analysis of financial and accounting concepts through two case studies. Part A focuses on Saturn Pet Care, evaluating capital budgeting for two potential manufacturing sites (Wodonga and Bathurst) using Net Present Value, payback period, and profitability index. The analysis concludes that Wodonga is the more profitable option. Part B assesses the capital structure and financial performance of ARB Ltd, including the calculation of Weighted Average Cost of Capital (WACC) and the cost of equity using the Capital Asset Pricing Model (CAPM). The report compares ARB Ltd's capital structure with Modine Ltd, analyzes key financial ratios, and suggests recommendations for improving shareholder wealth and optimizing the capital structure, emphasizing the importance of incorporating debt capital.
Running head: ACCOUNTING AND FINANCE
Accounting and Finance
Name of the Student:
Name of the University:
Author’s Note:
Accounting and Finance
Name of the Student:
Name of the University:
Author’s Note:
Paraphrase This Document
Need a fresh take? Get an instant paraphrase of this document with our AI Paraphraser
1
ACCOUNTING AND FINANCE
Executive Summary
This report is in respect to two different scenarios, which are associated with two different
circumstances. The scenario that has been taken in the first instance is with respect to Saturn Pet
care, which is a company that is associated with manufacturing products that are being used by
the pets. The firm is looking to enhance their business line by incorporating new product lines
within the economy and it is seen that the organization has two alternatives from two
manufacturing locations, and they are Wodonga and Bathurst. This report would be therefore be
related to having an understanding of the capital budgeting processes for the intention of gaining
an understanding of the production site that would be suitable for the company. The case study
that has been explained in the second situation is related with ARB Ltd, which engages their
business with the manufacture of accessories related to road motors. This section would associate
with the assessment of the capital framework of ARB Ltd and even addresses the efficiency level
of the company.
2
ACCOUNTING AND FINANCE
Table of Contents
Part A...............................................................................................................................................3
Capital Budgeting (Wodonga and Bathurst Site..........................................................................3
Product Cannibalization...............................................................................................................5
Amending the excessive sales that has been recorded.................................................................5
Inclusion of original cost of the old factory shed........................................................................6
Part B...............................................................................................................................................7
Introduction..................................................................................................................................7
Cost of Capital and Capital Structure..........................................................................................7
Weighted Average Cost of Capital..............................................................................................7
Cost of Capital under CAPM.......................................................................................................8
Comparison between Modine Ltd and ARB Ltd.........................................................................9
Financial Ratios of ARB Ltd.....................................................................................................10
Alterations in the Capital Structure...........................................................................................12
Wealth Maximisation.................................................................................................................12
Recommendations and Conclusion............................................................................................13
Reference List................................................................................................................................14
⊘ This is a preview!⊘
Do you want full access?
Subscribe today to unlock all pages.
Trusted by 1+ million students worldwide
3
ACCOUNTING AND FINANCE
Part A
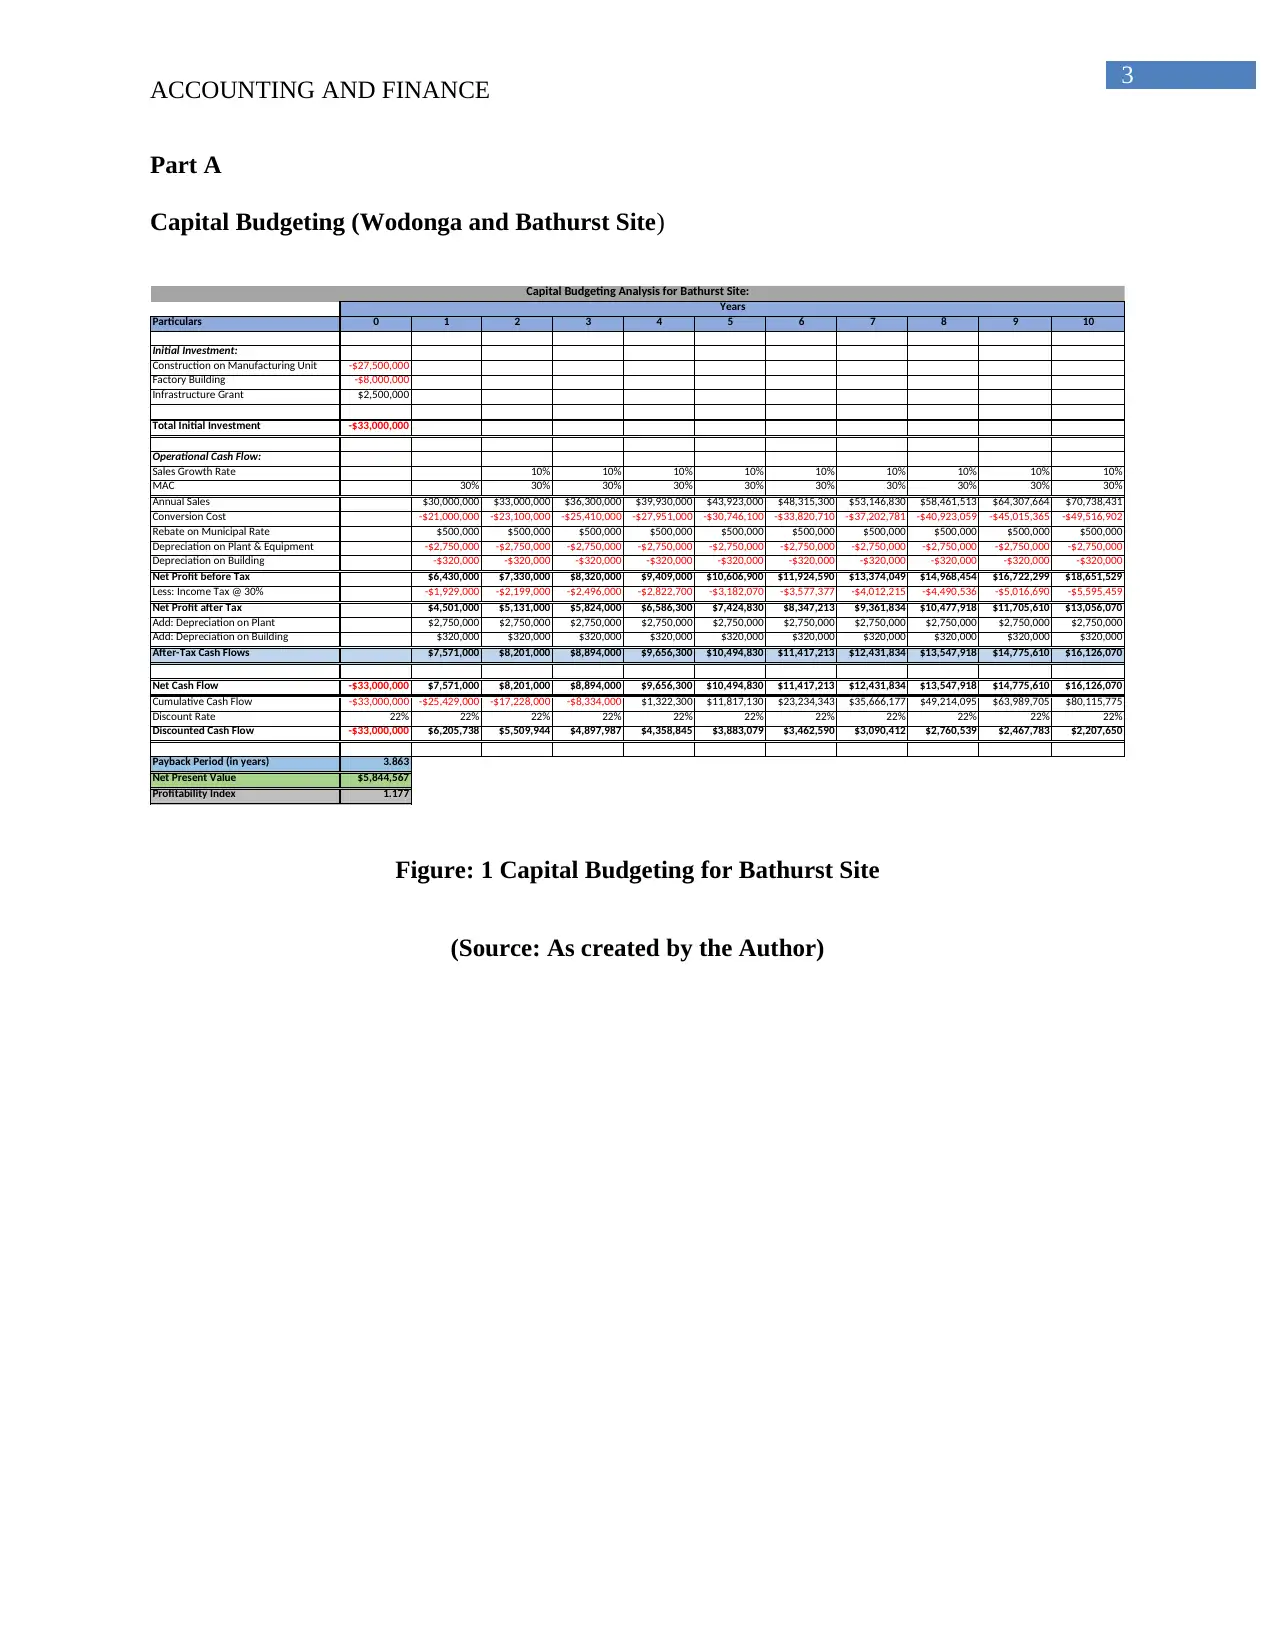
Capital Budgeting (Wodonga and Bathurst Site)
Particulars 0 1 2 3 4 5 6 7 8 9 10
Initial Investment:
Construction on Manufacturing Unit -$27,500,000
Factory Building -$8,000,000
Infrastructure Grant $2,500,000
Total Initial Investment -$33,000,000
Operational Cash Flow:
Sales Growth Rate 10% 10% 10% 10% 10% 10% 10% 10% 10%
MAC 30% 30% 30% 30% 30% 30% 30% 30% 30% 30%
Annual Sales $30,000,000 $33,000,000 $36,300,000 $39,930,000 $43,923,000 $48,315,300 $53,146,830 $58,461,513 $64,307,664 $70,738,431
Conversion Cost -$21,000,000 -$23,100,000 -$25,410,000 -$27,951,000 -$30,746,100 -$33,820,710 -$37,202,781 -$40,923,059 -$45,015,365 -$49,516,902
Rebate on Municipal Rate $500,000 $500,000 $500,000 $500,000 $500,000 $500,000 $500,000 $500,000 $500,000 $500,000
Depreciation on Plant & Equipment -$2,750,000 -$2,750,000 -$2,750,000 -$2,750,000 -$2,750,000 -$2,750,000 -$2,750,000 -$2,750,000 -$2,750,000 -$2,750,000
Depreciation on Building -$320,000 -$320,000 -$320,000 -$320,000 -$320,000 -$320,000 -$320,000 -$320,000 -$320,000 -$320,000
Net Profit before Tax $6,430,000 $7,330,000 $8,320,000 $9,409,000 $10,606,900 $11,924,590 $13,374,049 $14,968,454 $16,722,299 $18,651,529
Less: Income Tax @ 30% -$1,929,000 -$2,199,000 -$2,496,000 -$2,822,700 -$3,182,070 -$3,577,377 -$4,012,215 -$4,490,536 -$5,016,690 -$5,595,459
Net Profit after Tax $4,501,000 $5,131,000 $5,824,000 $6,586,300 $7,424,830 $8,347,213 $9,361,834 $10,477,918 $11,705,610 $13,056,070
Add: Depreciation on Plant $2,750,000 $2,750,000 $2,750,000 $2,750,000 $2,750,000 $2,750,000 $2,750,000 $2,750,000 $2,750,000 $2,750,000
Add: Depreciation on Building $320,000 $320,000 $320,000 $320,000 $320,000 $320,000 $320,000 $320,000 $320,000 $320,000
After-Tax Cash Flows $7,571,000 $8,201,000 $8,894,000 $9,656,300 $10,494,830 $11,417,213 $12,431,834 $13,547,918 $14,775,610 $16,126,070
Net Cash Flow -$33,000,000 $7,571,000 $8,201,000 $8,894,000 $9,656,300 $10,494,830 $11,417,213 $12,431,834 $13,547,918 $14,775,610 $16,126,070
Cumulative Cash Flow -$33,000,000 -$25,429,000 -$17,228,000 -$8,334,000 $1,322,300 $11,817,130 $23,234,343 $35,666,177 $49,214,095 $63,989,705 $80,115,775
Discount Rate 22% 22% 22% 22% 22% 22% 22% 22% 22% 22% 22%
Discounted Cash Flow -$33,000,000 $6,205,738 $5,509,944 $4,897,987 $4,358,845 $3,883,079 $3,462,590 $3,090,412 $2,760,539 $2,467,783 $2,207,650
Payback Period (in years) 3.863
Net Present Value $5,844,567
Profitability Index 1.177
Years
Capital Budgeting Analysis for Bathurst Site:
Figure: 1 Capital Budgeting for Bathurst Site
(Source: As created by the Author)
ACCOUNTING AND FINANCE
Part A
Capital Budgeting (Wodonga and Bathurst Site)
Particulars 0 1 2 3 4 5 6 7 8 9 10
Initial Investment:
Construction on Manufacturing Unit -$27,500,000
Factory Building -$8,000,000
Infrastructure Grant $2,500,000
Total Initial Investment -$33,000,000
Operational Cash Flow:
Sales Growth Rate 10% 10% 10% 10% 10% 10% 10% 10% 10%
MAC 30% 30% 30% 30% 30% 30% 30% 30% 30% 30%
Annual Sales $30,000,000 $33,000,000 $36,300,000 $39,930,000 $43,923,000 $48,315,300 $53,146,830 $58,461,513 $64,307,664 $70,738,431
Conversion Cost -$21,000,000 -$23,100,000 -$25,410,000 -$27,951,000 -$30,746,100 -$33,820,710 -$37,202,781 -$40,923,059 -$45,015,365 -$49,516,902
Rebate on Municipal Rate $500,000 $500,000 $500,000 $500,000 $500,000 $500,000 $500,000 $500,000 $500,000 $500,000
Depreciation on Plant & Equipment -$2,750,000 -$2,750,000 -$2,750,000 -$2,750,000 -$2,750,000 -$2,750,000 -$2,750,000 -$2,750,000 -$2,750,000 -$2,750,000
Depreciation on Building -$320,000 -$320,000 -$320,000 -$320,000 -$320,000 -$320,000 -$320,000 -$320,000 -$320,000 -$320,000
Net Profit before Tax $6,430,000 $7,330,000 $8,320,000 $9,409,000 $10,606,900 $11,924,590 $13,374,049 $14,968,454 $16,722,299 $18,651,529
Less: Income Tax @ 30% -$1,929,000 -$2,199,000 -$2,496,000 -$2,822,700 -$3,182,070 -$3,577,377 -$4,012,215 -$4,490,536 -$5,016,690 -$5,595,459
Net Profit after Tax $4,501,000 $5,131,000 $5,824,000 $6,586,300 $7,424,830 $8,347,213 $9,361,834 $10,477,918 $11,705,610 $13,056,070
Add: Depreciation on Plant $2,750,000 $2,750,000 $2,750,000 $2,750,000 $2,750,000 $2,750,000 $2,750,000 $2,750,000 $2,750,000 $2,750,000
Add: Depreciation on Building $320,000 $320,000 $320,000 $320,000 $320,000 $320,000 $320,000 $320,000 $320,000 $320,000
After-Tax Cash Flows $7,571,000 $8,201,000 $8,894,000 $9,656,300 $10,494,830 $11,417,213 $12,431,834 $13,547,918 $14,775,610 $16,126,070
Net Cash Flow -$33,000,000 $7,571,000 $8,201,000 $8,894,000 $9,656,300 $10,494,830 $11,417,213 $12,431,834 $13,547,918 $14,775,610 $16,126,070
Cumulative Cash Flow -$33,000,000 -$25,429,000 -$17,228,000 -$8,334,000 $1,322,300 $11,817,130 $23,234,343 $35,666,177 $49,214,095 $63,989,705 $80,115,775
Discount Rate 22% 22% 22% 22% 22% 22% 22% 22% 22% 22% 22%
Discounted Cash Flow -$33,000,000 $6,205,738 $5,509,944 $4,897,987 $4,358,845 $3,883,079 $3,462,590 $3,090,412 $2,760,539 $2,467,783 $2,207,650
Payback Period (in years) 3.863
Net Present Value $5,844,567
Profitability Index 1.177
Years
Capital Budgeting Analysis for Bathurst Site:
Figure: 1 Capital Budgeting for Bathurst Site
(Source: As created by the Author)
Paraphrase This Document
Need a fresh take? Get an instant paraphrase of this document with our AI Paraphraser
4
ACCOUNTING AND FINANCE
Particulars 0 1 2 3 4 5 6 7 8 9 10
Initial Investment:
Construction on Manufacturing Unit -$27,500,000
Value of Wodonga Site
Total Initial Investment -$27,500,000
Operational Cash Flow:
Sales Growth Rate 10% 10% 10% 10% 10% 10% 10% 10% 10%
MAC 30% 30% 30% 30% 30% 30% 30% 30% 30% 30%
Annual Sales $30,000,000 $33,000,000 $36,300,000 $39,930,000 $43,923,000 $48,315,300 $53,146,830 $58,461,513 $64,307,664 $70,738,431
Conversion Cost -$21,000,000 -$23,100,000 -$25,410,000 -$27,951,000 -$30,746,100 -$33,820,710 -$37,202,781 -$40,923,059 -$45,015,365 -$49,516,902
Depreciation on Plant & Equipment -$2,750,000 -$2,750,000 -$2,750,000 -$2,750,000 -$2,750,000 -$2,750,000 -$2,750,000 -$2,750,000 -$2,750,000 -$2,750,000
Depreciation on Building $0 $0 $0 $0 $0 $0 $0 $0 $0 $0
Net Profit before Tax $6,250,000 $7,150,000 $8,140,000 $9,229,000 $10,426,900 $11,744,590 $13,194,049 $14,788,454 $16,542,299 $18,471,529
Less: Income Tax @ 30% -$1,875,000 -$2,145,000 -$2,442,000 -$2,768,700 -$3,128,070 -$3,523,377 -$3,958,215 -$4,436,536 -$4,962,690 -$5,541,459
Net Profit after Tax $4,375,000 $5,005,000 $5,698,000 $6,460,300 $7,298,830 $8,221,213 $9,235,834 $10,351,918 $11,579,610 $12,930,070
Add: Depreciation on Plant $2,750,000 $2,750,000 $2,750,000 $2,750,000 $2,750,000 $2,750,000 $2,750,000 $2,750,000 $2,750,000 $2,750,000
Add: Depreciation on Building $0 $0 $0 $0 $0 $0 $0 $0 $0 $0
After-Tax Cash Flows $7,125,000 $7,755,000 $8,448,000 $9,210,300 $10,048,830 $10,971,213 $11,985,834 $13,101,918 $14,329,610 $15,680,070
Net Cash Flow -$27,500,000 $7,125,000 $7,755,000 $8,448,000 $9,210,300 $10,048,830 $10,971,213 $11,985,834 $13,101,918 $14,329,610 $15,680,070
Cumulative Cash Flow -$27,500,000 -$20,375,000 -$12,620,000 -$4,172,000 $5,038,300 $15,087,130 $26,058,343 $38,044,177 $51,146,095 $65,475,705 $81,155,775
Discount Rate 22% 22% 22% 22% 22% 22% 22% 22% 22% 22% 22%
Discounted Cash Flow -$27,500,000 $5,840,164 $5,210,293 $4,652,372 $4,157,521 $3,718,060 $3,327,328 $2,979,542 $2,669,662 $2,393,293 $2,146,593
Payback Period (in years) 3.453
Net Present Value $9,594,827
Profitability Index 1.349
Capital Budgeting Analysis for Wodonga Site:
Years
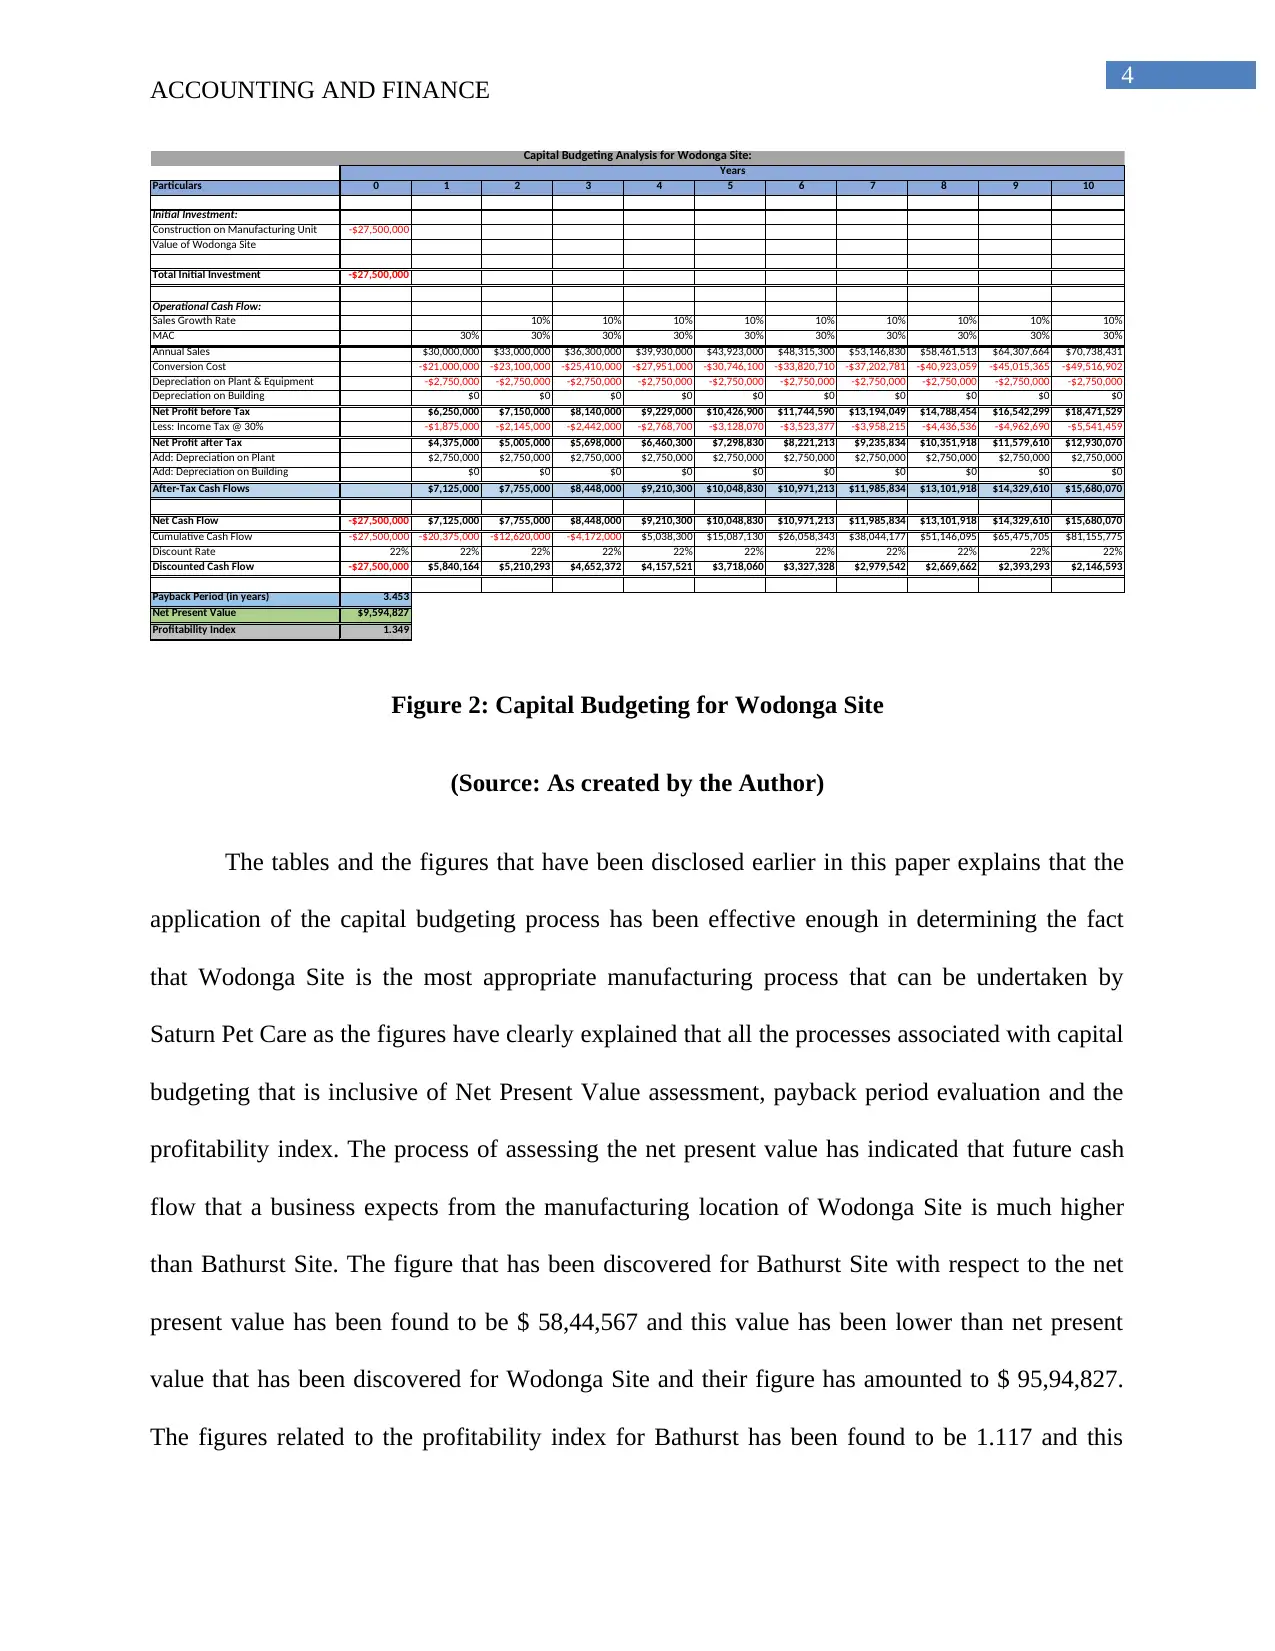
Figure 2: Capital Budgeting for Wodonga Site
(Source: As created by the Author)
The tables and the figures that have been disclosed earlier in this paper explains that the
application of the capital budgeting process has been effective enough in determining the fact
that Wodonga Site is the most appropriate manufacturing process that can be undertaken by
Saturn Pet Care as the figures have clearly explained that all the processes associated with capital
budgeting that is inclusive of Net Present Value assessment, payback period evaluation and the
profitability index. The process of assessing the net present value has indicated that future cash
flow that a business expects from the manufacturing location of Wodonga Site is much higher
than Bathurst Site. The figure that has been discovered for Bathurst Site with respect to the net
present value has been found to be $ 58,44,567 and this value has been lower than net present
value that has been discovered for Wodonga Site and their figure has amounted to $ 95,94,827.
The figures related to the profitability index for Bathurst has been found to be 1.117 and this
ACCOUNTING AND FINANCE
Particulars 0 1 2 3 4 5 6 7 8 9 10
Initial Investment:
Construction on Manufacturing Unit -$27,500,000
Value of Wodonga Site
Total Initial Investment -$27,500,000
Operational Cash Flow:
Sales Growth Rate 10% 10% 10% 10% 10% 10% 10% 10% 10%
MAC 30% 30% 30% 30% 30% 30% 30% 30% 30% 30%
Annual Sales $30,000,000 $33,000,000 $36,300,000 $39,930,000 $43,923,000 $48,315,300 $53,146,830 $58,461,513 $64,307,664 $70,738,431
Conversion Cost -$21,000,000 -$23,100,000 -$25,410,000 -$27,951,000 -$30,746,100 -$33,820,710 -$37,202,781 -$40,923,059 -$45,015,365 -$49,516,902
Depreciation on Plant & Equipment -$2,750,000 -$2,750,000 -$2,750,000 -$2,750,000 -$2,750,000 -$2,750,000 -$2,750,000 -$2,750,000 -$2,750,000 -$2,750,000
Depreciation on Building $0 $0 $0 $0 $0 $0 $0 $0 $0 $0
Net Profit before Tax $6,250,000 $7,150,000 $8,140,000 $9,229,000 $10,426,900 $11,744,590 $13,194,049 $14,788,454 $16,542,299 $18,471,529
Less: Income Tax @ 30% -$1,875,000 -$2,145,000 -$2,442,000 -$2,768,700 -$3,128,070 -$3,523,377 -$3,958,215 -$4,436,536 -$4,962,690 -$5,541,459
Net Profit after Tax $4,375,000 $5,005,000 $5,698,000 $6,460,300 $7,298,830 $8,221,213 $9,235,834 $10,351,918 $11,579,610 $12,930,070
Add: Depreciation on Plant $2,750,000 $2,750,000 $2,750,000 $2,750,000 $2,750,000 $2,750,000 $2,750,000 $2,750,000 $2,750,000 $2,750,000
Add: Depreciation on Building $0 $0 $0 $0 $0 $0 $0 $0 $0 $0
After-Tax Cash Flows $7,125,000 $7,755,000 $8,448,000 $9,210,300 $10,048,830 $10,971,213 $11,985,834 $13,101,918 $14,329,610 $15,680,070
Net Cash Flow -$27,500,000 $7,125,000 $7,755,000 $8,448,000 $9,210,300 $10,048,830 $10,971,213 $11,985,834 $13,101,918 $14,329,610 $15,680,070
Cumulative Cash Flow -$27,500,000 -$20,375,000 -$12,620,000 -$4,172,000 $5,038,300 $15,087,130 $26,058,343 $38,044,177 $51,146,095 $65,475,705 $81,155,775
Discount Rate 22% 22% 22% 22% 22% 22% 22% 22% 22% 22% 22%
Discounted Cash Flow -$27,500,000 $5,840,164 $5,210,293 $4,652,372 $4,157,521 $3,718,060 $3,327,328 $2,979,542 $2,669,662 $2,393,293 $2,146,593
Payback Period (in years) 3.453
Net Present Value $9,594,827
Profitability Index 1.349
Capital Budgeting Analysis for Wodonga Site:
Years
Figure 2: Capital Budgeting for Wodonga Site
(Source: As created by the Author)
The tables and the figures that have been disclosed earlier in this paper explains that the
application of the capital budgeting process has been effective enough in determining the fact
that Wodonga Site is the most appropriate manufacturing process that can be undertaken by
Saturn Pet Care as the figures have clearly explained that all the processes associated with capital
budgeting that is inclusive of Net Present Value assessment, payback period evaluation and the
profitability index. The process of assessing the net present value has indicated that future cash
flow that a business expects from the manufacturing location of Wodonga Site is much higher
than Bathurst Site. The figure that has been discovered for Bathurst Site with respect to the net
present value has been found to be $ 58,44,567 and this value has been lower than net present
value that has been discovered for Wodonga Site and their figure has amounted to $ 95,94,827.
The figures related to the profitability index for Bathurst has been found to be 1.117 and this
5
ACCOUNTING AND FINANCE
figure has been lower than the index of Wodonga in relation to their profitability and the value
amounts to 1.349. The assessment of the payback period has indicated that site for Wodonga is
much more effective with respect to the site in Bathurst as it permits the organization to regain
the primary value that has been invested for the purpose of manufacturing at a very limited time
period. Therefore, by looking at the assessment that has been taken into consideration it is seen
that manufacturing process that has undertaken by Wodonga site is much more profitable.
Product Cannibalization
The word “product cannibalization” is associated to a plan or a strategy, which is
generally undertaken by an organization and in which in order to incorporate and advertise a
fresh product in the market, it is seen that the organzaiiton looks to lower their sales of their
other products (Loughran, & McDonald 2016). In accordance to Saturn Pet Care, there are
possibilities that this company is making use of such a process in order to improve their new
product line, which is in the mind-set of the management.
Amending the excessive sales that has been recorded
According to the question, it is seen that one of the directors of the company who is
named as Nathan, has an idea that the department of marketing has expected the sales to be more
and hence this error needs to be amended in order to mitigate the effect that it would have on the
method of planning that is undertaken by the management (Beaumont, 2015). The error of
estimation can be amended by making use of the process of net present value analysis with the
help of which the estimates of the cash flow can be enhanced a bit in order to counteract the error
of estimation that have taken place at a certain point of time earlier.
⊘ This is a preview!⊘
Do you want full access?
Subscribe today to unlock all pages.
Trusted by 1+ million students worldwide
6
ACCOUNTING AND FINANCE
Inclusion of original cost of the old factory shed
The director named Nathan even has the idea that the actual expense of the factory
location needs to be added within the investment that has been made initially in order to bring in
a precise estimation (Unda, 2015). The point of view of Nathan is not perfect as the assessment
of the net present value only regards the factory locations that have been newly constructed and
this has been developed for the purpose of the option of the manufacturing locations.
Paraphrase This Document
Need a fresh take? Get an instant paraphrase of this document with our AI Paraphraser
7
ACCOUNTING AND FINANCE
Part B
Introduction
This section of the paper would be looking to assess the capital structure framework for
ARB Ltd and this is an organization that concentrates on the manufacturing sector and
accordingly the weaknesses and the efficiency of the capital framework of the company needs to
be evaluated. The assessment that would be undertaken would provide an explicit assessment of
the capital model and the alterations that would place in the coming years needs to be assessed as
well.
Cost of Capital and Capital Structure
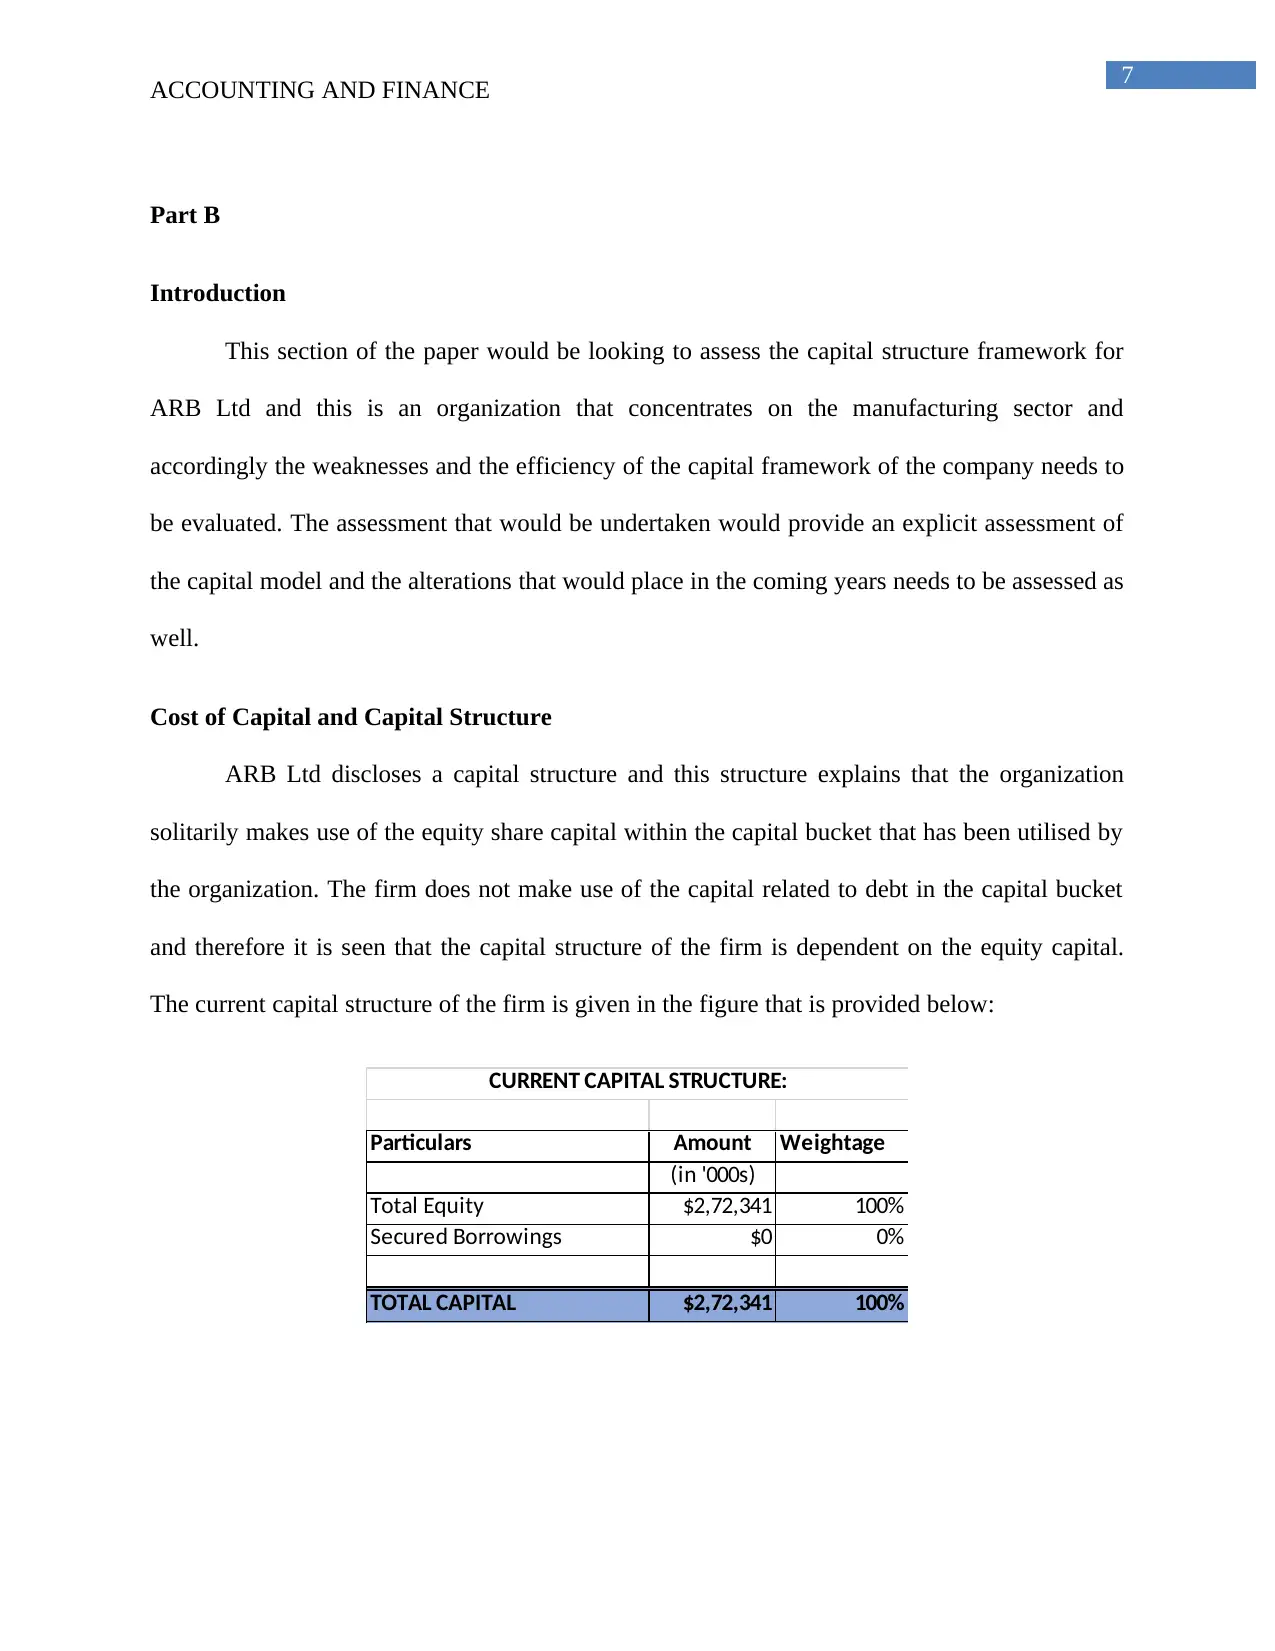
ARB Ltd discloses a capital structure and this structure explains that the organization
solitarily makes use of the equity share capital within the capital bucket that has been utilised by
the organization. The firm does not make use of the capital related to debt in the capital bucket
and therefore it is seen that the capital structure of the firm is dependent on the equity capital.
The current capital structure of the firm is given in the figure that is provided below:
Particulars Amount Weightage
(in '000s)
Total Equity $2,72,341 100%
Secured Borrowings $0 0%
TOTAL CAPITAL $2,72,341 100%
CURRENT CAPITAL STRUCTURE:
ACCOUNTING AND FINANCE
Part B
Introduction
This section of the paper would be looking to assess the capital structure framework for
ARB Ltd and this is an organization that concentrates on the manufacturing sector and
accordingly the weaknesses and the efficiency of the capital framework of the company needs to
be evaluated. The assessment that would be undertaken would provide an explicit assessment of
the capital model and the alterations that would place in the coming years needs to be assessed as
well.
Cost of Capital and Capital Structure
ARB Ltd discloses a capital structure and this structure explains that the organization
solitarily makes use of the equity share capital within the capital bucket that has been utilised by
the organization. The firm does not make use of the capital related to debt in the capital bucket
and therefore it is seen that the capital structure of the firm is dependent on the equity capital.
The current capital structure of the firm is given in the figure that is provided below:
Particulars Amount Weightage
(in '000s)
Total Equity $2,72,341 100%
Secured Borrowings $0 0%
TOTAL CAPITAL $2,72,341 100%
CURRENT CAPITAL STRUCTURE:
8
ACCOUNTING AND FINANCE
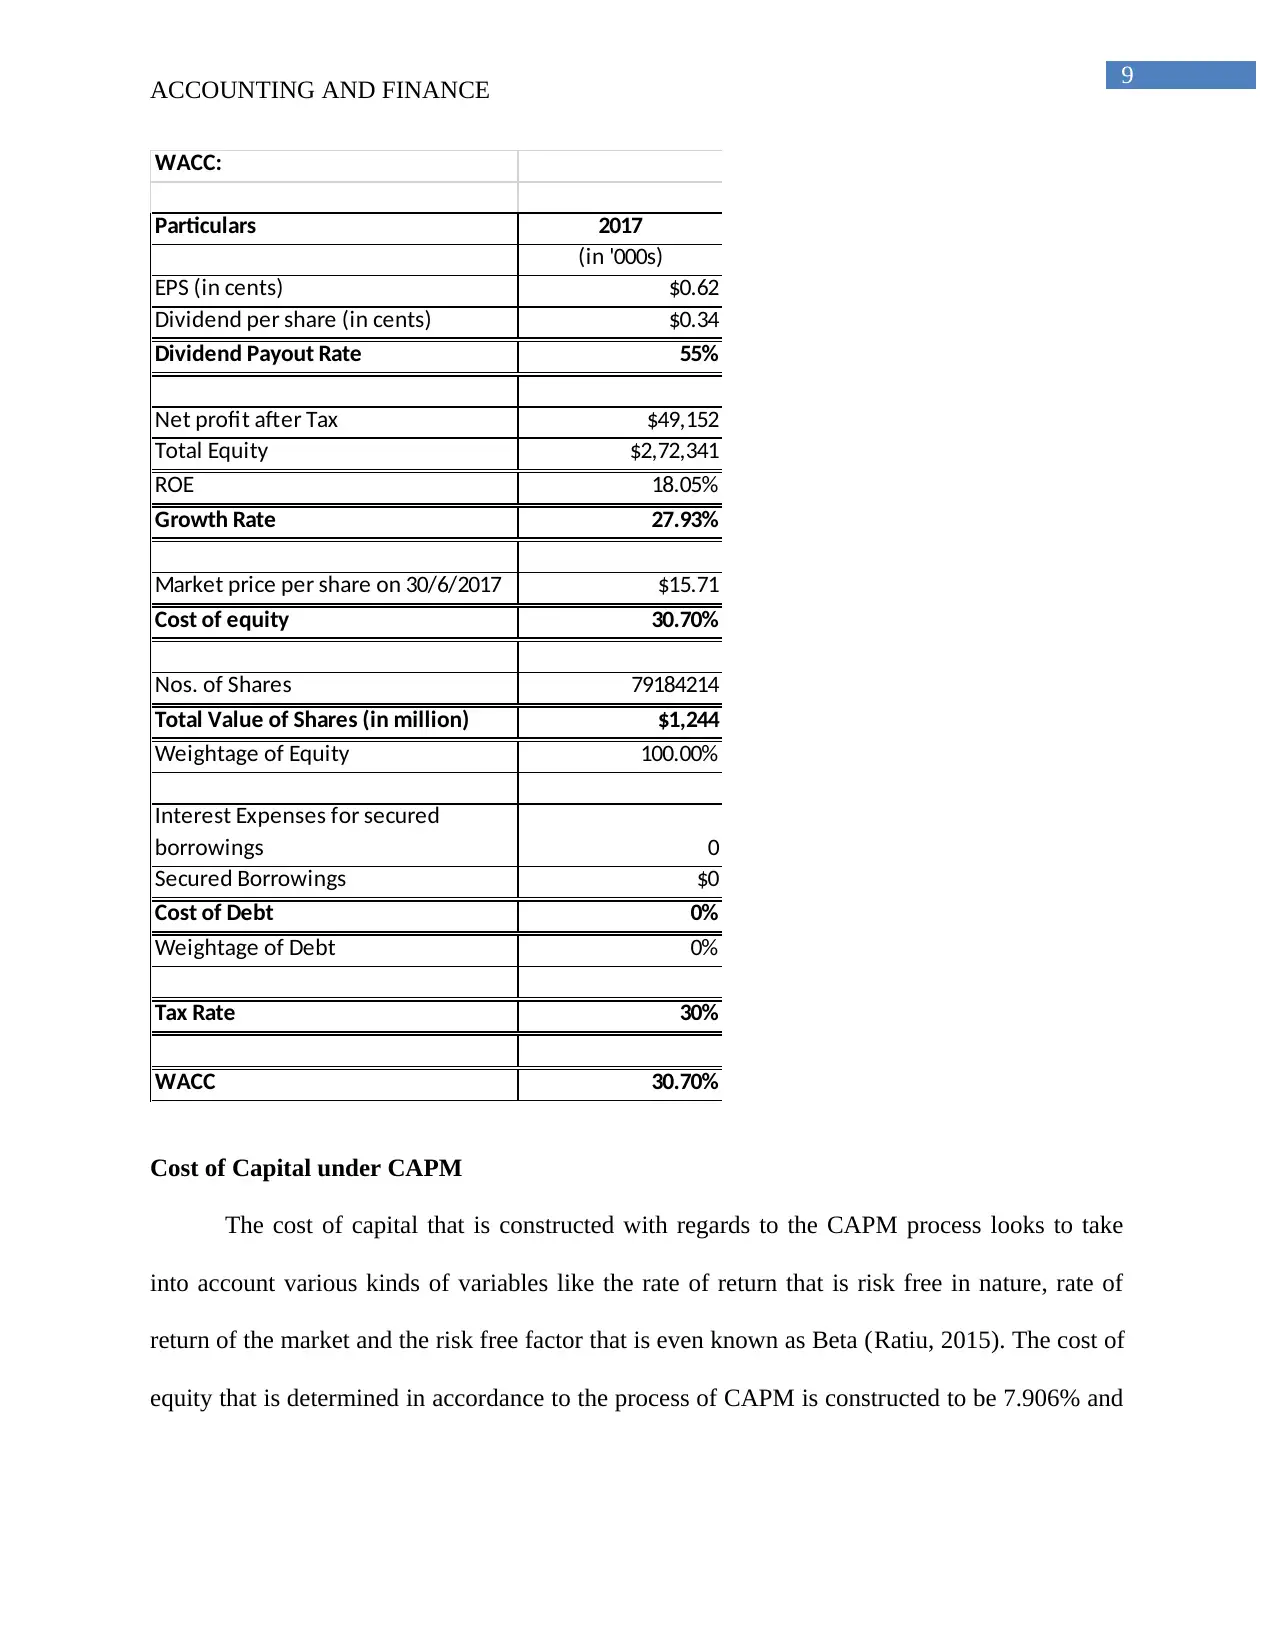
Weighted Average Cost of Capital
Weighted Average Cost of Capital also known as WACC for the concerned organization
has been constructed and thereby discovering the fact that for the concerned company the
WACC figure has been 30.7%. Faff, (2015) addressed that weighted average cost of capital is the
aggregate of the overall expenses related to capital that is attained from several financial sources
that have been utilised by the organizations. The total cost of capital for the concerned business
has diminished from the projections of the last year, which addresses that the financing expenses
has in certain manner diminished and this has been looked upon to be a positive symbol.
ACCOUNTING AND FINANCE
Weighted Average Cost of Capital
Weighted Average Cost of Capital also known as WACC for the concerned organization
has been constructed and thereby discovering the fact that for the concerned company the
WACC figure has been 30.7%. Faff, (2015) addressed that weighted average cost of capital is the
aggregate of the overall expenses related to capital that is attained from several financial sources
that have been utilised by the organizations. The total cost of capital for the concerned business
has diminished from the projections of the last year, which addresses that the financing expenses
has in certain manner diminished and this has been looked upon to be a positive symbol.
⊘ This is a preview!⊘
Do you want full access?
Subscribe today to unlock all pages.
Trusted by 1+ million students worldwide
9
ACCOUNTING AND FINANCE
WACC:
Particulars 2017
(in '000s)
EPS (in cents) $0.62
Dividend per share (in cents) $0.34
Dividend Payout Rate 55%
Net profit after Tax $49,152
Total Equity $2,72,341
ROE 18.05%
Growth Rate 27.93%
Market price per share on 30/6/2017 $15.71
Cost of equity 30.70%
Nos. of Shares 79184214
Total Value of Shares (in million) $1,244
Weightage of Equity 100.00%
Interest Expenses for secured
borrowings 0
Secured Borrowings $0
Cost of Debt 0%
Weightage of Debt 0%
Tax Rate 30%
WACC 30.70%
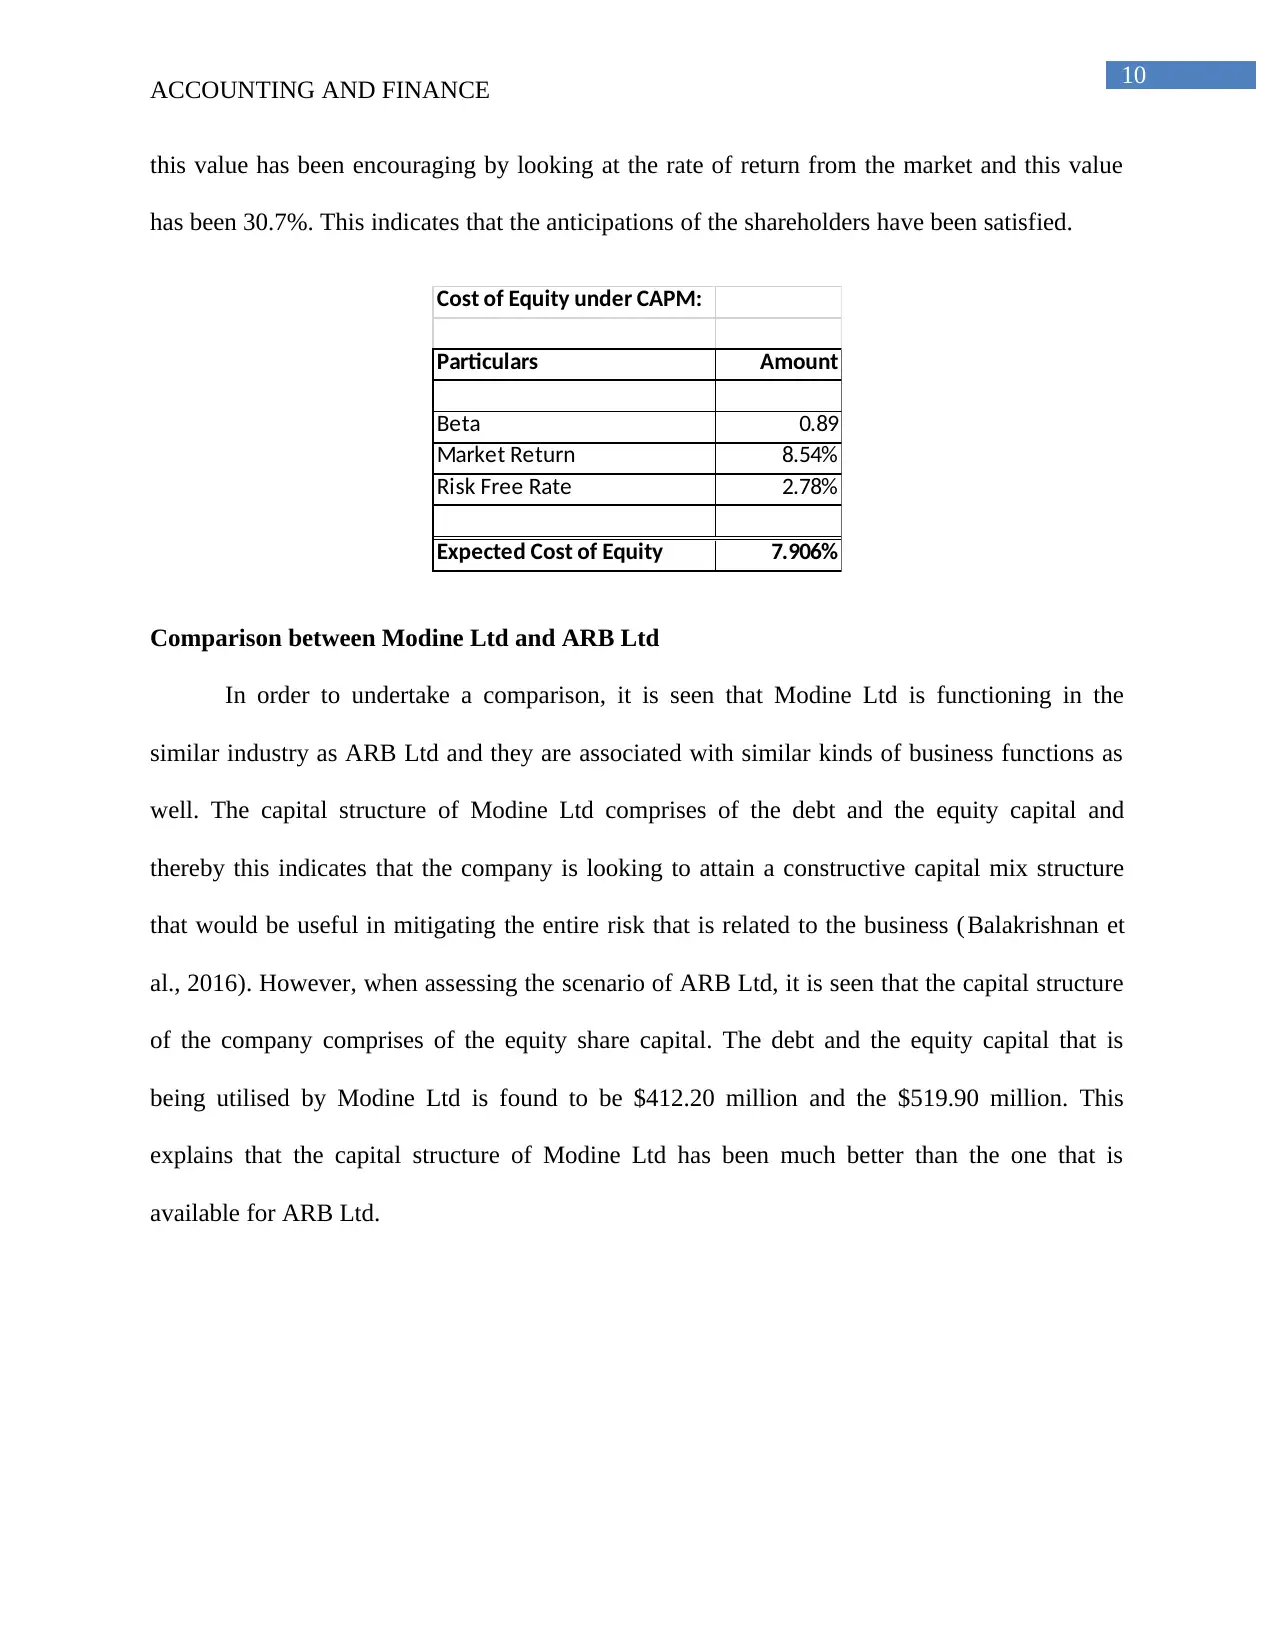
Cost of Capital under CAPM
The cost of capital that is constructed with regards to the CAPM process looks to take
into account various kinds of variables like the rate of return that is risk free in nature, rate of
return of the market and the risk free factor that is even known as Beta (Ratiu, 2015). The cost of
equity that is determined in accordance to the process of CAPM is constructed to be 7.906% and
ACCOUNTING AND FINANCE
WACC:
Particulars 2017
(in '000s)
EPS (in cents) $0.62
Dividend per share (in cents) $0.34
Dividend Payout Rate 55%
Net profit after Tax $49,152
Total Equity $2,72,341
ROE 18.05%
Growth Rate 27.93%
Market price per share on 30/6/2017 $15.71
Cost of equity 30.70%
Nos. of Shares 79184214
Total Value of Shares (in million) $1,244
Weightage of Equity 100.00%
Interest Expenses for secured
borrowings 0
Secured Borrowings $0
Cost of Debt 0%
Weightage of Debt 0%
Tax Rate 30%
WACC 30.70%
Cost of Capital under CAPM
The cost of capital that is constructed with regards to the CAPM process looks to take
into account various kinds of variables like the rate of return that is risk free in nature, rate of
return of the market and the risk free factor that is even known as Beta (Ratiu, 2015). The cost of
equity that is determined in accordance to the process of CAPM is constructed to be 7.906% and
Paraphrase This Document
Need a fresh take? Get an instant paraphrase of this document with our AI Paraphraser
10
ACCOUNTING AND FINANCE
this value has been encouraging by looking at the rate of return from the market and this value
has been 30.7%. This indicates that the anticipations of the shareholders have been satisfied.
Cost of Equity under CAPM:
Particulars Amount
Beta 0.89
Market Return 8.54%
Risk Free Rate 2.78%
Expected Cost of Equity 7.906%
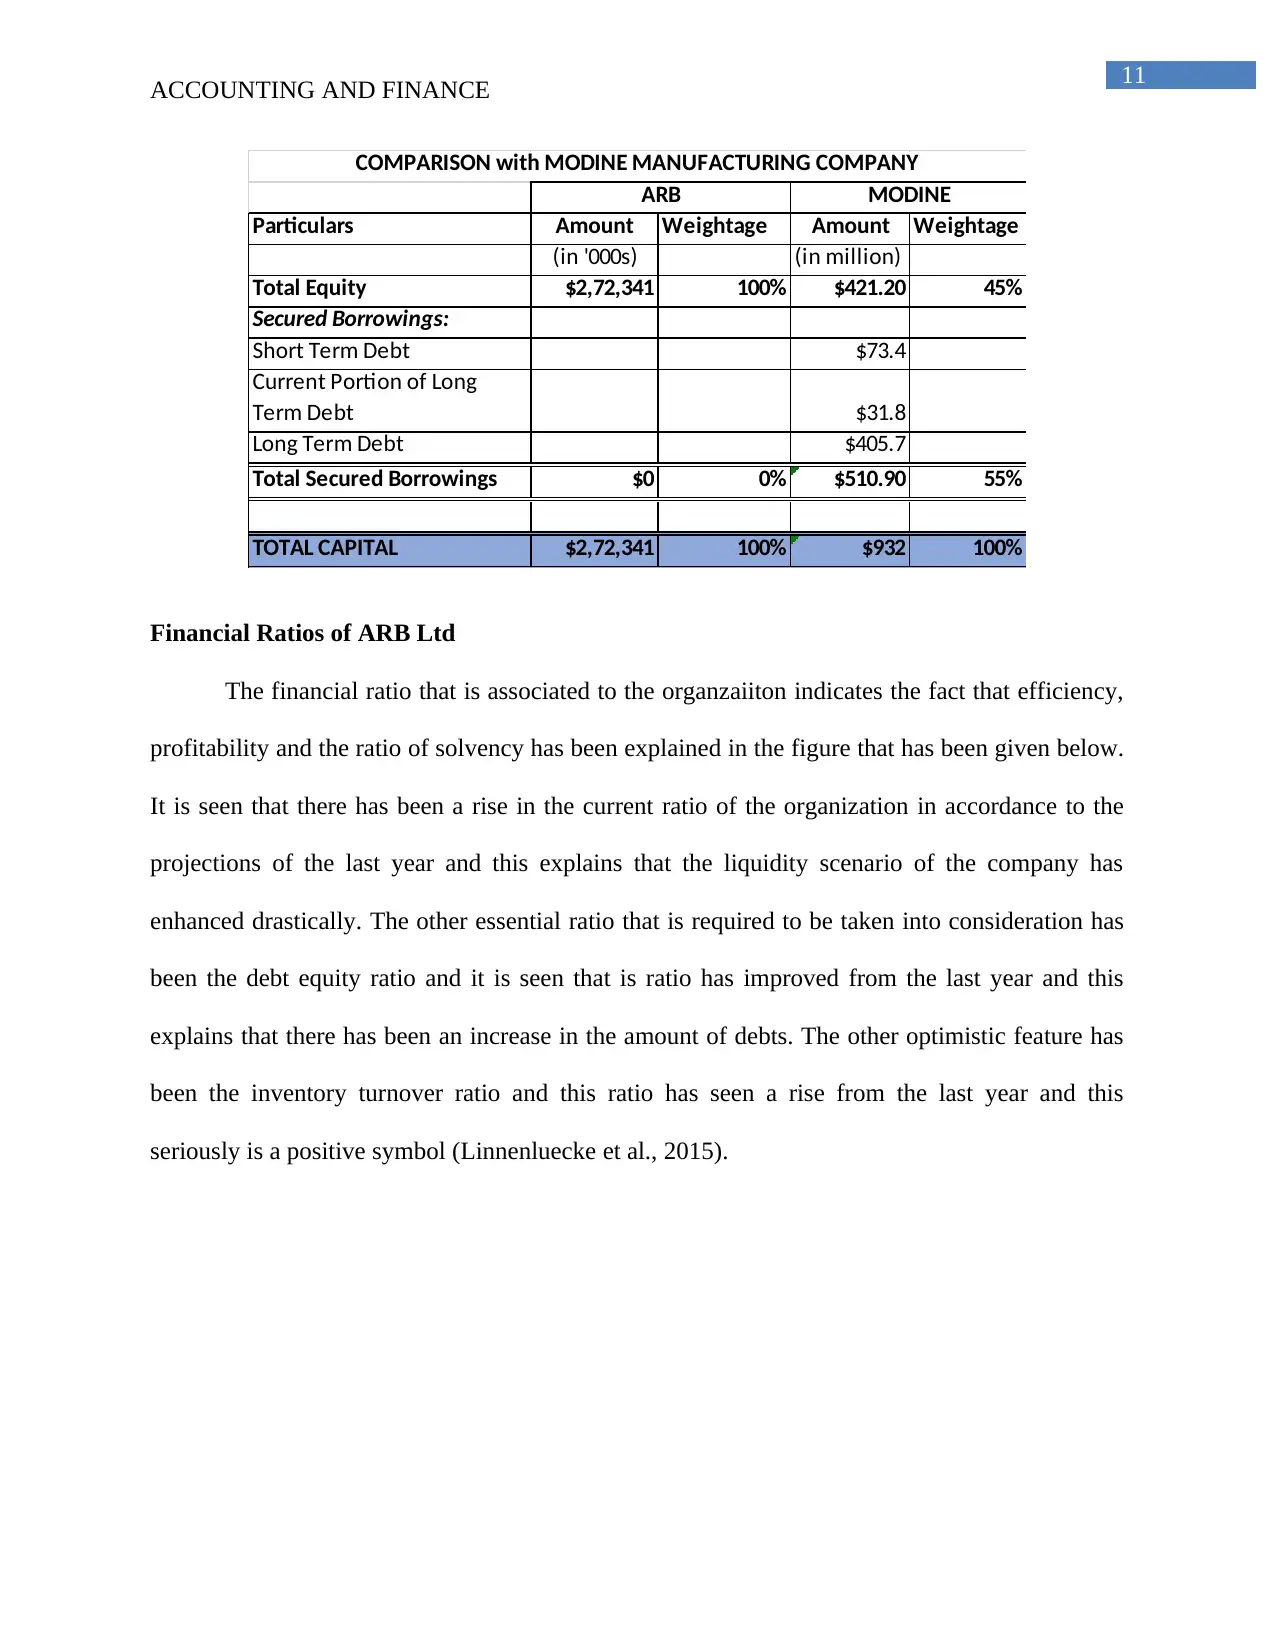
Comparison between Modine Ltd and ARB Ltd
In order to undertake a comparison, it is seen that Modine Ltd is functioning in the
similar industry as ARB Ltd and they are associated with similar kinds of business functions as
well. The capital structure of Modine Ltd comprises of the debt and the equity capital and
thereby this indicates that the company is looking to attain a constructive capital mix structure
that would be useful in mitigating the entire risk that is related to the business (Balakrishnan et
al., 2016). However, when assessing the scenario of ARB Ltd, it is seen that the capital structure
of the company comprises of the equity share capital. The debt and the equity capital that is
being utilised by Modine Ltd is found to be $412.20 million and the $519.90 million. This
explains that the capital structure of Modine Ltd has been much better than the one that is
available for ARB Ltd.
ACCOUNTING AND FINANCE
this value has been encouraging by looking at the rate of return from the market and this value
has been 30.7%. This indicates that the anticipations of the shareholders have been satisfied.
Cost of Equity under CAPM:
Particulars Amount
Beta 0.89
Market Return 8.54%
Risk Free Rate 2.78%
Expected Cost of Equity 7.906%
Comparison between Modine Ltd and ARB Ltd
In order to undertake a comparison, it is seen that Modine Ltd is functioning in the
similar industry as ARB Ltd and they are associated with similar kinds of business functions as
well. The capital structure of Modine Ltd comprises of the debt and the equity capital and
thereby this indicates that the company is looking to attain a constructive capital mix structure
that would be useful in mitigating the entire risk that is related to the business (Balakrishnan et
al., 2016). However, when assessing the scenario of ARB Ltd, it is seen that the capital structure
of the company comprises of the equity share capital. The debt and the equity capital that is
being utilised by Modine Ltd is found to be $412.20 million and the $519.90 million. This
explains that the capital structure of Modine Ltd has been much better than the one that is
available for ARB Ltd.
11
ACCOUNTING AND FINANCE
Particulars Amount Weightage Amount Weightage
(in '000s) (in million)
Total Equity $2,72,341 100% $421.20 45%
Secured Borrowings:
Short Term Debt $73.4
Current Portion of Long
Term Debt $31.8
Long Term Debt $405.7
Total Secured Borrowings $0 0% $510.90 55%
TOTAL CAPITAL $2,72,341 100% $932 100%
ARB MODINE
COMPARISON with MODINE MANUFACTURING COMPANY
Financial Ratios of ARB Ltd
The financial ratio that is associated to the organzaiiton indicates the fact that efficiency,
profitability and the ratio of solvency has been explained in the figure that has been given below.
It is seen that there has been a rise in the current ratio of the organization in accordance to the
projections of the last year and this explains that the liquidity scenario of the company has
enhanced drastically. The other essential ratio that is required to be taken into consideration has
been the debt equity ratio and it is seen that is ratio has improved from the last year and this
explains that there has been an increase in the amount of debts. The other optimistic feature has
been the inventory turnover ratio and this ratio has seen a rise from the last year and this
seriously is a positive symbol (Linnenluecke et al., 2015).
⊘ This is a preview!⊘
Do you want full access?
Subscribe today to unlock all pages.
Trusted by 1+ million students worldwide
1 out of 17
Related Documents


Your All-in-One AI-Powered Toolkit for Academic Success.
+13062052269
info@desklib.com
Available 24*7 on WhatsApp / Email
![[object Object]](/_next/static/media/star-bottom.7253800d.svg)
Unlock your academic potential
Copyright © 2020–2026 A2Z Services. All Rights Reserved. Developed and managed by ZUCOL.