Analysis of Capital Budgeting Techniques for Financial Projects
VerifiedAdded on  2021/06/14
|16
|1675
|53
Homework Assignment
AI Summary
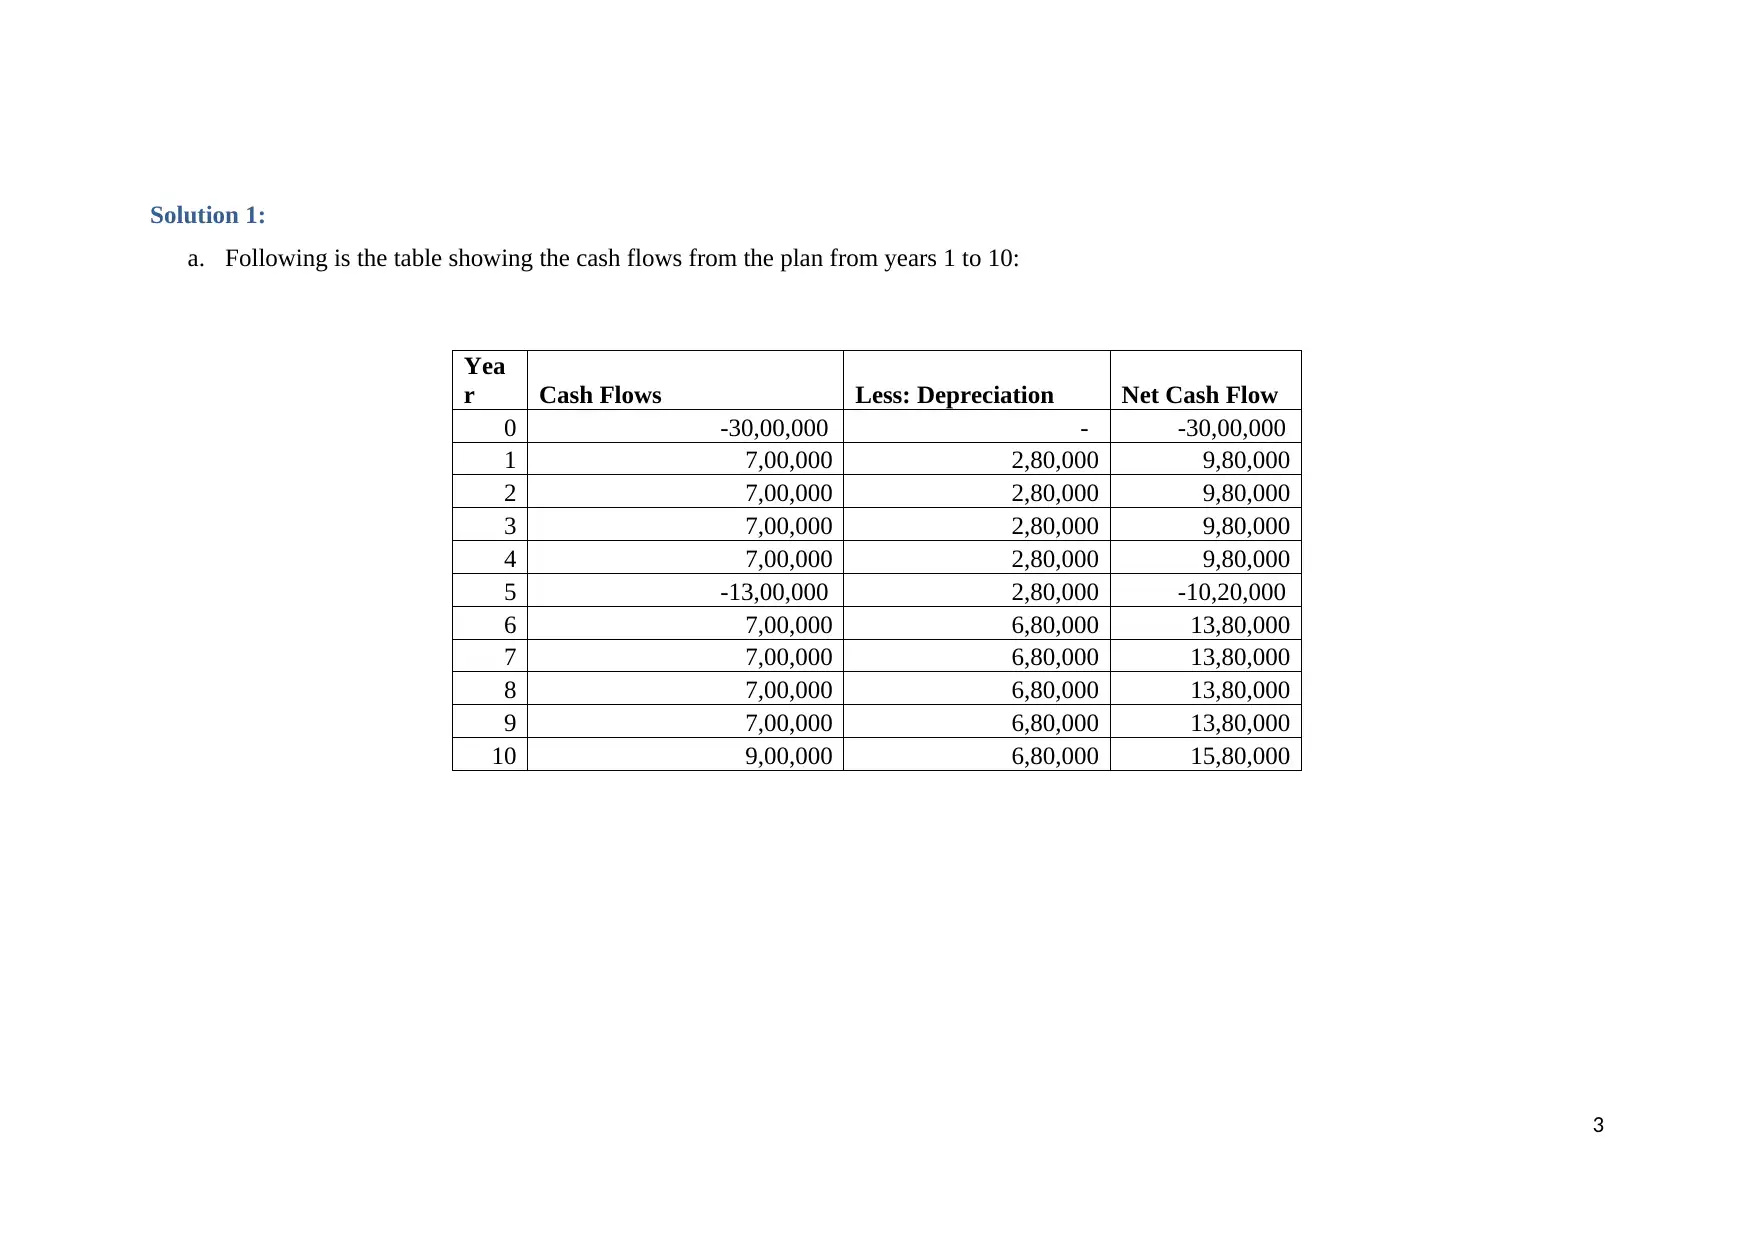
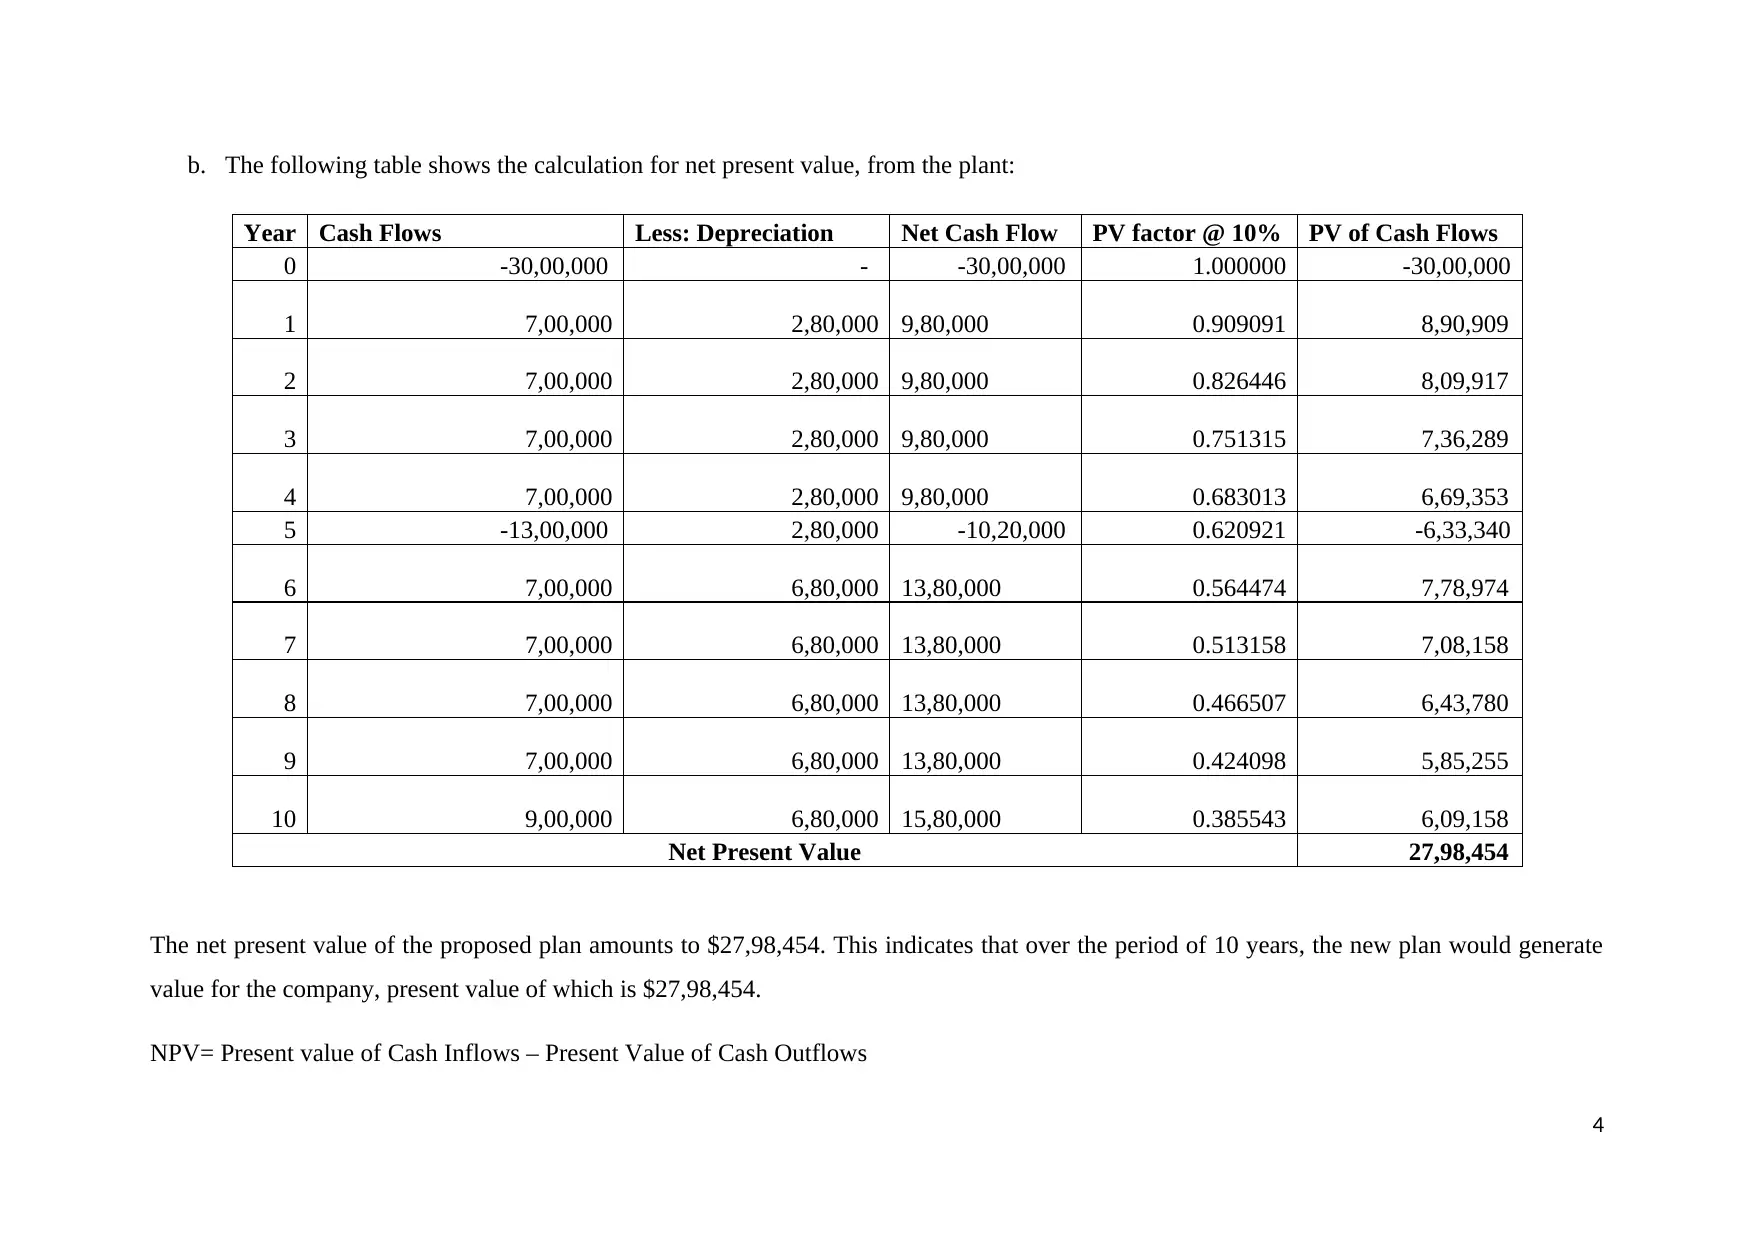
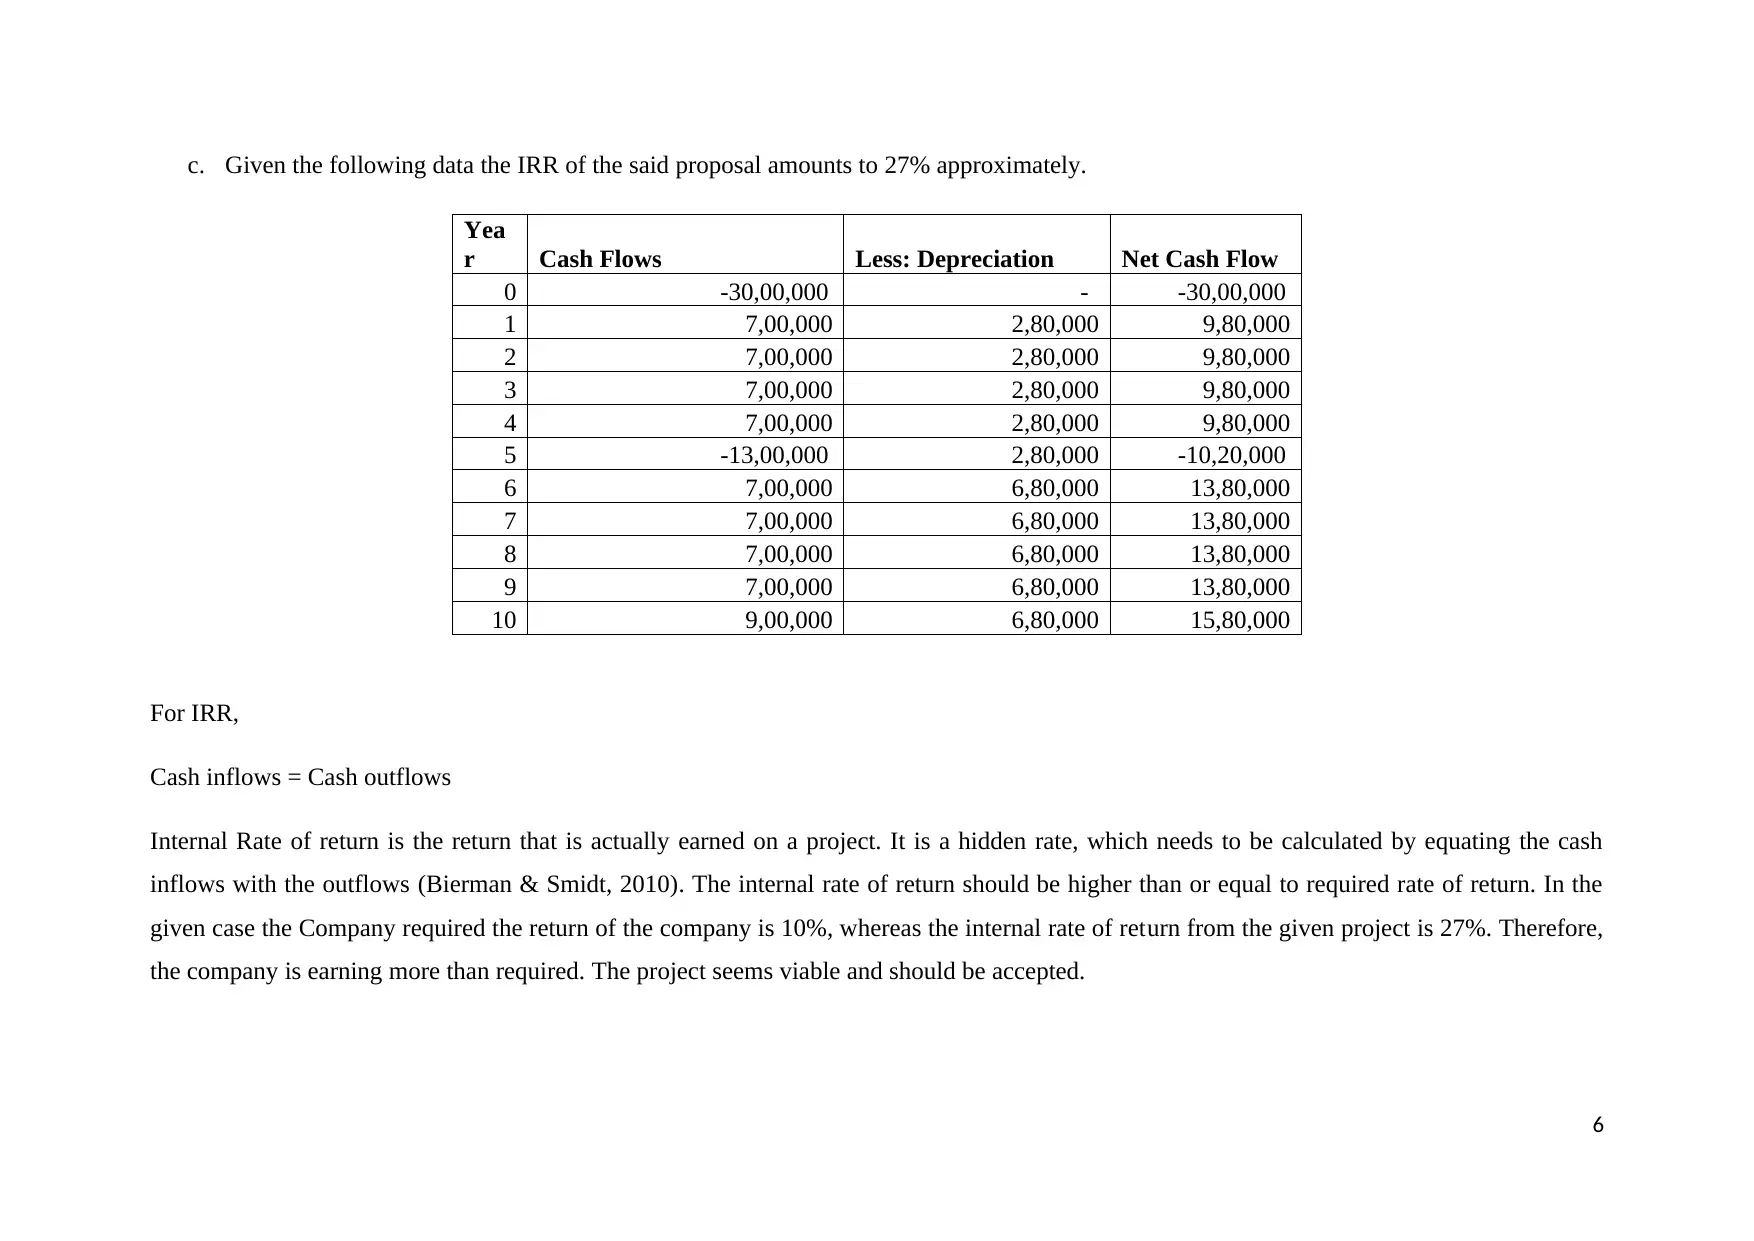
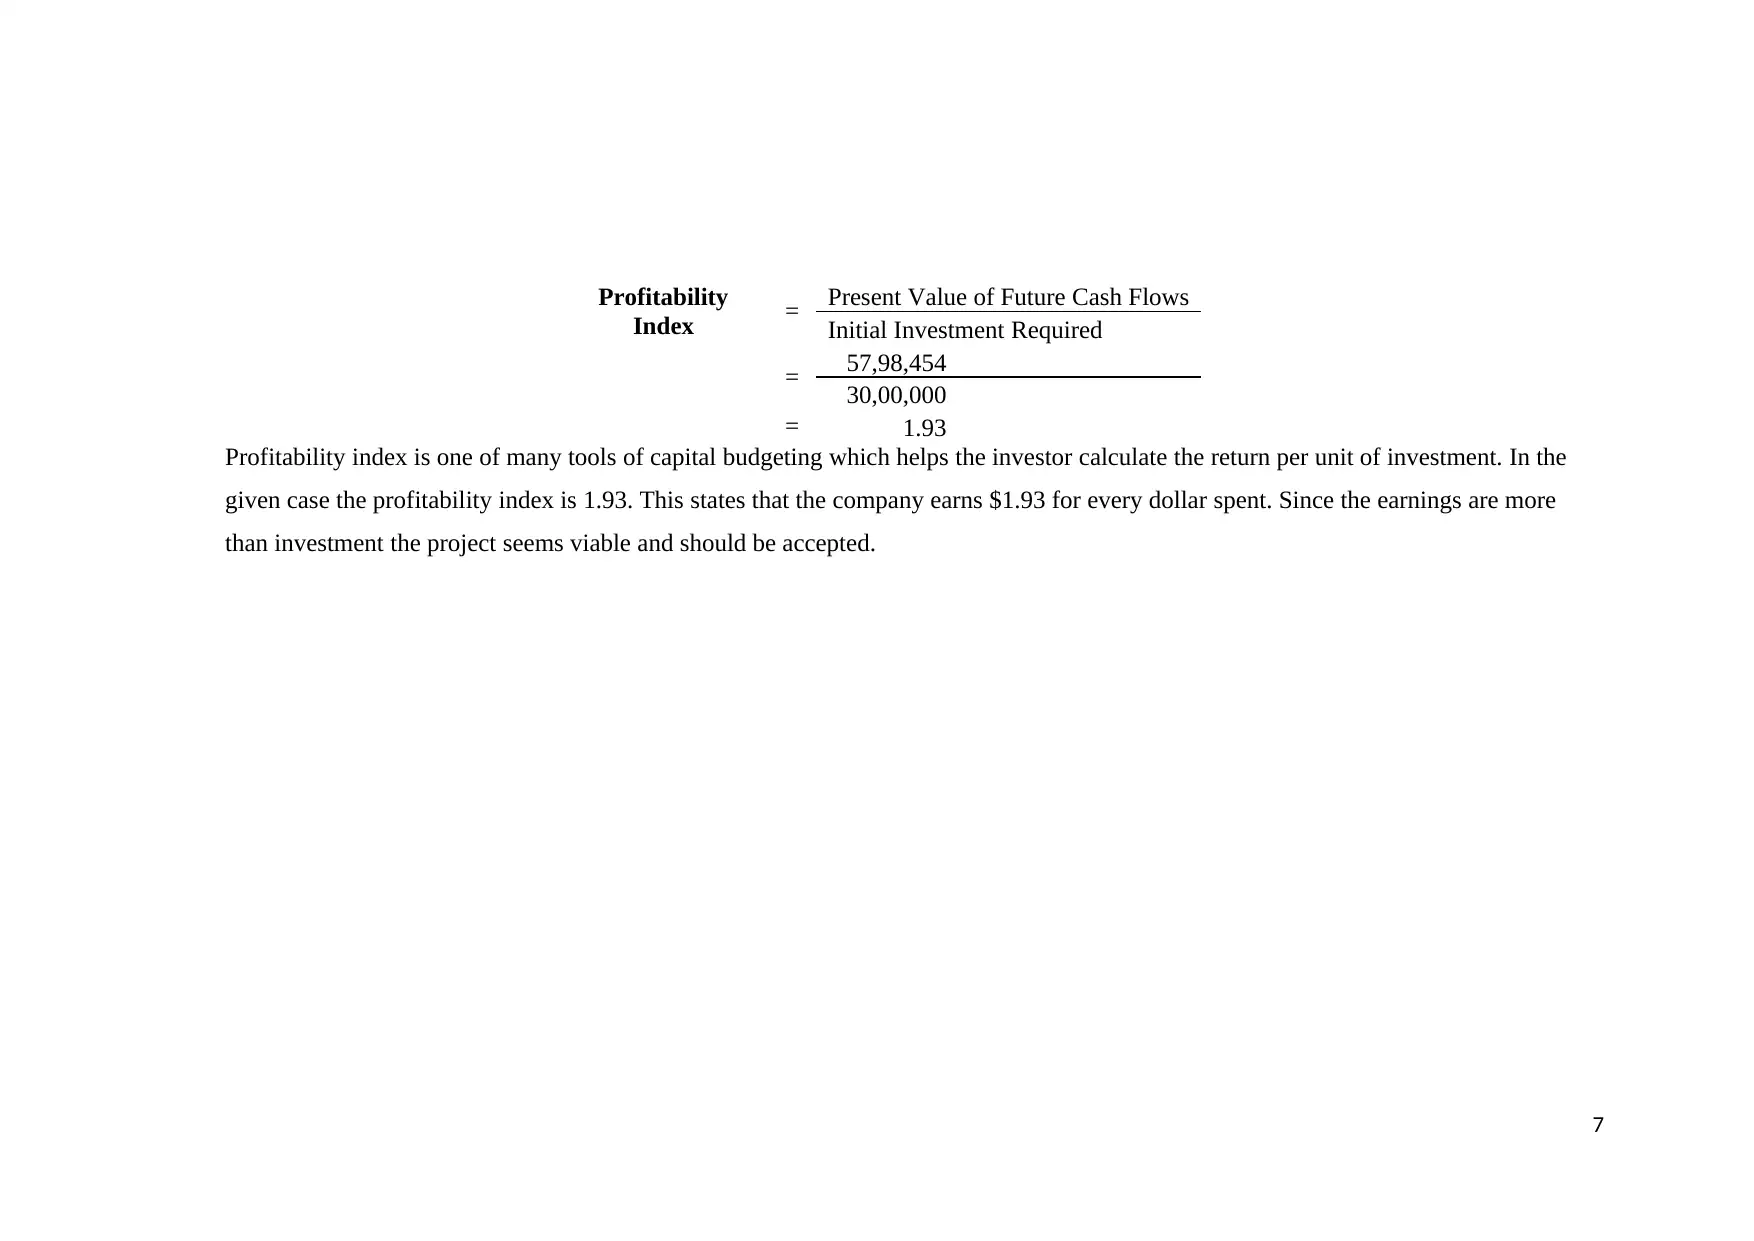
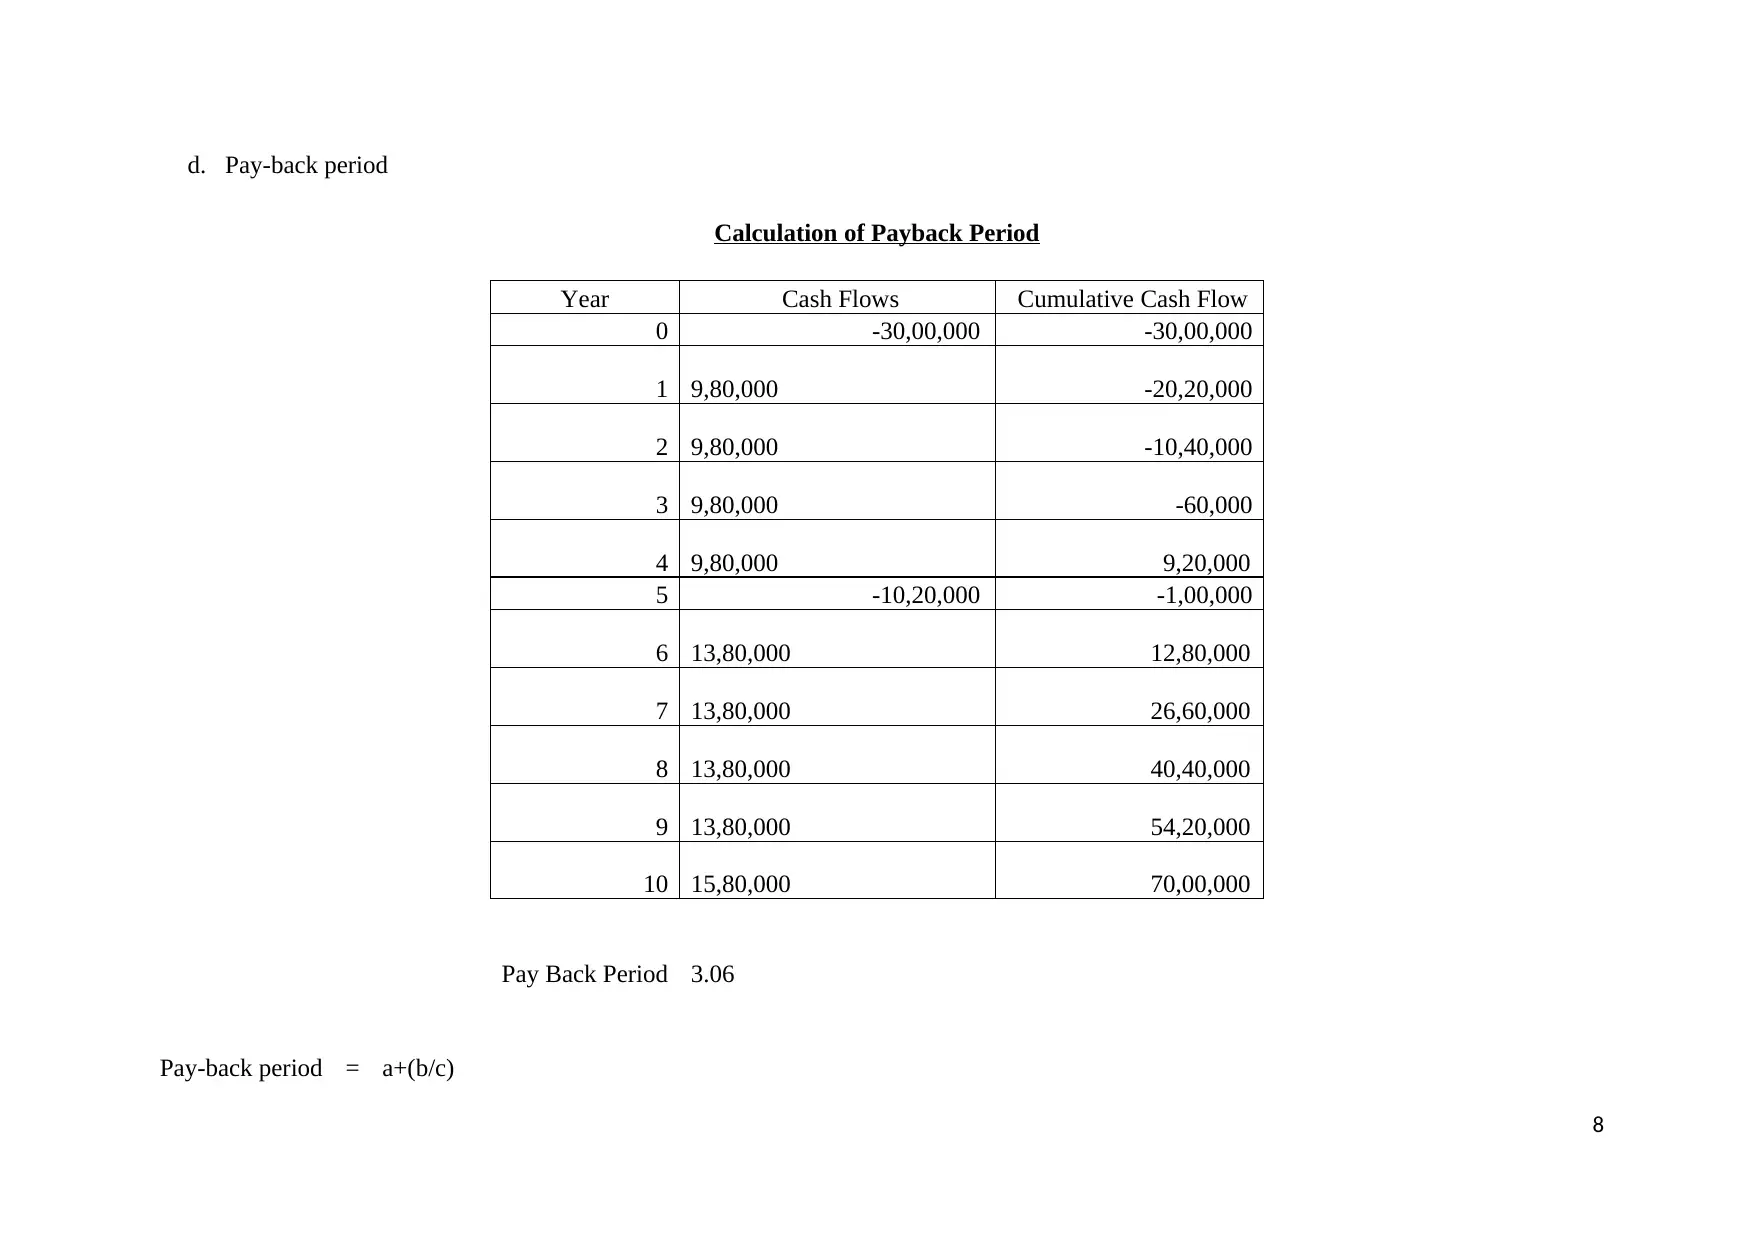
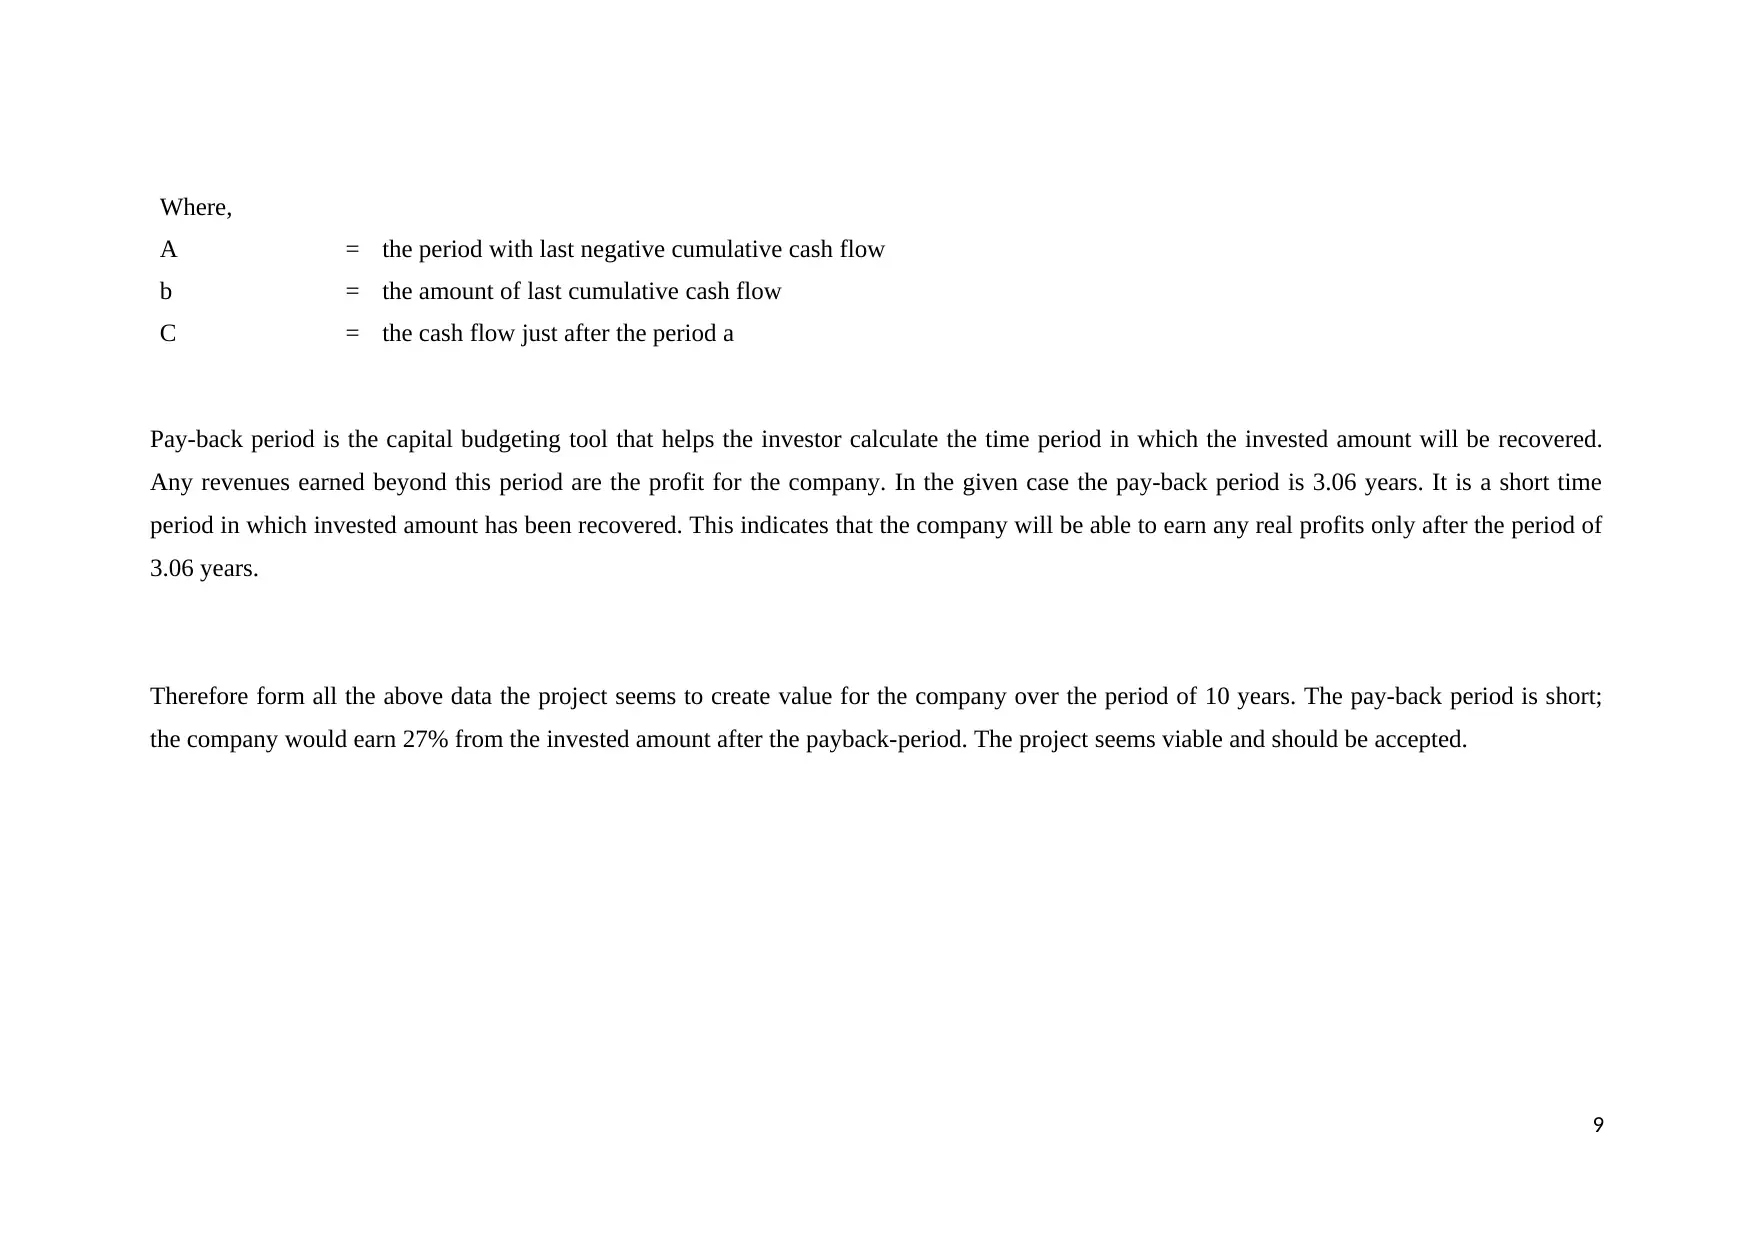
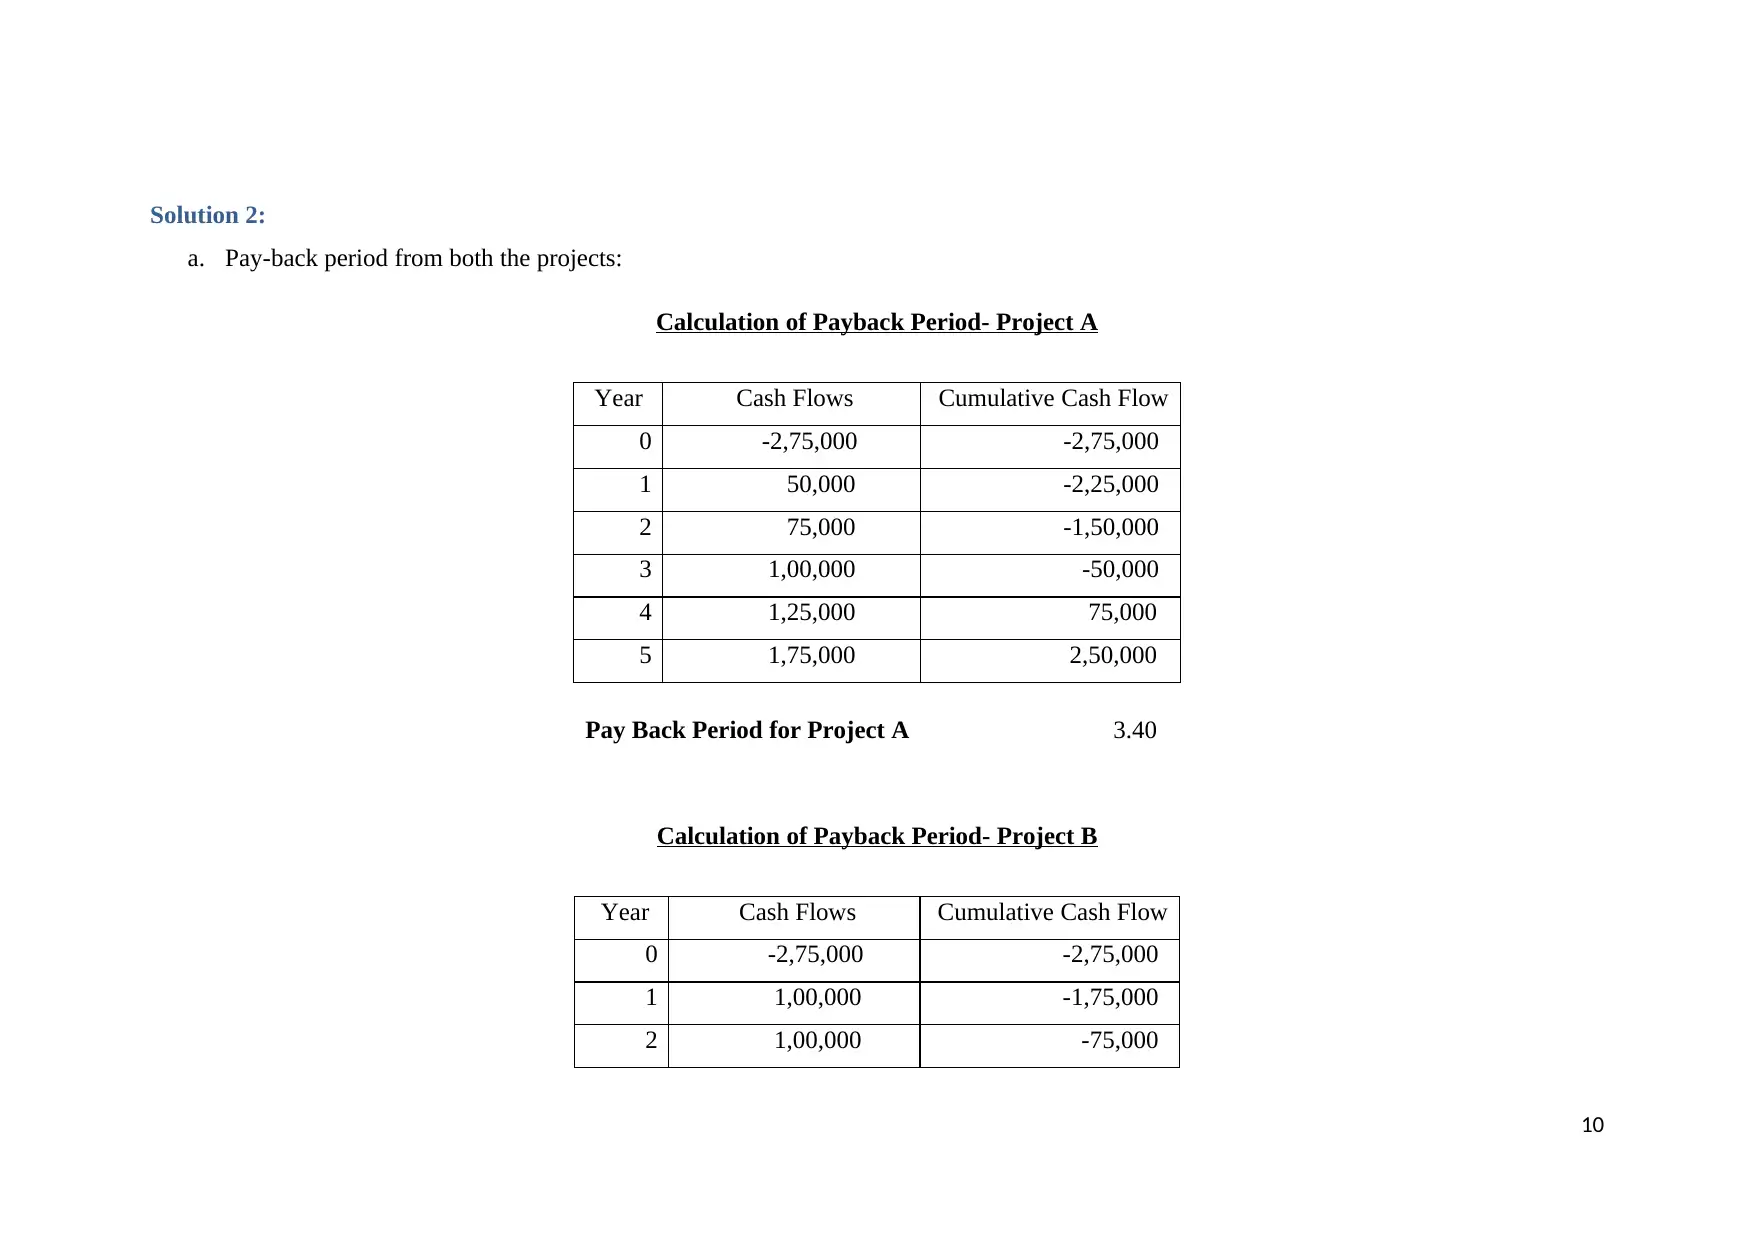
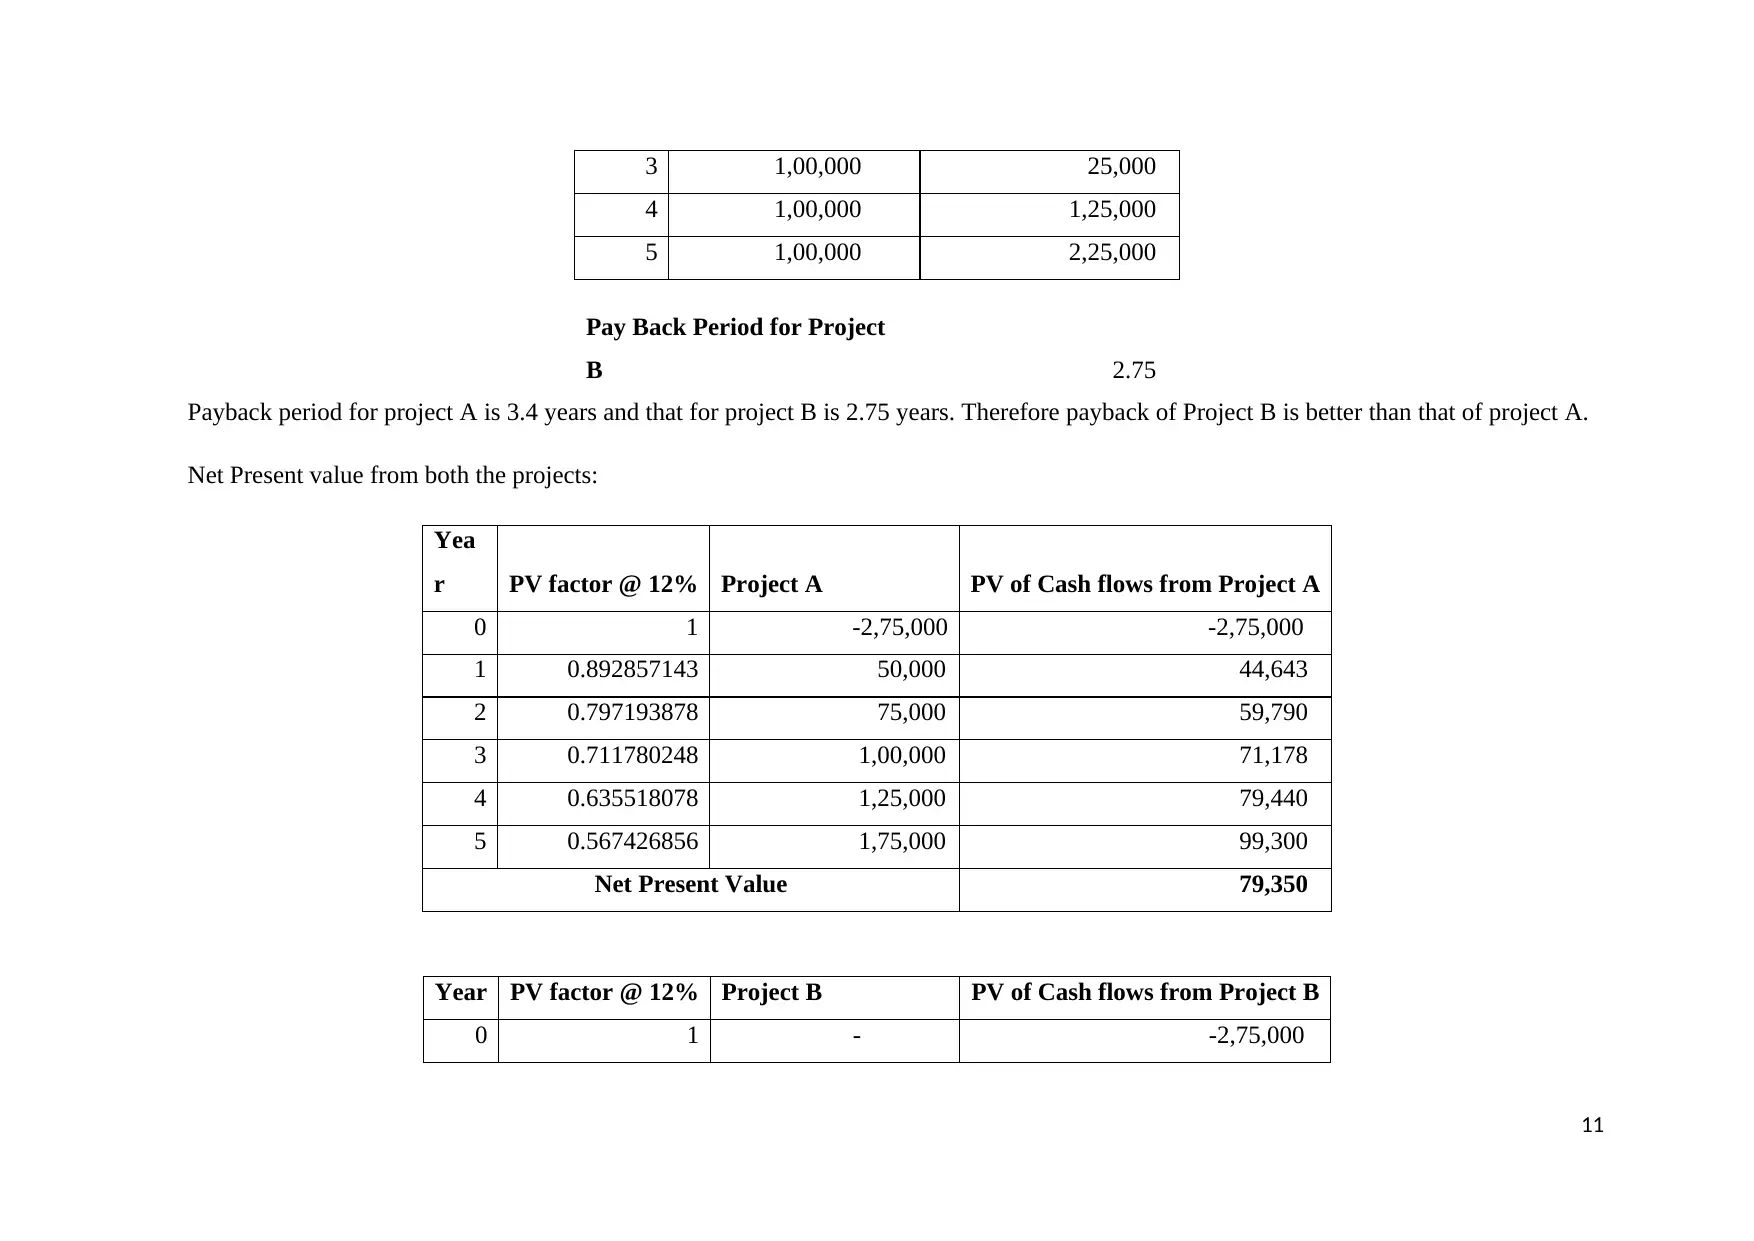
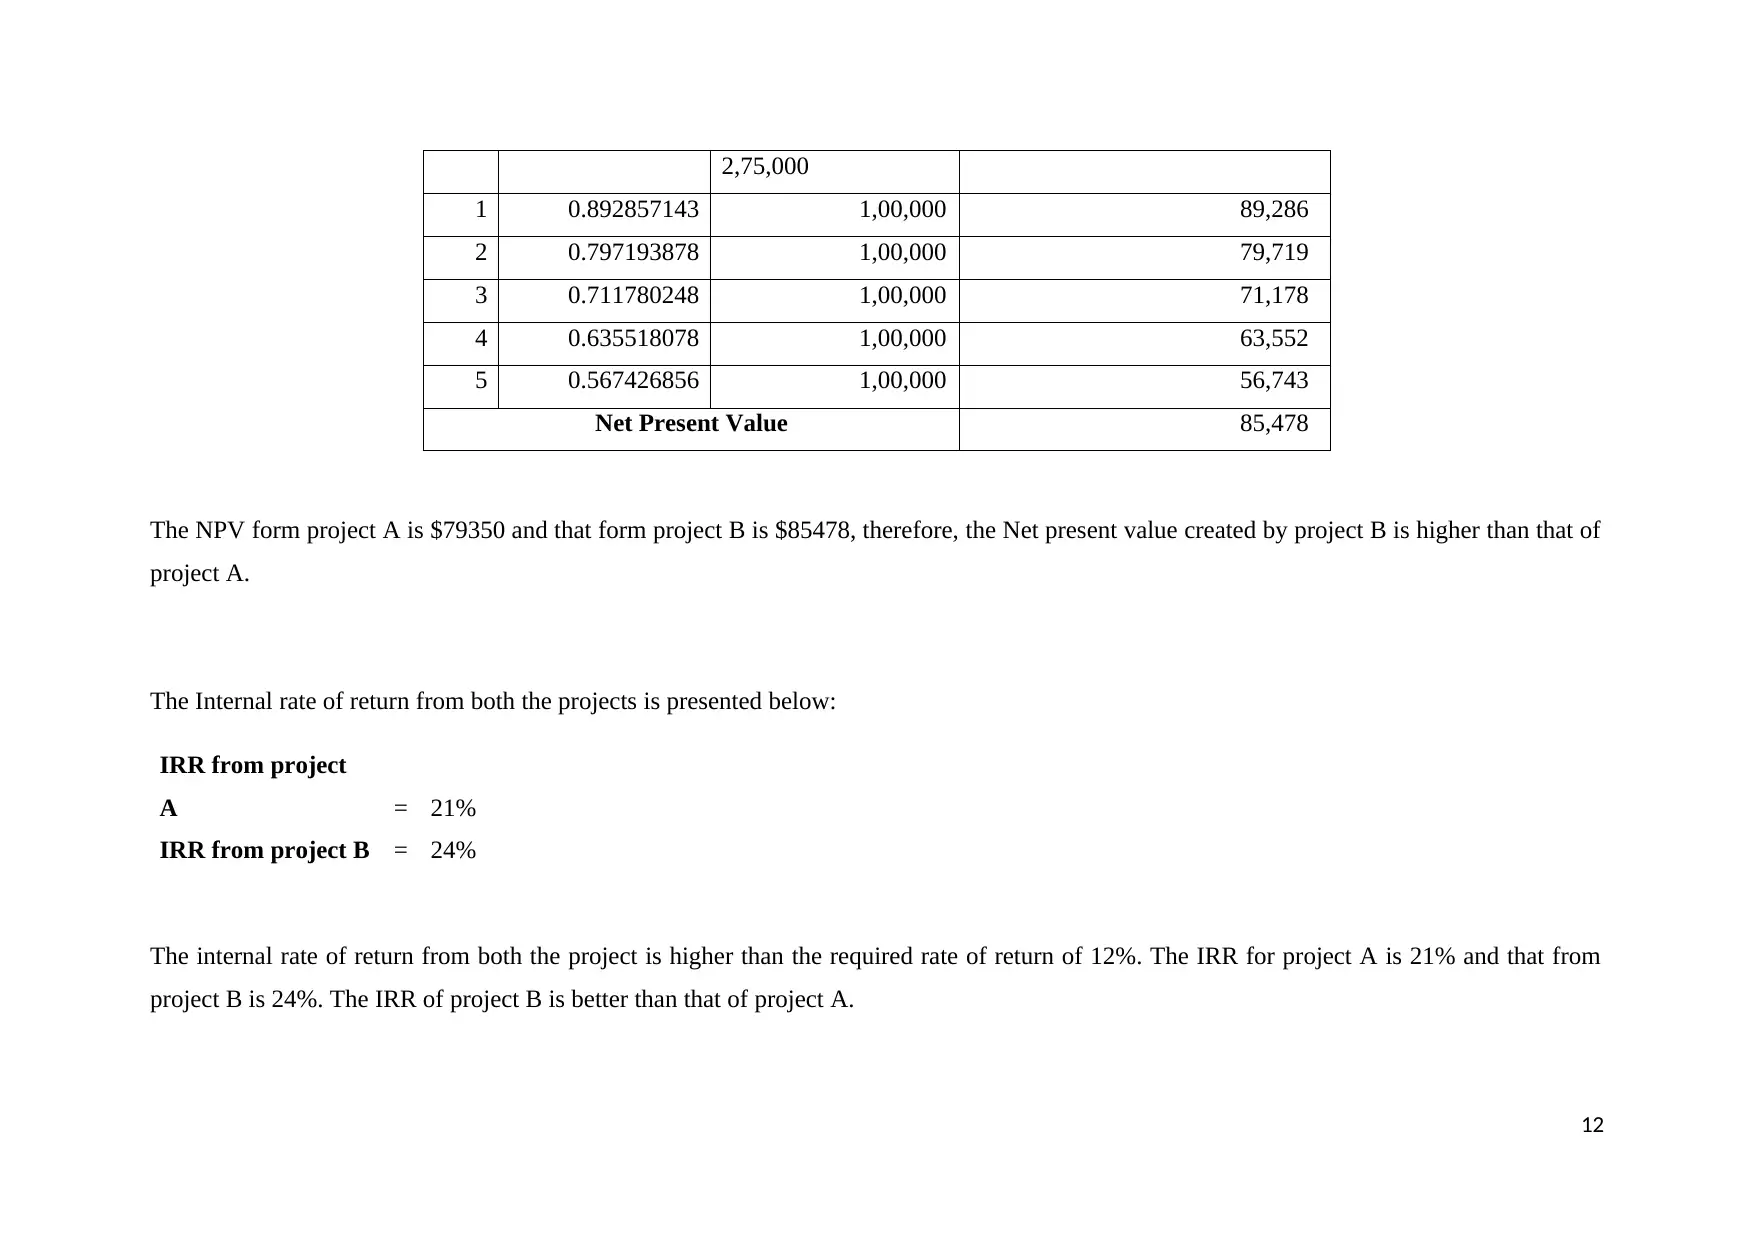
This assignment analyzes two financial projects using capital budgeting techniques. Solution 1 calculates the Net Present Value (NPV), Internal Rate of Return (IRR), Profitability Index, and Payback Period for a new plant investment, concluding the project is viable. Solution 2 compares two projects (A and B), calculating their payback periods, NPVs, and IRRs. The analysis reveals that Project B has a higher NPV and IRR, and a shorter payback period, making it the preferred choice. The assignment highlights the importance of these capital budgeting tools in evaluating investment opportunities and making informed financial decisions. The document also includes a bibliography citing relevant finance resources.

MANAGING FINANCE
1
1
Paraphrase This Document
Need a fresh take? Get an instant paraphrase of this document with our AI Paraphraser

Contents
Solution 1:..................................................................................................................................................................................................................................... 3
Solution 2:................................................................................................................................................................................................................................... 10
Bibliography................................................................................................................................................................................................................................ 15
2

Solution 1:
a. Following is the table showing the cash flows from the plan from years 1 to 10:
Yea
r Cash Flows Less: Depreciation Net Cash Flow
0 -30,00,000 - -30,00,000
1 7,00,000 2,80,000 9,80,000
2 7,00,000 2,80,000 9,80,000
3 7,00,000 2,80,000 9,80,000
4 7,00,000 2,80,000 9,80,000
5 -13,00,000 2,80,000 -10,20,000
6 7,00,000 6,80,000 13,80,000
7 7,00,000 6,80,000 13,80,000
8 7,00,000 6,80,000 13,80,000
9 7,00,000 6,80,000 13,80,000
10 9,00,000 6,80,000 15,80,000
3
⊘ This is a preview!⊘
Do you want full access?
Subscribe today to unlock all pages.

Trusted by 1+ million students worldwide

b. The following table shows the calculation for net present value, from the plant:
Year Cash Flows Less: Depreciation Net Cash Flow PV factor @ 10% PV of Cash Flows
0 -30,00,000 - -30,00,000 1.000000 -30,00,000
1 7,00,000 2,80,000 9,80,000 0.909091 8,90,909
2 7,00,000 2,80,000 9,80,000 0.826446 8,09,917
3 7,00,000 2,80,000 9,80,000 0.751315 7,36,289
4 7,00,000 2,80,000 9,80,000 0.683013 6,69,353
5 -13,00,000 2,80,000 -10,20,000 0.620921 -6,33,340
6 7,00,000 6,80,000 13,80,000 0.564474 7,78,974
7 7,00,000 6,80,000 13,80,000 0.513158 7,08,158
8 7,00,000 6,80,000 13,80,000 0.466507 6,43,780
9 7,00,000 6,80,000 13,80,000 0.424098 5,85,255
10 9,00,000 6,80,000 15,80,000 0.385543 6,09,158
Net Present Value 27,98,454
The net present value of the proposed plan amounts to $27,98,454. This indicates that over the period of 10 years, the new plan would generate
value for the company, present value of which is $27,98,454.
NPV= Present value of Cash Inflows – Present Value of Cash Outflows
4
Paraphrase This Document
Need a fresh take? Get an instant paraphrase of this document with our AI Paraphraser

The net present value is the capital budgeting tool which helps calculate the value of the proposed plan (Adelaja, 2015). That is it helps the
investor analyse if there are expected to be positive cash flows or negative cash flows from a said proposal. In the given case, we see that the
proposal is expected to create a value of $2798454 for the company; hence the proposal should be accepted.
5
investor analyse if there are expected to be positive cash flows or negative cash flows from a said proposal. In the given case, we see that the
proposal is expected to create a value of $2798454 for the company; hence the proposal should be accepted.
5

c. Given the following data the IRR of the said proposal amounts to 27% approximately.
Yea
r Cash Flows Less: Depreciation Net Cash Flow
0 -30,00,000 - -30,00,000
1 7,00,000 2,80,000 9,80,000
2 7,00,000 2,80,000 9,80,000
3 7,00,000 2,80,000 9,80,000
4 7,00,000 2,80,000 9,80,000
5 -13,00,000 2,80,000 -10,20,000
6 7,00,000 6,80,000 13,80,000
7 7,00,000 6,80,000 13,80,000
8 7,00,000 6,80,000 13,80,000
9 7,00,000 6,80,000 13,80,000
10 9,00,000 6,80,000 15,80,000
For IRR,
Cash inflows = Cash outflows
Internal Rate of return is the return that is actually earned on a project. It is a hidden rate, which needs to be calculated by equating the cash
inflows with the outflows (Bierman & Smidt, 2010). The internal rate of return should be higher than or equal to required rate of return. In the
given case the Company required the return of the company is 10%, whereas the internal rate of return from the given project is 27%. Therefore,
the company is earning more than required. The project seems viable and should be accepted.
6
⊘ This is a preview!⊘
Do you want full access?
Subscribe today to unlock all pages.

Trusted by 1+ million students worldwide

Profitability
Index = Present Value of Future Cash Flows
Initial Investment Required
= 57,98,454
30,00,000
= 1.93
Profitability index is one of many tools of capital budgeting which helps the investor calculate the return per unit of investment. In the
given case the profitability index is 1.93. This states that the company earns $1.93 for every dollar spent. Since the earnings are more
than investment the project seems viable and should be accepted.
7
Paraphrase This Document
Need a fresh take? Get an instant paraphrase of this document with our AI Paraphraser

d. Pay-back period
Calculation of Payback Period
Year Cash Flows Cumulative Cash Flow
0 -30,00,000 -30,00,000
1 9,80,000 -20,20,000
2 9,80,000 -10,40,000
3 9,80,000 -60,000
4 9,80,000 9,20,000
5 -10,20,000 -1,00,000
6 13,80,000 12,80,000
7 13,80,000 26,60,000
8 13,80,000 40,40,000
9 13,80,000 54,20,000
10 15,80,000 70,00,000
Pay Back Period 3.06
Pay-back period = a+(b/c)
8

Where,
A = the period with last negative cumulative cash flow
b = the amount of last cumulative cash flow
C = the cash flow just after the period a
Pay-back period is the capital budgeting tool that helps the investor calculate the time period in which the invested amount will be recovered.
Any revenues earned beyond this period are the profit for the company. In the given case the pay-back period is 3.06 years. It is a short time
period in which invested amount has been recovered. This indicates that the company will be able to earn any real profits only after the period of
3.06 years.
Therefore form all the above data the project seems to create value for the company over the period of 10 years. The pay-back period is short;
the company would earn 27% from the invested amount after the payback-period. The project seems viable and should be accepted.
9
⊘ This is a preview!⊘
Do you want full access?
Subscribe today to unlock all pages.

Trusted by 1+ million students worldwide

Solution 2:
a. Pay-back period from both the projects:
Calculation of Payback Period- Project A
Year Cash Flows Cumulative Cash Flow
0 -2,75,000 -2,75,000
1 50,000 -2,25,000
2 75,000 -1,50,000
3 1,00,000 -50,000
4 1,25,000 75,000
5 1,75,000 2,50,000
Pay Back Period for Project A 3.40
Calculation of Payback Period- Project B
Year Cash Flows Cumulative Cash Flow
0 -2,75,000 -2,75,000
1 1,00,000 -1,75,000
2 1,00,000 -75,000
10
Paraphrase This Document
Need a fresh take? Get an instant paraphrase of this document with our AI Paraphraser

3 1,00,000 25,000
4 1,00,000 1,25,000
5 1,00,000 2,25,000
Pay Back Period for Project
B 2.75
Payback period for project A is 3.4 years and that for project B is 2.75 years. Therefore payback of Project B is better than that of project A.
Net Present value from both the projects:
Yea
r PV factor @ 12% Project A PV of Cash flows from Project A
0 1 -2,75,000 -2,75,000
1 0.892857143 50,000 44,643
2 0.797193878 75,000 59,790
3 0.711780248 1,00,000 71,178
4 0.635518078 1,25,000 79,440
5 0.567426856 1,75,000 99,300
Net Present Value 79,350
Year PV factor @ 12% Project B PV of Cash flows from Project B
0 1 - -2,75,000
11

2,75,000
1 0.892857143 1,00,000 89,286
2 0.797193878 1,00,000 79,719
3 0.711780248 1,00,000 71,178
4 0.635518078 1,00,000 63,552
5 0.567426856 1,00,000 56,743
Net Present Value 85,478
The NPV form project A is $79350 and that form project B is $85478, therefore, the Net present value created by project B is higher than that of
project A.
The Internal rate of return from both the projects is presented below:
IRR from project
A = 21%
IRR from project B = 24%
The internal rate of return from both the project is higher than the required rate of return of 12%. The IRR for project A is 21% and that from
project B is 24%. The IRR of project B is better than that of project A.
12
⊘ This is a preview!⊘
Do you want full access?
Subscribe today to unlock all pages.

Trusted by 1+ million students worldwide
1 out of 16
Related Documents

Your All-in-One AI-Powered Toolkit for Academic Success.
 +13062052269
info@desklib.com
Available 24*7 on WhatsApp / Email
Unlock your academic potential
Copyright © 2020–2025 A2Z Services. All Rights Reserved. Developed and managed by ZUCOL.