Capital Budgeting Techniques: Evaluation and Decision-Making Process
VerifiedAdded on 2020/03/01
|8
|3195
|36
Report
AI Summary
This report delves into the critical area of capital budgeting, a cornerstone of financial decision-making for organizations. It begins by outlining the importance of decision-making processes within a corporate structure, emphasizing how effective decisions, supported by committed leadership at all levels, are crucial for long-term competitiveness. The report then focuses on capital budgeting, explaining its role in evaluating significant expenditures and investments, such as new projects or long-term assets, through techniques like Discounted Cash Flow (DCF) analysis, Net Present Value (NPV), Internal Rate of Return (IRR), and Discounted Payback Period. It provides detailed calculations and examples to illustrate these methods, including the evaluation of project profitability and the selection of projects based on financial metrics. The report also explores the significance of capital budgeting techniques in risk assessment, optimal project selection, and the long-term sustainability of a business. Furthermore, it covers advanced analytical methods like sensitivity analysis, scenario analysis, and break-even analysis, which are used to assess the impact of various factors on investment outcomes. By providing a comprehensive overview of these capital budgeting techniques, the report aims to equip readers with the knowledge needed to make informed investment decisions and achieve financial success.
An organization is based on the decisions made by its management. Therefore, decision making
process turns out to be a crucial part of an entity as one wrong decision could result in heavy
losses to the firm whether in terms of revenue or reputation. 'Decision - making involves the
examination of various courses of actions and choosing the most appropriate option in order to
arrive at a conclusion for a given scenario. Decision making process focuses on' goals'. It is
continuous in nature as our business environment is dynamic so as soon as one problem ends, the
other one arises and it goes on (Berman, Knight and Case, n.d.).
Corporate decision making takes place at various levels of the entity whether top down or bottom
up. Corporate decision making is characterized by its implementers because a decision is
effective only when it is being implemented in the best possible manner. The large laid plans can
go in vain if there is no commitment from the middle & lower management. Hence, it is
important for a management to maintain a good & healthy relation with its middle level & lower
level management (Bruner, Eades and Schill, 2017). Thus, corporate decisions are successful as
long as there is a 'glue' to keep the organization together in the form of encouraged leaders and
the firm that values coherence & maintains stability otherwise the entity falls into its own trap
leading to loss of competitiveness in the market.
Capital budgeting refers to the evaluation of the huge amount of expenditures and investments.
These expenses or investments include projects such as building a new plant or long term
investments (TULSIAN, 2016). Through capital budgeting, it becomes easier to evaluate
whether the returns provided by the company are meeting up with the targets, this is done by
calculating the lifetime outflows and inflows. This canalso be named as “investment appraisal”.
For a business, it is advantageous for it to take up all opportunities and projects but due a
Limitation of the availability of capital at a particular point of time, management uses capital
budgeting techniques to determine the maximum return from all the available projects at a time
(Clarke and Clarke, 1990). There are huge number of methods involved under capital
budgeting, they are explained below:
DCF Analysis: The NPV concept and the DCF concept is similar to each other. In both
the case the initial cost, maintenance cost and the other cash outflows and inflows are
pulled back in order to compute the Net present value of the project.
NPV: The amount of cash inflows over the cash outflows is known as Net present value.
It is used in the process of decision making through capital budgeting to determine the
profitability from a project or a long term investment. The positive NPV of a project is an
indication that the projected earnings exceed the costs while a negative NPV results in a
loss (Fairhurst, 2015). For example- There are two projects A and B having different structures
of cash flow and the required rate of return is 10.25 percent then the NPV of the cash flows will
be as follows:
Calculation of Net Present Values of each project
Paraphrase This Document
Need a fresh take? Get an instant paraphrase of this document with our AI Paraphraser
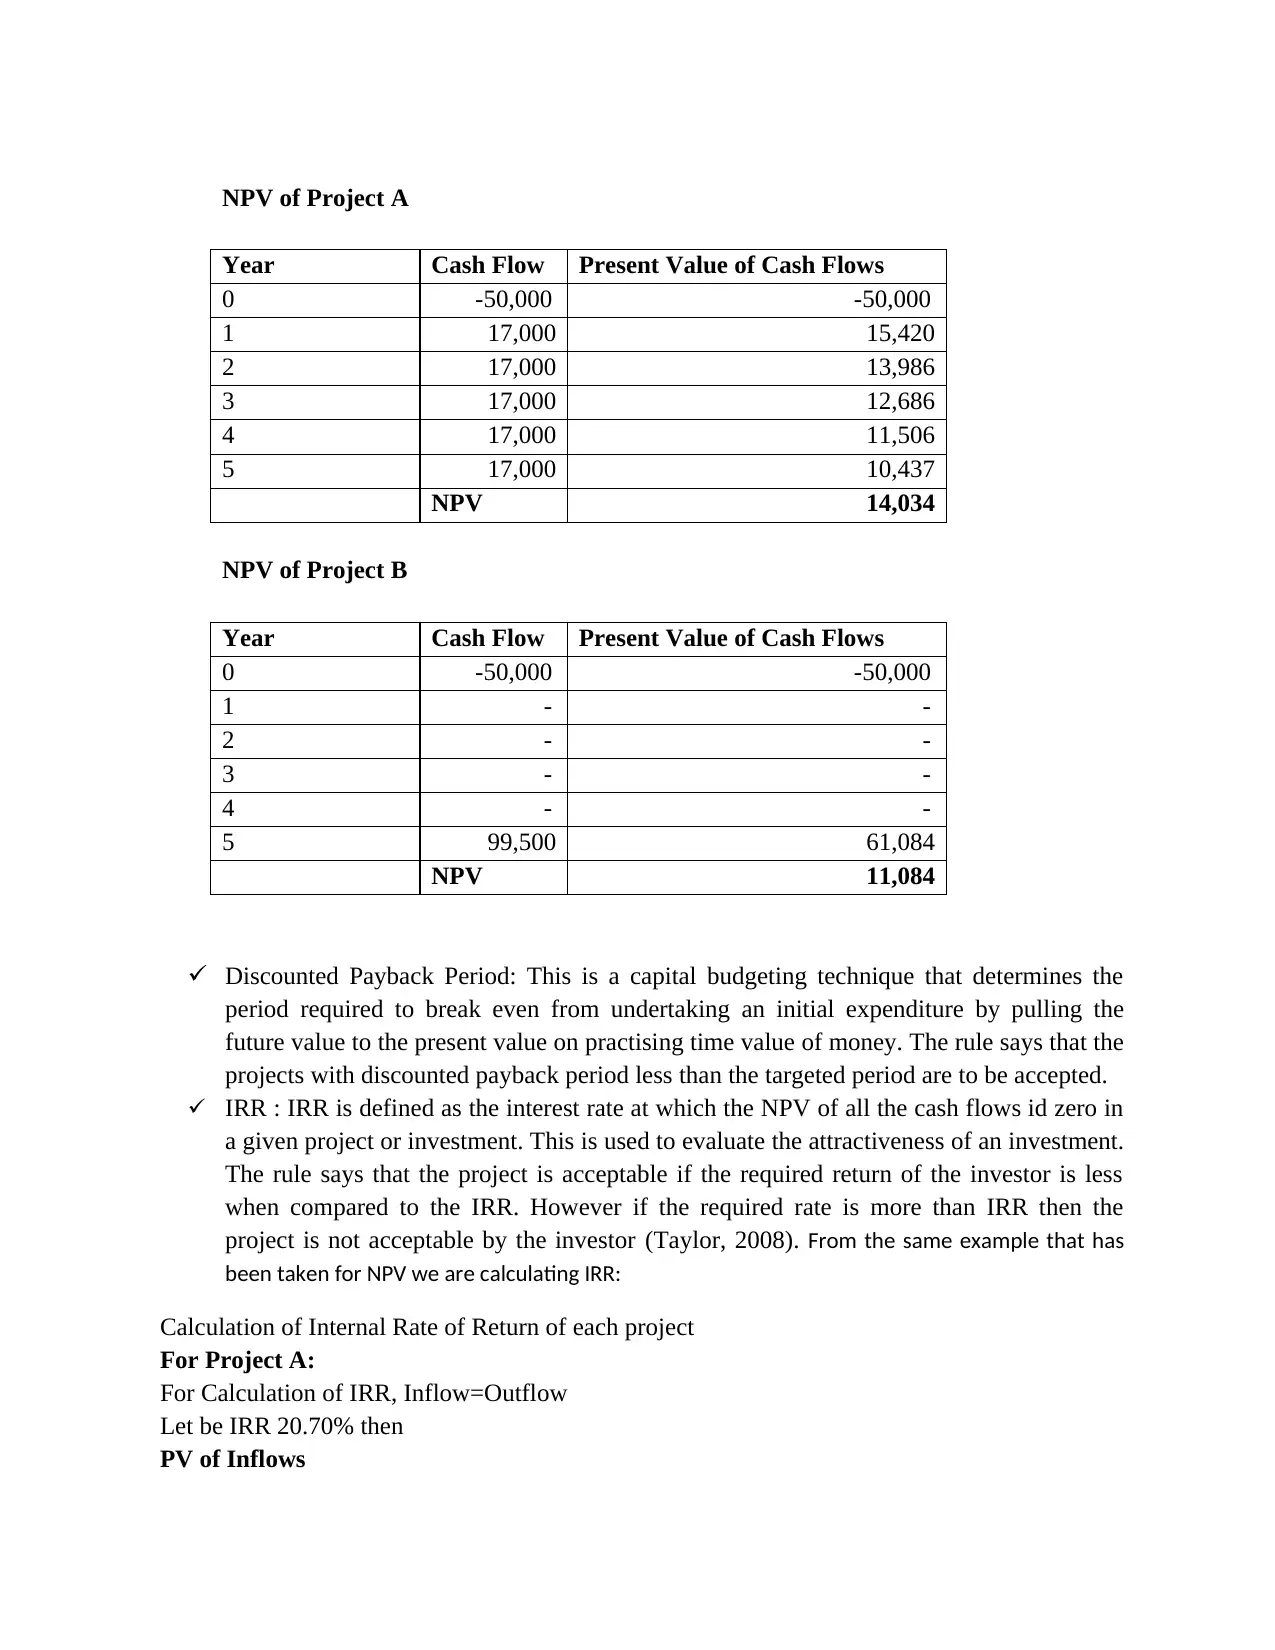
NPV of Project A
Year Cash Flow Present Value of Cash Flows
0 -50,000 -50,000
1 17,000 15,420
2 17,000 13,986
3 17,000 12,686
4 17,000 11,506
5 17,000 10,437
NPV 14,034
NPV of Project B
Year Cash Flow Present Value of Cash Flows
0 -50,000 -50,000
1 - -
2 - -
3 - -
4 - -
5 99,500 61,084
NPV 11,084
Discounted Payback Period: This is a capital budgeting technique that determines the
period required to break even from undertaking an initial expenditure by pulling the
future value to the present value on practising time value of money. The rule says that the
projects with discounted payback period less than the targeted period are to be accepted.
IRR : IRR is defined as the interest rate at which the NPV of all the cash flows id zero in
a given project or investment. This is used to evaluate the attractiveness of an investment.
The rule says that the project is acceptable if the required return of the investor is less
when compared to the IRR. However if the required rate is more than IRR then the
project is not acceptable by the investor (Taylor, 2008). From the same example that has
been taken for NPV we are calculating IRR:
Calculation of Internal Rate of Return of each project
For Project A:
For Calculation of IRR, Inflow=Outflow
Let be IRR 20.70% then
PV of Inflows
Year Cash Flow Present Value of Cash Flows
0 -50,000 -50,000
1 17,000 15,420
2 17,000 13,986
3 17,000 12,686
4 17,000 11,506
5 17,000 10,437
NPV 14,034
NPV of Project B
Year Cash Flow Present Value of Cash Flows
0 -50,000 -50,000
1 - -
2 - -
3 - -
4 - -
5 99,500 61,084
NPV 11,084
Discounted Payback Period: This is a capital budgeting technique that determines the
period required to break even from undertaking an initial expenditure by pulling the
future value to the present value on practising time value of money. The rule says that the
projects with discounted payback period less than the targeted period are to be accepted.
IRR : IRR is defined as the interest rate at which the NPV of all the cash flows id zero in
a given project or investment. This is used to evaluate the attractiveness of an investment.
The rule says that the project is acceptable if the required return of the investor is less
when compared to the IRR. However if the required rate is more than IRR then the
project is not acceptable by the investor (Taylor, 2008). From the same example that has
been taken for NPV we are calculating IRR:
Calculation of Internal Rate of Return of each project
For Project A:
For Calculation of IRR, Inflow=Outflow
Let be IRR 20.70% then
PV of Inflows
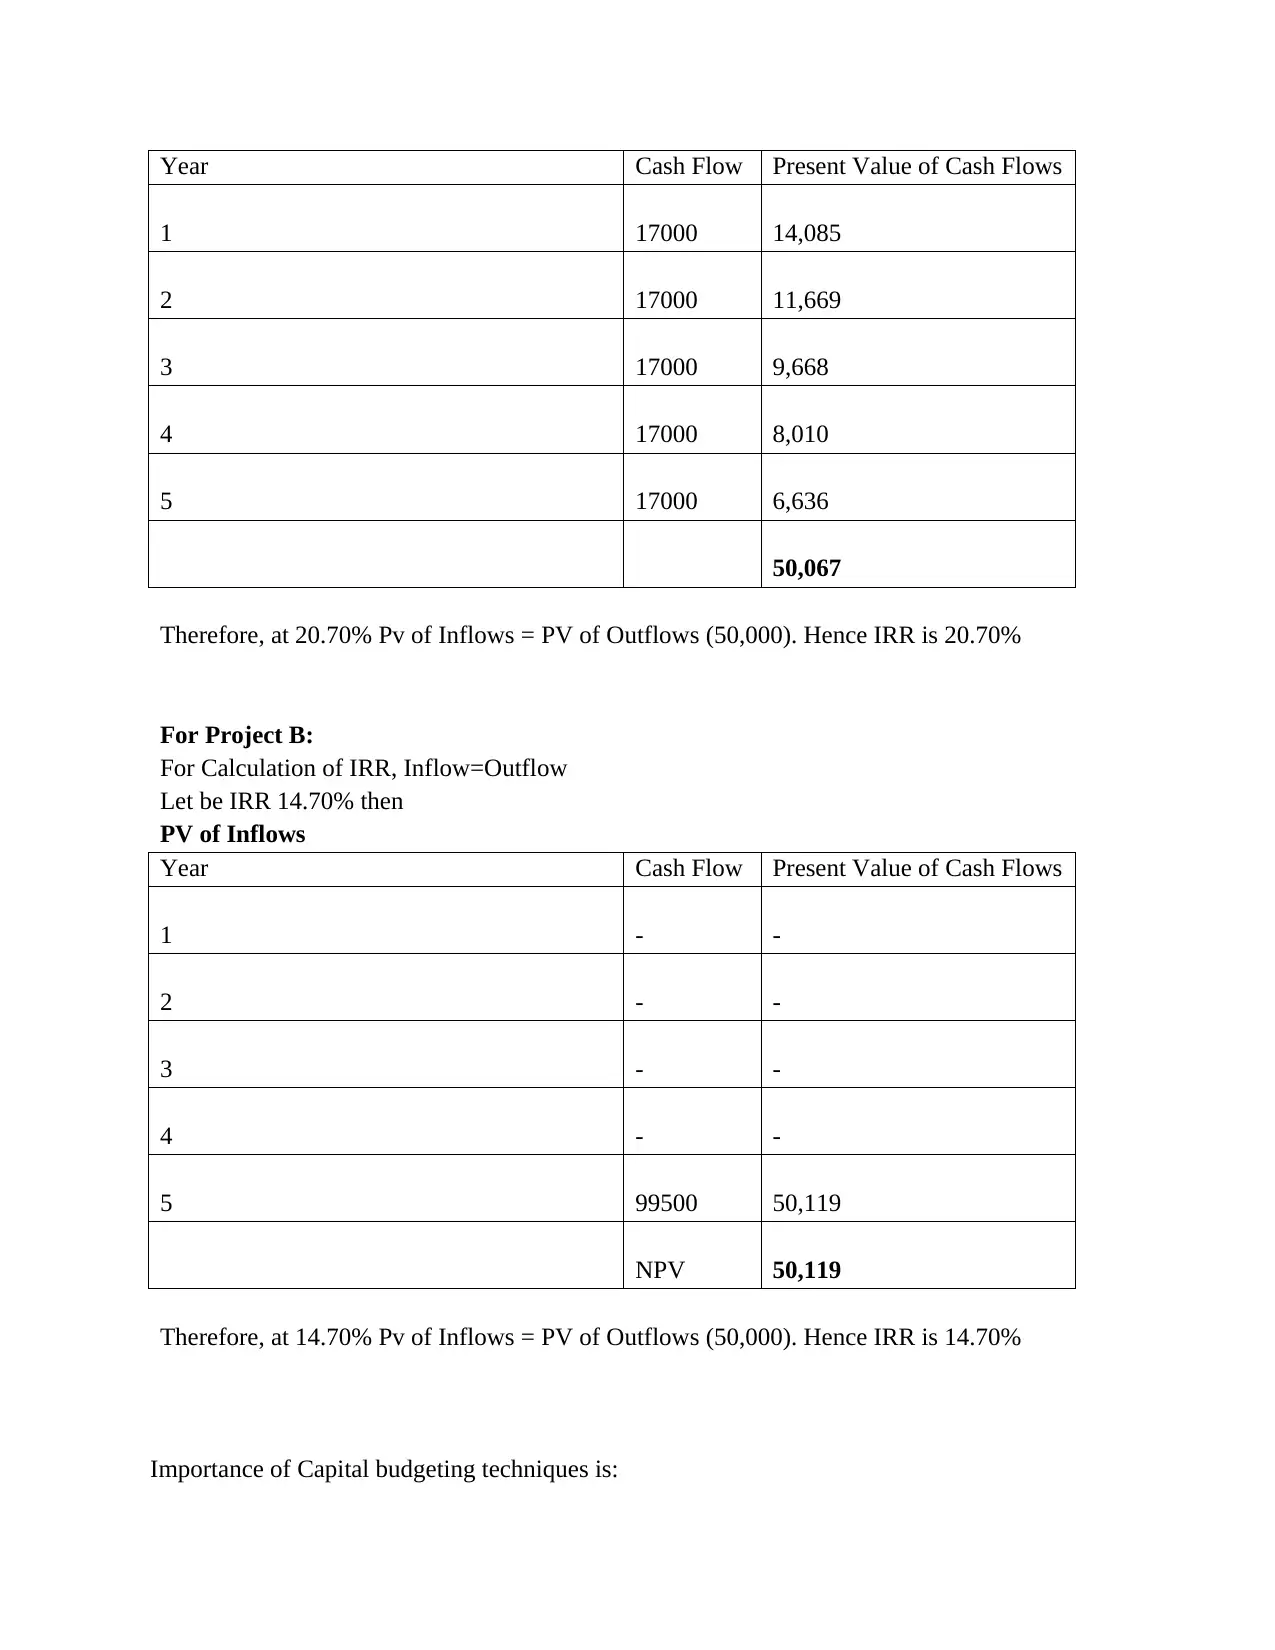
Year Cash Flow Present Value of Cash Flows
1 17000 14,085
2 17000 11,669
3 17000 9,668
4 17000 8,010
5 17000 6,636
50,067
Therefore, at 20.70% Pv of Inflows = PV of Outflows (50,000). Hence IRR is 20.70%
For Project B:
For Calculation of IRR, Inflow=Outflow
Let be IRR 14.70% then
PV of Inflows
Year Cash Flow Present Value of Cash Flows
1 - -
2 - -
3 - -
4 - -
5 99500 50,119
NPV 50,119
Therefore, at 14.70% Pv of Inflows = PV of Outflows (50,000). Hence IRR is 14.70%
Importance of Capital budgeting techniques is:
⊘ This is a preview!⊘
Do you want full access?
Subscribe today to unlock all pages.
Trusted by 1+ million students worldwide
Evaluation of Risks: long term investments are capital expenditures that involves
identifiable and significant financial risks. Therefore, for proper planning, capital
budgeting is important (Galbraith, Downey and Kates, 2002).
Choosing of the best course of action: It helps a company to choose the best investment
project that would give the best possible returns after considering every possible course
of action available. It focuses on increasing the shareholders wealth and helps a company
in achieving an edge in the market.
Irreversible Investments: the funds are limited but involve huge investments. Therefore it
is better to analyze the every possible scenario before investment as once a decision is
being taken or once the money is being invested; there is no option of reversing back the
decision.
Long run of the business: capital budgeting helps in reduction of costs as well as
determination of best maximum profit of the company. Since it helps in avoiding the over
or under investments, proper planning & analysis through capital budgeting helps in
sustainability of the business in the ling run (Shim and Siegel, 2008).
Various capital budgeting techniques includes:
Sensitivity Analysis: This is an analysis of determining the result of a decision using
different range of variables. The analyst determines the changes in dependent
variables due to different values of independent variables assuming certain conditions
to be constant. Its other name is what if analysis. Analysis could be made for any type
of decisions be it a family vacation or corporate level decisions. Its basic meaning is
determining the sensitivity in output because of variation in a particular ouput
keeping the other constant. (Hassani, 2016).
Following are the steps for conducting sensitivity analysis :
The base case output is defined; say NPV at a particular base case input value (V1) for
which the sensitivity is to be measured keeping all other inputs constant.
The value of output is being determined at a new value of input (say V2) keeping other
inputs same.
Then, the % change in output & the % change in the input is identified.
The method to calculate sensitivity is dividing the percentage change in output by
percentage change in input.
The conclusion is being arrived with the fact that higher the sensitivity figure is, the more
sensitive the output is to any change in that respective input and vice-versa.
Scenerio Analysis : This is a process of determining the 'expected value' of an investment
after a given period of time assuming certain differenced found in the values of key
factors such as interest rates,etc. As a technique, this analysis requires an analyst to
compute different reinvestment rates for expected returns that are invested again again
Paraphrase This Document
Need a fresh take? Get an instant paraphrase of this document with our AI Paraphraser
and again during a particular time period. This analysis basically determines the changes
in the values of the portfolio based on happening of different scenarios and follows the
principles of 'what if' analysis. This evaluation is used to determine the risk present
within a given amount of investment as related to a variety of potential events, ranging
from highest to lowest probabilities. An investor through this analysis determines the
level of risk that can be undertaken.
There are various approaches of it including the most common approach called standard
deviation of daily ot monthly security returns and then computing the expected value of the
portfolio if each security generates returns that are either two or three standard deviations above
or below the average returns (Holland and Torregrosa, 2008). Through this way, an analyst
determines the reasonable certainty regarding the changes in the portfolio's values at a particular
time period.
It is important to note here that the above two analysis are not the same. This can be better
understood with an example. For example, an equity analyst wants to conduct both sensitivity &
scenario analysis to consider the effect of earnings per share (EPS) on the company's relative
valuation by using price to earnings (P/E) multiple.
The sensitivity analysis depends on the variables affecting valuation, which can be depicted
using variables' price and EPS. Through this analysis, the range of all possible outcomes are
being recorded. While on the other hand, scenario analysis is being done by determining the
outcomes based on a scenario. The analyst has to determine a certain scenario such as market
crash or changes in regulations of the industry. He then uses different variables within that model
to suit that scenario. If all these factors are being put together, the analyst has a broad picture
including all range of outcomes, given all extremes, and an understanding of different outcomes
using different set of inputs characterized by real life scenarios (Khan and Jain, 2014).
Break Even Analysis : a point where the company is generating enough revenue so as to
cover all the expenses incurred during that accounting period is known as breakeven
point. By definition, the company's net income would br zero, that is, no profit no loss
(Saunders and Cornett, 2017). It is important to state that the company's payback period
isn't used to find the breakeven point as payback period is concerned with the number of
periods needed to pay back an initial investment, while the breakeven point is concerned
with the equalling of revenue and total costs with zero net income. This analysis shows
that how many sales it takes to pay off the costs of doing that business. Following two
points are to be considered :
Accounting breakeven analysis : An accounting breakeven happens with total revenue
equalling total costs,that is, profit is zero. This can be reached by computing the ratio of
variable cost to sales. For example, the ratio is 0.65 so this means that with every rupee of
a sales of each unit, contribution is.0.35 (Palepu, Healy and Peek, 2016). Thus, the
contribution margin ratio becomes 0.35. Breakeven point can therefore be calculated as :
BEP = (Fixed Cost + Depreciation) /Contribution Margin Ratio.
If we do not add the depreciation, the same BEP is called as cash break even point. The project
that reaches the breakeven point indicates that there are zero returns. Thus, only the investment
value will be recovered.
Financial breakeven analysis : An NPV breakeven occurs when the cash flows are
equivalent to the initial investments, that is, the NPV is zero. Thus, to arrive at breakeven
point, an analyst makes an analysis of reaching that level of sales where the NPV of the
project is zero.
Simulation Analysis : The term 'simulation' means an imitation of something or
pretending of some action. Monte Carlo Simulation is an analysis of imitation of some
real things or star of affairs or different processes that represents the key features of a
system using random numbers (Phillips, 2014). It basically adds the dimensions of
uncertain and moving analysis to capital budgeting as it involves building up of various
scenarios which are in accordance with the assumptions of the analyst. It considers the
interactions & the probabilities of changes in variables. This analysis involves following
steps :
The variables are to be identified that influence both cash inflows & outflows.
The formula is to be stated relating all the variables and then, a probability distribution
for each variable is to be determined.
Now, a computer programme is to be developed that randomly selects one value from the
probability distribution of each & every variable and determines the project's NPV using
such values.
The outcome in this regard is not a single value result but a probability distribution of all
the possible expected returns.
Simulation analysis is a significant tool to understand from the depth of the capital budgeting so
as ti enhance the investment decisions (Reilly and Brown, 2012). However, it is unable to deal
with the uncertainties. Also, such an analysis is not a remedy of all problems as overlooking of
important inter relationships between the variables can lead to wrong conclusions and misleading
outcomes.
Capital Budgeting techniques are important for corporate decision making but it has certain
limitation too. Some if them are listed below :
Since it has long term perspective therefore it cannot be used for short term implications.
Also, decisions taken on the basis of capital budgeting, if in case, turns out to be wrong,
can adversely affect the long term survival of the business. Also, it leads to increment in
operating expenses (Saltelli, Chan and Scott, 2008) .
⊘ This is a preview!⊘
Do you want full access?
Subscribe today to unlock all pages.
Trusted by 1+ million students worldwide

Inadequate & wrong investments makes it difficult for the business to make a proper
budget and the capital.
Such decisions includes large amount of funds and therefore, decisions are to br made
very carefully as once the decisions are taken, it cannot be modified.
budget and the capital.
Such decisions includes large amount of funds and therefore, decisions are to br made
very carefully as once the decisions are taken, it cannot be modified.
Paraphrase This Document
Need a fresh take? Get an instant paraphrase of this document with our AI Paraphraser

References:
Berman, K., Knight, J. and Case, J. (n.d.). Financial intelligence for HR professionals.
Bruner, R., Eades, K. and Schill, M. (2017). Case studies in finance. Dubuque, IA: McGraw-Hill
Education.
Clarke, R. and Clarke, R. (1990). Strategic financial management. Homewood, Ill.: R.D. Irwin.
Fairhurst, D. (2015). Using Excel for Business Analysis A Guide to Financial Modelling
Fundamenta. John Wiley & Sons.
Galbraith, J., Downey, D. and Kates, A. (2002). Designing dynamic organizations. New York:
AMACOM.
Hassani, B. (2016). Scenario analysis in risk management. Cham: Springer International
Publishing.
Holland, J. and Torregrosa, D. (2008). Capital budgeting. [Washington, D.C.]: Congress of the
U.S., Congressional Budget Office.
Khan, M. and Jain, P. (2014). Financial management. New Delhi: McGraw Hill Education.
Palepu, K., Healy, P. and Peek, E. (2016). Business analysis and valuation. Andover, Hampshire,
United Kingdom: Cengage Learning EMEA.
Phillips, J. (2014). Capm / pmp. New York: McGraw Hill.
Reilly, F. and Brown, K. (2012). Investment analysis & portfolio management. Mason, OH:
South-Western Cengage Learning.
Saltelli, A., Chan, K. and Scott, E. (2008). Sensitivity analysis. Chichester: John Wiley & Sons,
Ltd.
Saunders, A. and Cornett, M. (2017). Financial institutions management. New York: McGraw-
Hill Education.
Shim, J. and Siegel, J. (2008). Financial management. Hauppauge, N.Y.: Barron's Educational
Series.
Taylor, S. (2008). Modelling financial time series. New Jersey: World Scientific.
TULSIAN, B. (2016). TULSIAN'S FINANCIAL MANAGEMENT FOR CA-IPC (GROUP-I).
[S.l.]: S CHAND & CO LTD.
1 out of 8
Related Documents


Your All-in-One AI-Powered Toolkit for Academic Success.
+13062052269
info@desklib.com
Available 24*7 on WhatsApp / Email
![[object Object]](/_next/static/media/star-bottom.7253800d.svg)
Unlock your academic potential
Copyright © 2020–2026 A2Z Services. All Rights Reserved. Developed and managed by ZUCOL.