Capital Budgeting in Finance: Methods, Techniques, and Analysis Report
VerifiedAdded on 2020/02/19
|9
|2706
|105
Report
AI Summary
This report provides a comprehensive overview of capital budgeting, a crucial process in financial planning for companies. It explores the importance of capital budgeting, including its role in forecasting cash flows and setting long-term strategic goals. The report discusses various methods such as Net Present Value (NPV) and Internal Rate of Return (IRR), providing examples and calculations to illustrate their application. It also delves into the limitations of capital budgeting, such as ignoring non-quantifiable factors and the inherent uncertainty of future market conditions. Furthermore, the report examines techniques like sensitivity analysis, scenario analysis, breakeven analysis, and simulation analysis, explaining their functionalities and significance in financial decision-making. The report emphasizes the role of these techniques in assessing risk, understanding the impact of variable changes, and making informed investment choices.
CAPITAL BUDGETING
Paraphrase This Document
Need a fresh take? Get an instant paraphrase of this document with our AI Paraphraser
INTRODUCTION
Decisions are to be taken for many things in the company the matter can be major or minor.
The responsibility of decision making lies in the hands of the management. The management
is wholly responsible for the results of that decision making. Some of the examples where
decision making is required are acceptance or repentance of a special order, investment
decision, borrowing decision etc (Berman, Knight and Case, n.d.)..
We know that a company cannot survive without funds, whether small in nature or big.
Therefore, it is important to carry out proper financial planning. A company needs several
assets in order to grow, expand and earn profits but before investing in such asset it is
important to know whether it is worth funding cash for these or not. This decision can be
taken with the help of a method known as capital budgeting (Bruner, Eades and Schill, 2017).
Capital budgeting plays a major role in financial planning and therefore, it has its own
importance. The importance of capital budgeting are (TULSIAN, 2016)-
1. This process helps to forecast the future cash inflows and outflows of a company
which further helps to decide about the acceptance of a particular project.
2. The process of decision making is carried out at all the levels of the organisation and
this process begins when there is an idea of a new project till this project is concluded.
Hence, it is required at every time of the company’s working.
3. A company can grow, expand and compete well only when it has the ability to
develop long term strategic goals. However, capital budgeting is a process which is
helpful in setting these goals.
4. There are huge expenditures incurred in a company but it is always important to
monitor and analyse the benefits of spending funds, this becomes easier with the help
of the capital budgeting expenditure.
Capital budgeting is used by many companies as it is beneficial in taking long term
decisions. However, this process also has certain limitation which a company should
know before its adoption (Clarke and Clarke, 1990)-
1. Markets are dynamic in nature; therefore we can never now about the risk and
uncertainty that may arise. Capital budgeting ignore the risk element and the
uncertainty element (Fairhurst, 2015).
2. Capital budgeting takes into consideration certain financial factor, it complete ignore
the non quantifiable factor such as reputation of the company, employee morale etc.
3. There is no guarantee that the decision taken through this process will be correct
because capital budgeting is a process which takes future into consideration and no
one is capable enough to predict the future (Taylor, 2008).
4. The capital investment decisions can also be limited by urgency.
Capital budgeting involves various methods and techniques. Firstly, let us now
understand the method involved in capital budgeting-
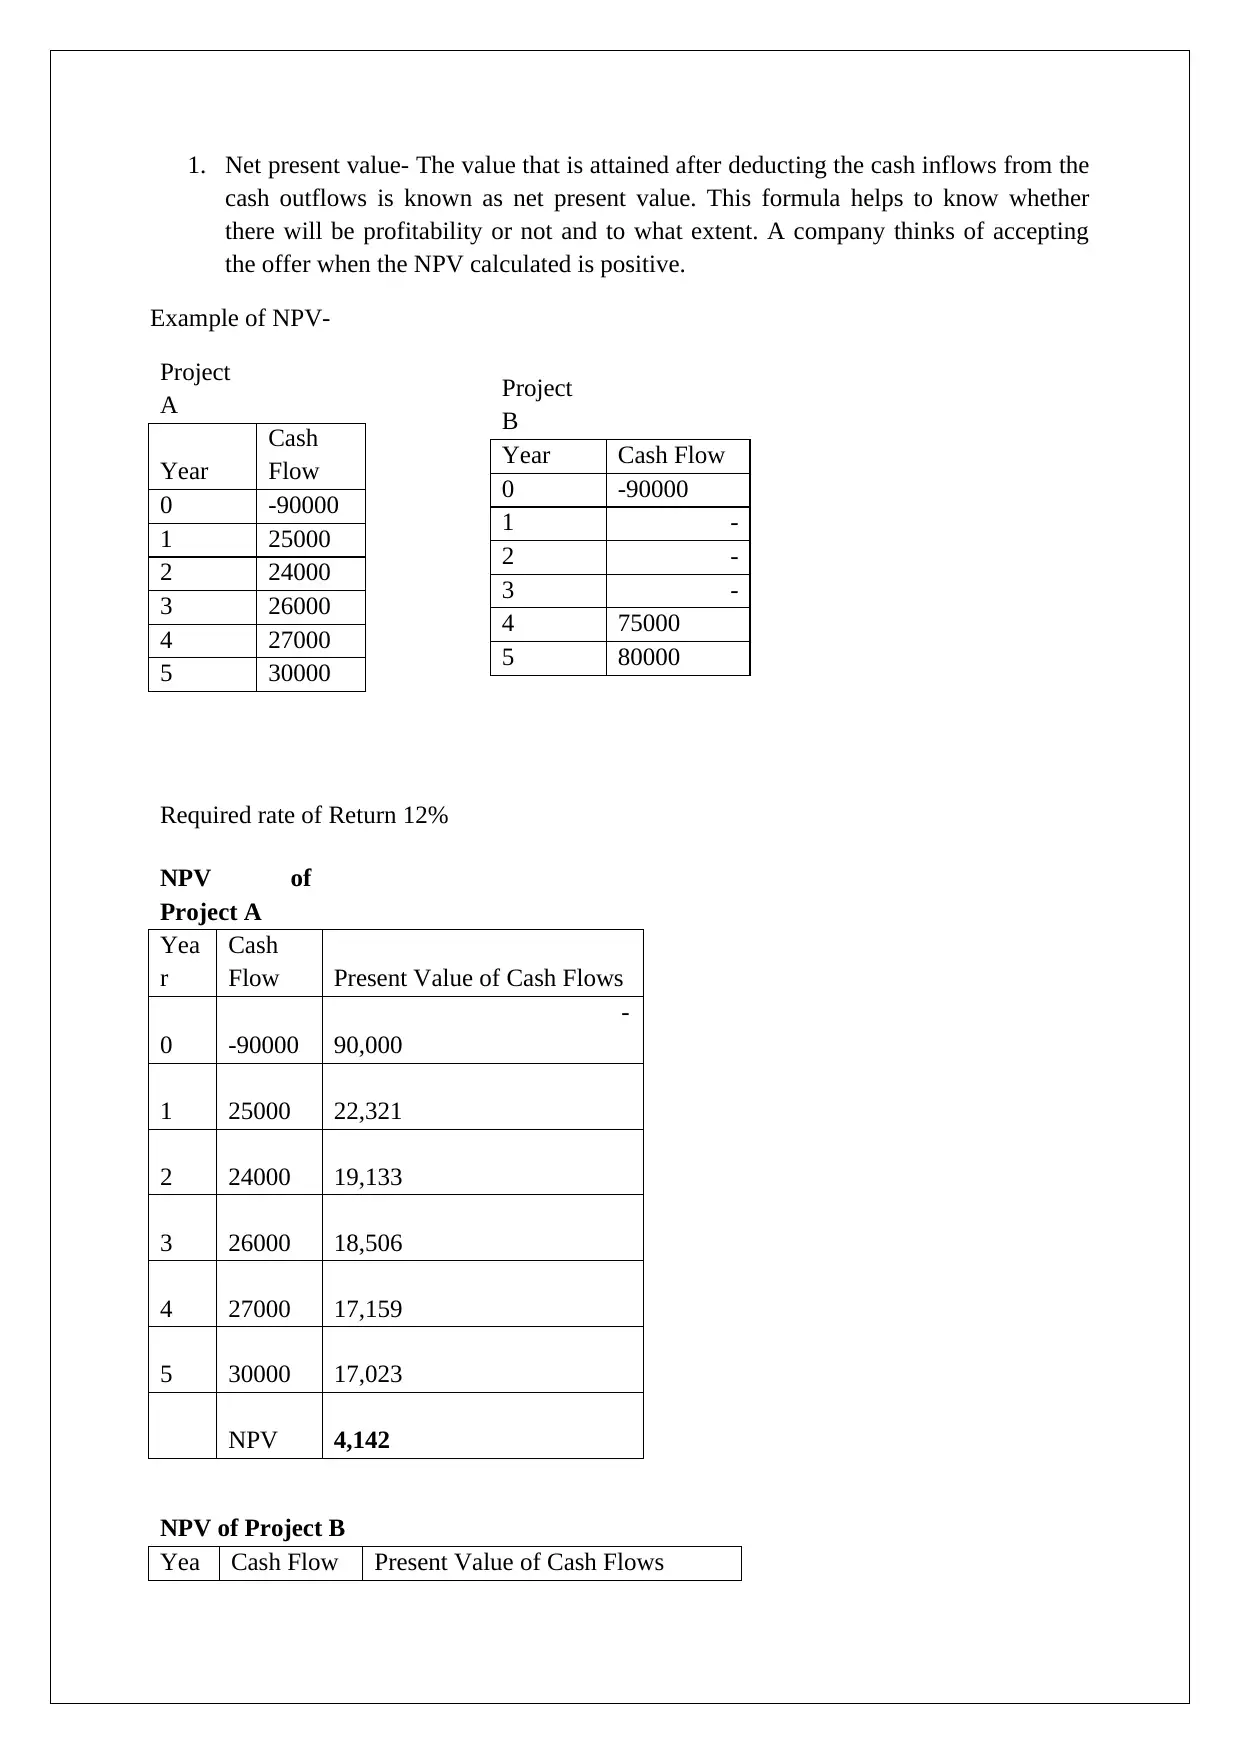
1. Net present value- The value that is attained after deducting the cash inflows from the
cash outflows is known as net present value. This formula helps to know whether
there will be profitability or not and to what extent. A company thinks of accepting
the offer when the NPV calculated is positive.
Example of NPV-
Project
A
Year
Cash
Flow
0 -90000
1 25000
2 24000
3 26000
4 27000
5 30000
Required rate of Return 12%
NPV of
Project A
Yea
r
Cash
Flow Present Value of Cash Flows
0 -90000
-
90,000
1 25000 22,321
2 24000 19,133
3 26000 18,506
4 27000 17,159
5 30000 17,023
NPV 4,142
NPV of Project B
Yea Cash Flow Present Value of Cash Flows
Project
B
Year Cash Flow
0 -90000
1 -
2 -
3 -
4 75000
5 80000
⊘ This is a preview!⊘
Do you want full access?
Subscribe today to unlock all pages.
Trusted by 1+ million students worldwide
r
0 -90000 -90000
1 - -
2 - -
3 - -
4 75000 47,664
5 80000 45,394
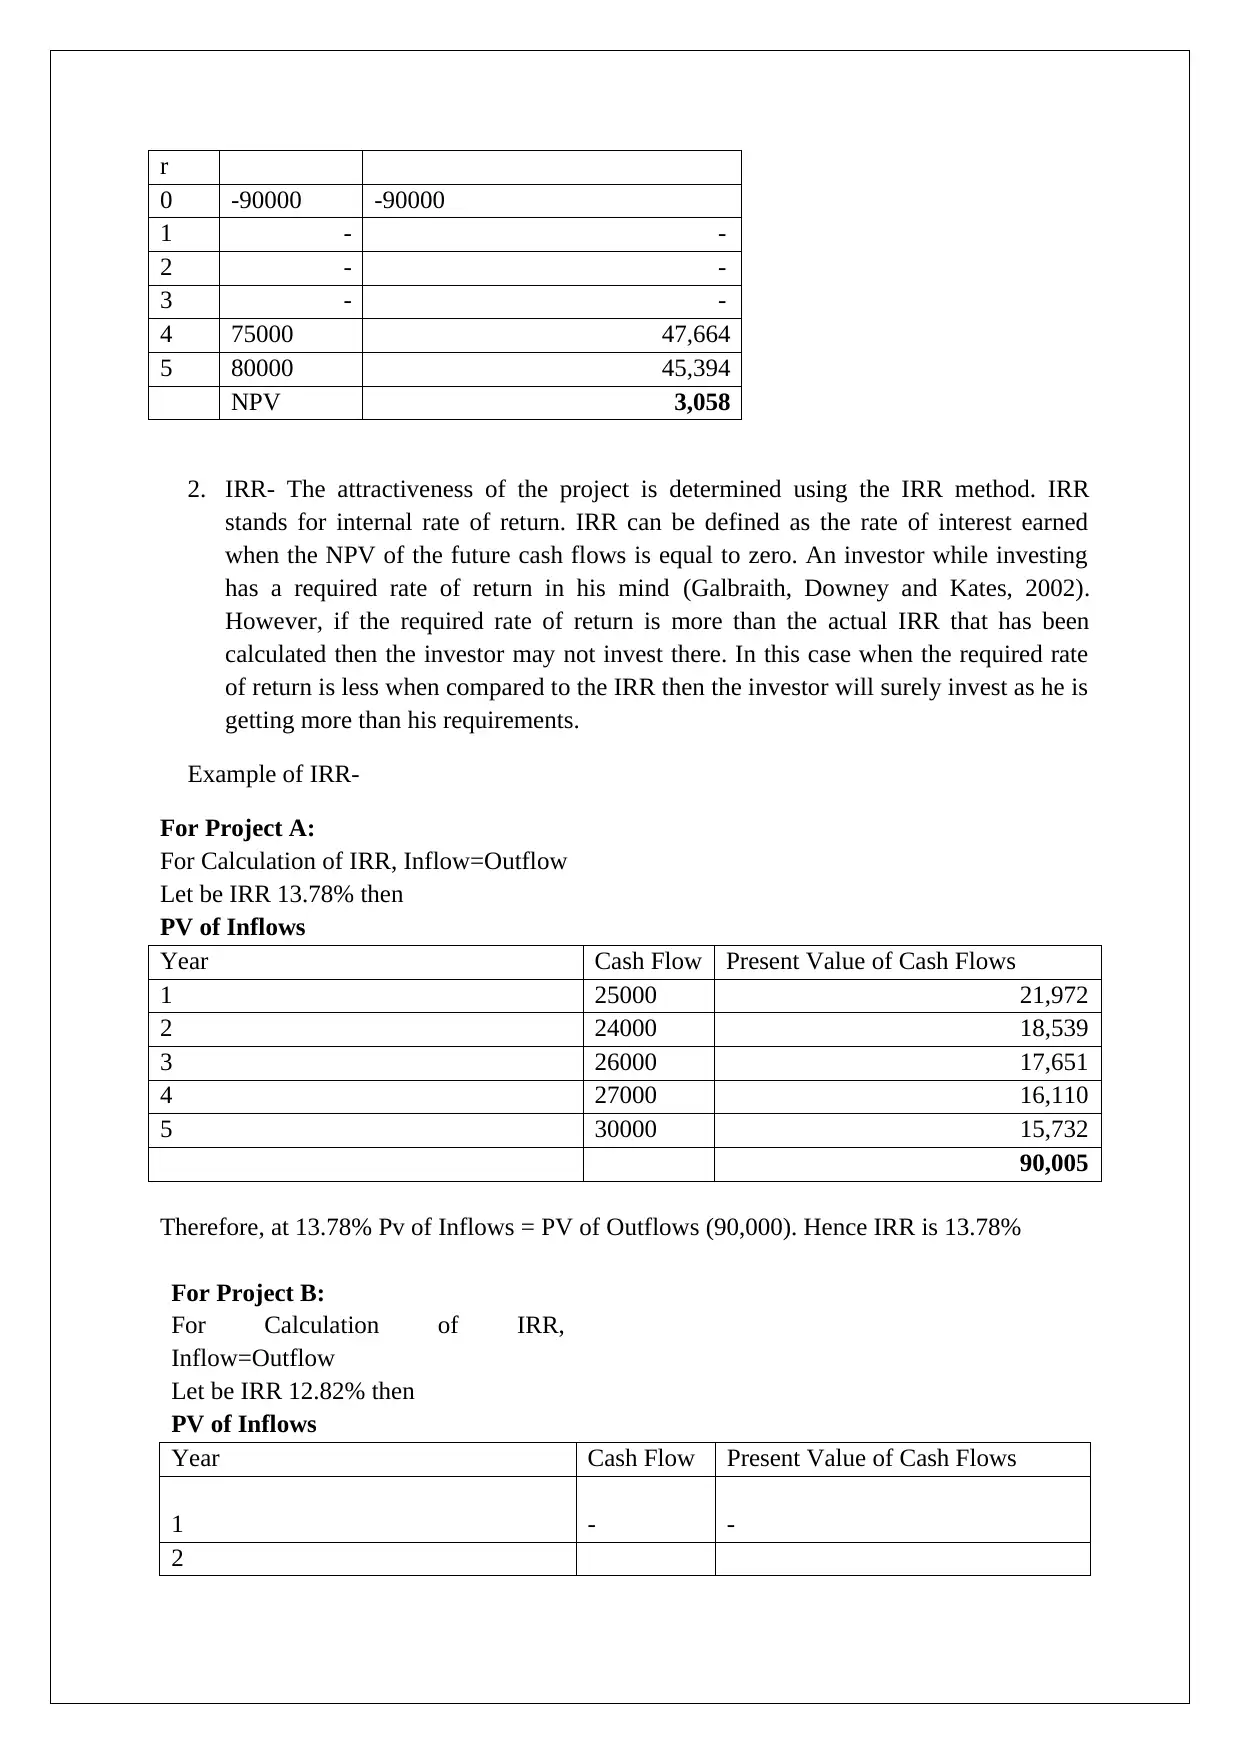
NPV 3,058
2. IRR- The attractiveness of the project is determined using the IRR method. IRR
stands for internal rate of return. IRR can be defined as the rate of interest earned
when the NPV of the future cash flows is equal to zero. An investor while investing
has a required rate of return in his mind (Galbraith, Downey and Kates, 2002).
However, if the required rate of return is more than the actual IRR that has been
calculated then the investor may not invest there. In this case when the required rate
of return is less when compared to the IRR then the investor will surely invest as he is
getting more than his requirements.
Example of IRR-
For Project A:
For Calculation of IRR, Inflow=Outflow
Let be IRR 13.78% then
PV of Inflows
Year Cash Flow Present Value of Cash Flows
1 25000 21,972
2 24000 18,539
3 26000 17,651
4 27000 16,110
5 30000 15,732
90,005
Therefore, at 13.78% Pv of Inflows = PV of Outflows (90,000). Hence IRR is 13.78%
For Project B:
For Calculation of IRR,
Inflow=Outflow
Let be IRR 12.82% then
PV of Inflows
Year Cash Flow Present Value of Cash Flows
1 - -
2
0 -90000 -90000
1 - -
2 - -
3 - -
4 75000 47,664
5 80000 45,394
NPV 3,058
2. IRR- The attractiveness of the project is determined using the IRR method. IRR
stands for internal rate of return. IRR can be defined as the rate of interest earned
when the NPV of the future cash flows is equal to zero. An investor while investing
has a required rate of return in his mind (Galbraith, Downey and Kates, 2002).
However, if the required rate of return is more than the actual IRR that has been
calculated then the investor may not invest there. In this case when the required rate
of return is less when compared to the IRR then the investor will surely invest as he is
getting more than his requirements.
Example of IRR-
For Project A:
For Calculation of IRR, Inflow=Outflow
Let be IRR 13.78% then
PV of Inflows
Year Cash Flow Present Value of Cash Flows
1 25000 21,972
2 24000 18,539
3 26000 17,651
4 27000 16,110
5 30000 15,732
90,005
Therefore, at 13.78% Pv of Inflows = PV of Outflows (90,000). Hence IRR is 13.78%
For Project B:
For Calculation of IRR,
Inflow=Outflow
Let be IRR 12.82% then
PV of Inflows
Year Cash Flow Present Value of Cash Flows
1 - -
2
Paraphrase This Document
Need a fresh take? Get an instant paraphrase of this document with our AI Paraphraser
- -
3 - -
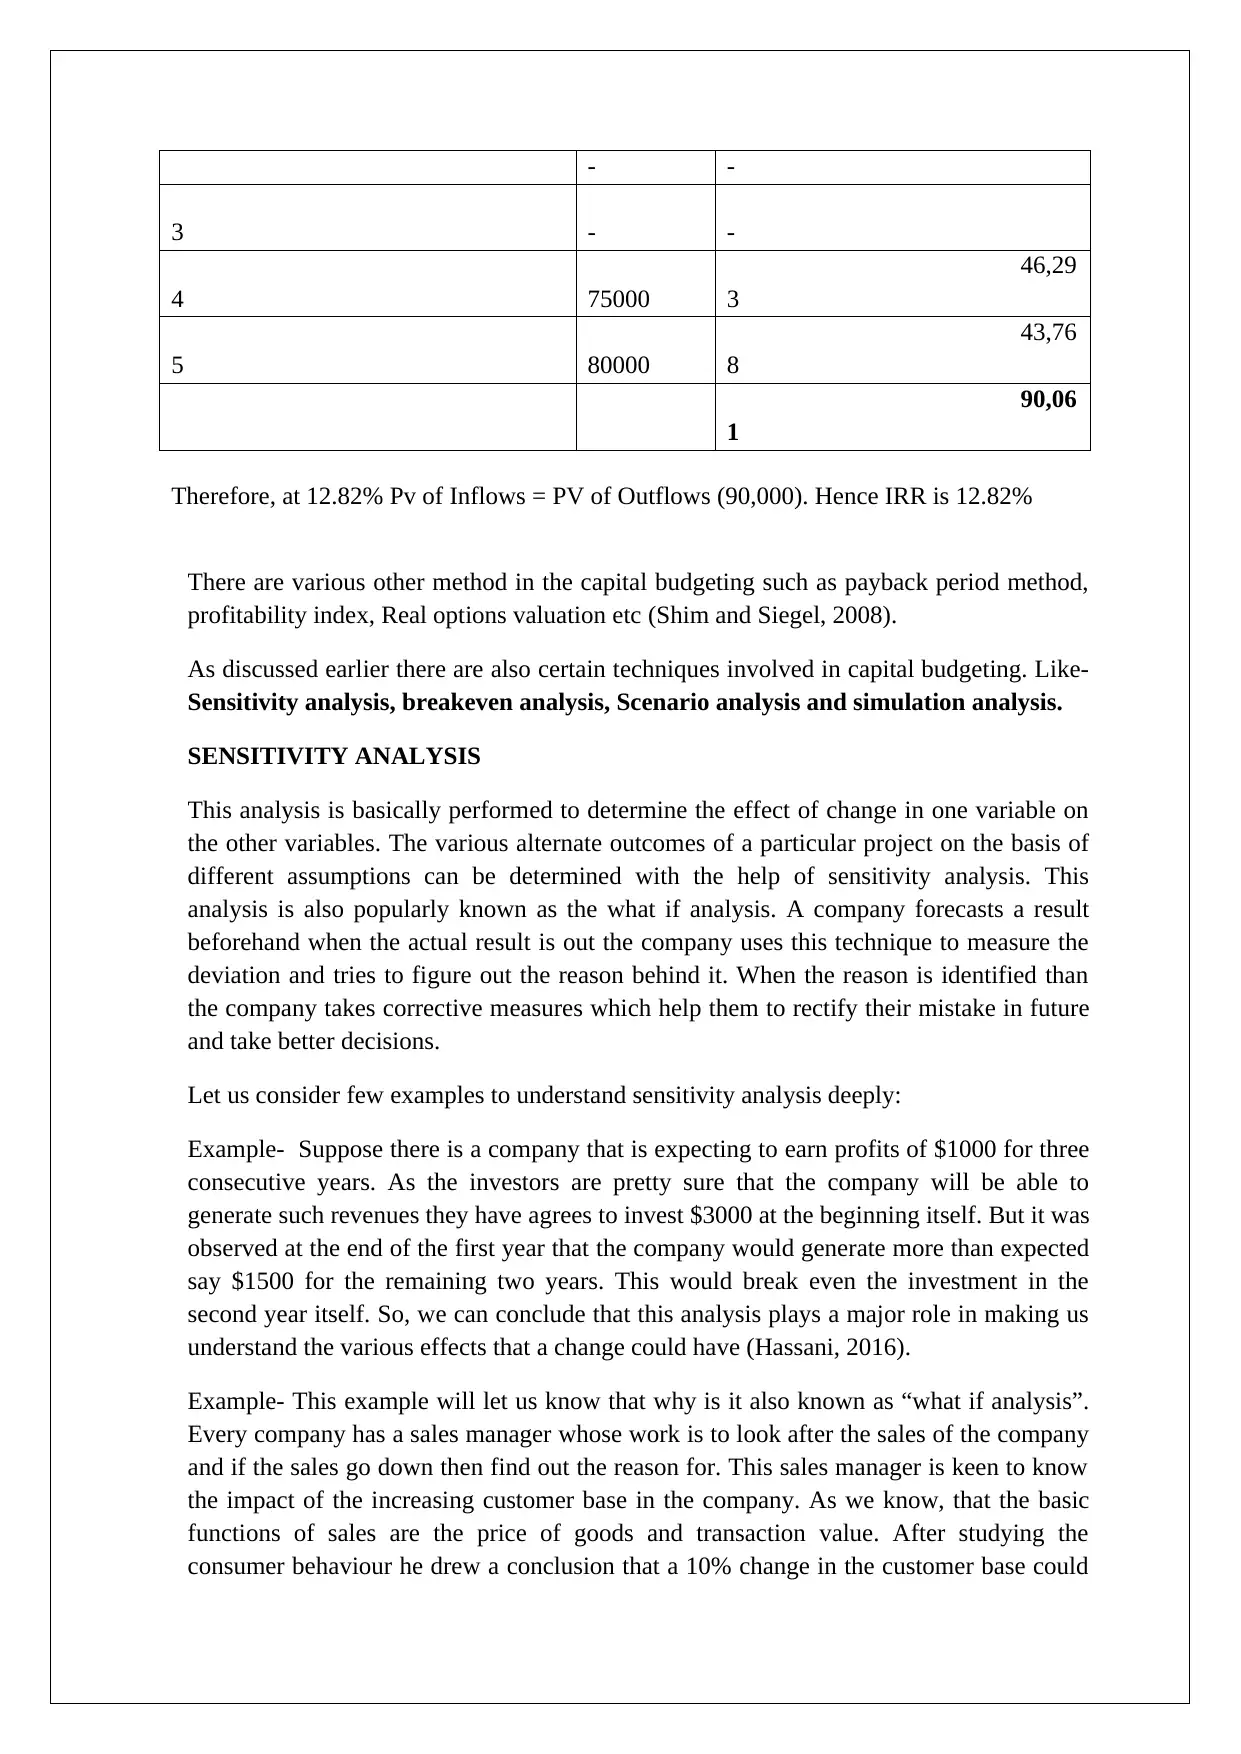
4 75000
46,29
3
5 80000
43,76
8
90,06
1
Therefore, at 12.82% Pv of Inflows = PV of Outflows (90,000). Hence IRR is 12.82%
There are various other method in the capital budgeting such as payback period method,
profitability index, Real options valuation etc (Shim and Siegel, 2008).
As discussed earlier there are also certain techniques involved in capital budgeting. Like-
Sensitivity analysis, breakeven analysis, Scenario analysis and simulation analysis.
SENSITIVITY ANALYSIS
This analysis is basically performed to determine the effect of change in one variable on
the other variables. The various alternate outcomes of a particular project on the basis of
different assumptions can be determined with the help of sensitivity analysis. This
analysis is also popularly known as the what if analysis. A company forecasts a result
beforehand when the actual result is out the company uses this technique to measure the
deviation and tries to figure out the reason behind it. When the reason is identified than
the company takes corrective measures which help them to rectify their mistake in future
and take better decisions.
Let us consider few examples to understand sensitivity analysis deeply:
Example- Suppose there is a company that is expecting to earn profits of $1000 for three
consecutive years. As the investors are pretty sure that the company will be able to
generate such revenues they have agrees to invest $3000 at the beginning itself. But it was
observed at the end of the first year that the company would generate more than expected
say $1500 for the remaining two years. This would break even the investment in the
second year itself. So, we can conclude that this analysis plays a major role in making us
understand the various effects that a change could have (Hassani, 2016).
Example- This example will let us know that why is it also known as “what if analysis”.
Every company has a sales manager whose work is to look after the sales of the company
and if the sales go down then find out the reason for. This sales manager is keen to know
the impact of the increasing customer base in the company. As we know, that the basic
functions of sales are the price of goods and transaction value. After studying the
consumer behaviour he drew a conclusion that a 10% change in the customer base could
3 - -
4 75000
46,29
3
5 80000
43,76
8
90,06
1
Therefore, at 12.82% Pv of Inflows = PV of Outflows (90,000). Hence IRR is 12.82%
There are various other method in the capital budgeting such as payback period method,
profitability index, Real options valuation etc (Shim and Siegel, 2008).
As discussed earlier there are also certain techniques involved in capital budgeting. Like-
Sensitivity analysis, breakeven analysis, Scenario analysis and simulation analysis.
SENSITIVITY ANALYSIS
This analysis is basically performed to determine the effect of change in one variable on
the other variables. The various alternate outcomes of a particular project on the basis of
different assumptions can be determined with the help of sensitivity analysis. This
analysis is also popularly known as the what if analysis. A company forecasts a result
beforehand when the actual result is out the company uses this technique to measure the
deviation and tries to figure out the reason behind it. When the reason is identified than
the company takes corrective measures which help them to rectify their mistake in future
and take better decisions.
Let us consider few examples to understand sensitivity analysis deeply:
Example- Suppose there is a company that is expecting to earn profits of $1000 for three
consecutive years. As the investors are pretty sure that the company will be able to
generate such revenues they have agrees to invest $3000 at the beginning itself. But it was
observed at the end of the first year that the company would generate more than expected
say $1500 for the remaining two years. This would break even the investment in the
second year itself. So, we can conclude that this analysis plays a major role in making us
understand the various effects that a change could have (Hassani, 2016).
Example- This example will let us know that why is it also known as “what if analysis”.
Every company has a sales manager whose work is to look after the sales of the company
and if the sales go down then find out the reason for. This sales manager is keen to know
the impact of the increasing customer base in the company. As we know, that the basic
functions of sales are the price of goods and transaction value. After studying the
consumer behaviour he drew a conclusion that a 10% change in the customer base could
increase the revenues of the company by 5%. So this question “what if the customer base
increases by 10% ? is resolved using this approach (Holland and Torregrosa, 2008).
SCENARIO ANALYSIS
It is a very known fact that we cannot predict the happenings keeping in mind the
dynamic and uncertain nature of the markets today. The analyst should always consider
this analysis as analytical tool. The analyst usually uses the words best case, base case
and worst case in order to explain the outcomes. It is well understood by the words itself
that the best case is the one in which all the things go in the way in which the analyst
thought it to be whereas the worst case is just the opposite of the best case. Anything that
has the highest probability is considered as the base case. It is the task of the analyst to
identify the risk and also prevent the worst case scenario. However, it is a fact that the
analysis cannot provide the exact situation but it provides a rough idea so that further
steps can be taken with utmost care (Khan and Jain, 2014).
We know that estimations are never accurate they always differ from the actual data. But
the analyst tries his best that his estimation falls close to the actual data. However, if there
are any confusions or uncertainties then the sensitivity analysis is not enough, it has to be
extended to scenario analysis (Saunders and Cornett, 2017). While performing scenario
analysis the analyst may use the sensitivity analysis also but there never arises situation
when an analyst requires scenario analysis information while carrying out sensitivity
analysis. Scenario analysis is basically done to analyse the uncertainties that may arise
and the impact of this uncertainty on a particular project. Scenario analysis and sensitivity
analysis goes hand in hand and are considered very vital part of the capital budgeting
process. These tools not only gives advise for the best investment plan but also saves
them from the dynamic nature and the risk involved in the market (Palepu, Healy and
Peek, 2016).
BREAKEVEN ANALYSIS
A company has to incur cost in order to manufacture and sell the product in the market.
Cost is included in the manufacturing process and even in the selling and distribution
process. These costs may be variable and fixed in nature. A company is said to earn
profits only when it has recovered the entire cost from customers. The level at which the
company only recovers the cost and does not have any profit or loss is known as the
breakeven point (Phillips, 2014). We can also say that the net income of the company will
be equal to zero in such a situation. There are two different formulas of breakeven point,
one helps to know about the breakeven point in units whereas the other gives the
breakeven point in term of volume of sale. A lower breakeven point is considered
beneficial for the company.
According to the accounting breakeven point, total cost will be equal to the total revenue
and net income will be equal to zero. The two formulas of breakeven point are shown
below (Reilly and Brown, 2012):
⊘ This is a preview!⊘
Do you want full access?
Subscribe today to unlock all pages.
Trusted by 1+ million students worldwide
Breakeven point (in units)= Fixed cost/ contribution per unit
Breakeven point (sales volume) = Fixed cost / Contribution margin
However, if the amount of depreciation is excluded from the fixed cost then we get the
cash breakeven point for the company.
In case of the financial breakeven analysis, the initial payment made towards the
investment is always equal to the future cash inflows and therefore, the NPV is zero,
Example-
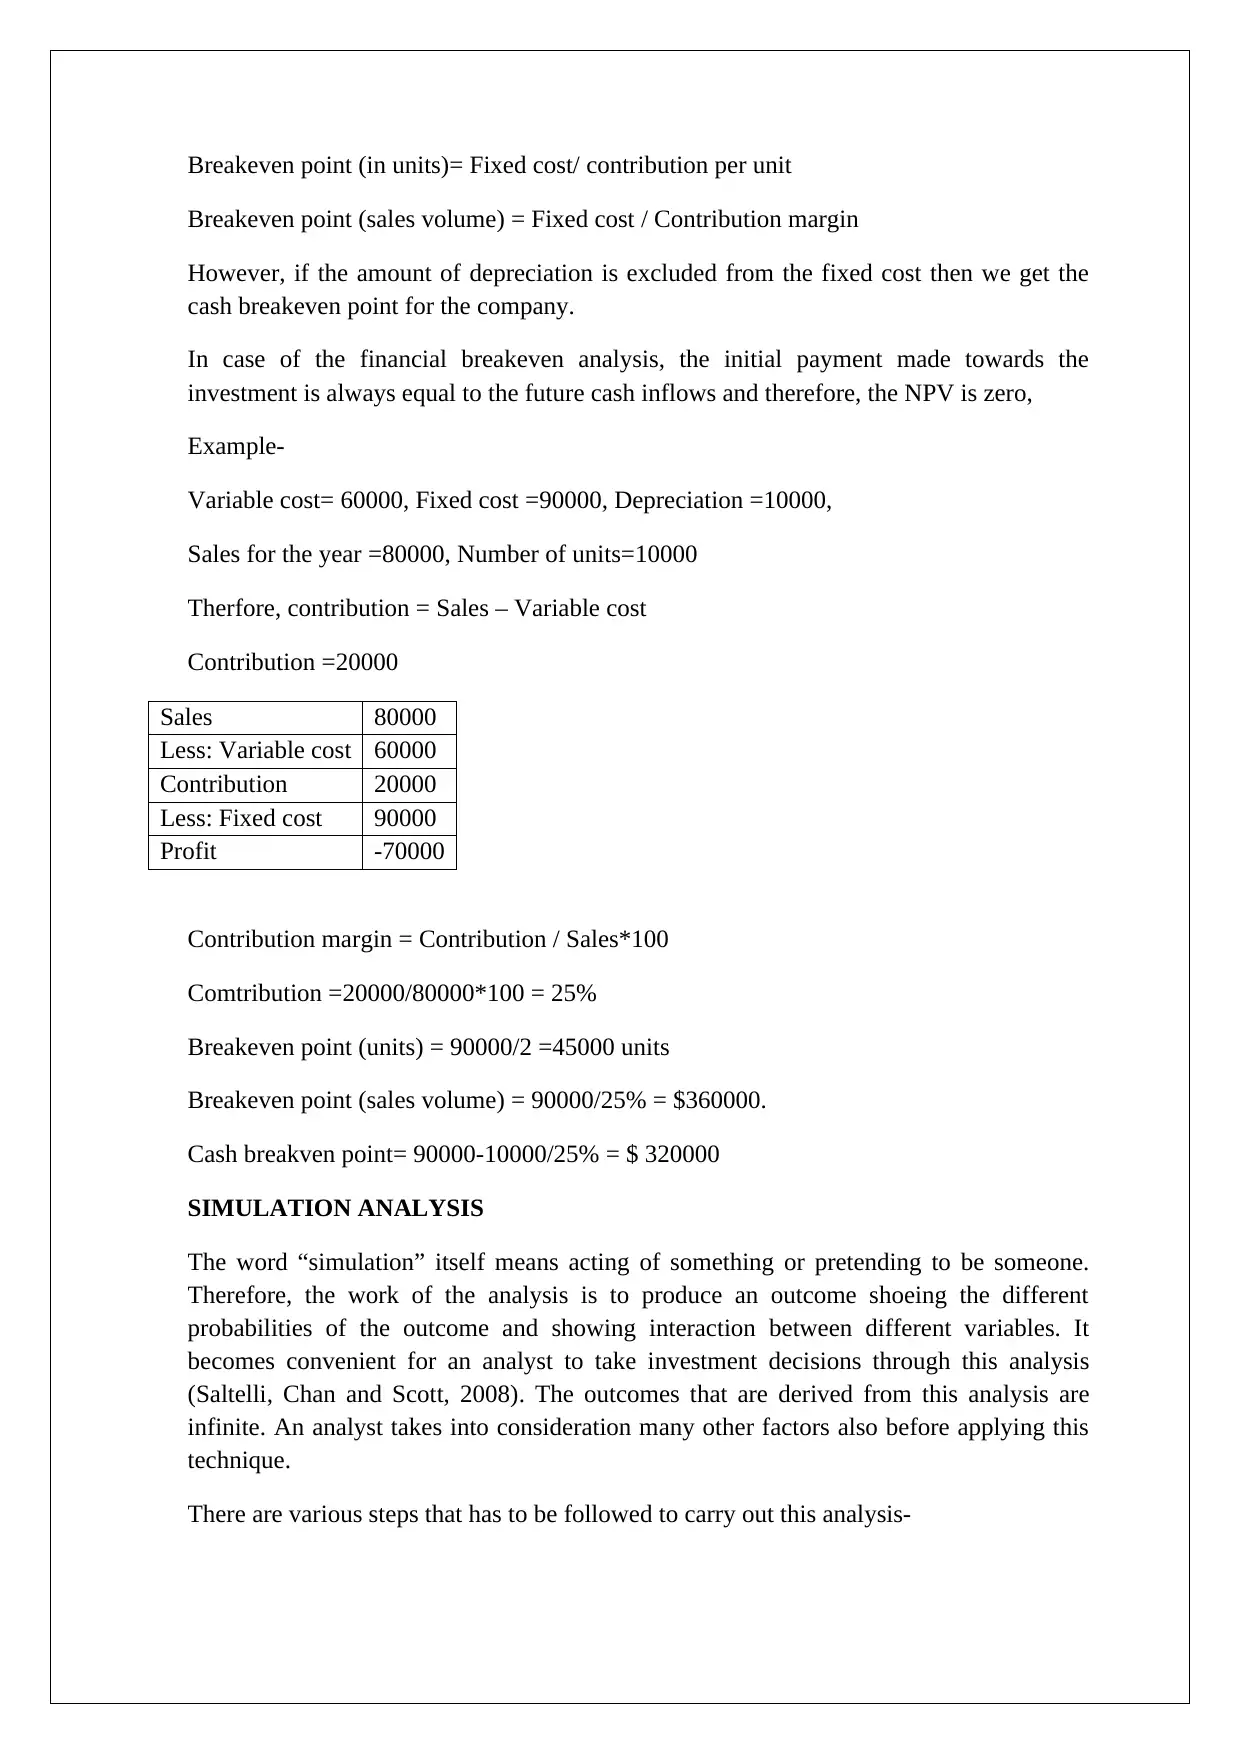
Variable cost= 60000, Fixed cost =90000, Depreciation =10000,
Sales for the year =80000, Number of units=10000
Therfore, contribution = Sales – Variable cost
Contribution =20000
Sales 80000
Less: Variable cost 60000
Contribution 20000
Less: Fixed cost 90000
Profit -70000
Contribution margin = Contribution / Sales*100
Comtribution =20000/80000*100 = 25%
Breakeven point (units) = 90000/2 =45000 units
Breakeven point (sales volume) = 90000/25% = $360000.
Cash breakven point= 90000-10000/25% = $ 320000
SIMULATION ANALYSIS
The word “simulation” itself means acting of something or pretending to be someone.
Therefore, the work of the analysis is to produce an outcome shoeing the different
probabilities of the outcome and showing interaction between different variables. It
becomes convenient for an analyst to take investment decisions through this analysis
(Saltelli, Chan and Scott, 2008). The outcomes that are derived from this analysis are
infinite. An analyst takes into consideration many other factors also before applying this
technique.
There are various steps that has to be followed to carry out this analysis-
Breakeven point (sales volume) = Fixed cost / Contribution margin
However, if the amount of depreciation is excluded from the fixed cost then we get the
cash breakeven point for the company.
In case of the financial breakeven analysis, the initial payment made towards the
investment is always equal to the future cash inflows and therefore, the NPV is zero,
Example-
Variable cost= 60000, Fixed cost =90000, Depreciation =10000,
Sales for the year =80000, Number of units=10000
Therfore, contribution = Sales – Variable cost
Contribution =20000
Sales 80000
Less: Variable cost 60000
Contribution 20000
Less: Fixed cost 90000
Profit -70000
Contribution margin = Contribution / Sales*100
Comtribution =20000/80000*100 = 25%
Breakeven point (units) = 90000/2 =45000 units
Breakeven point (sales volume) = 90000/25% = $360000.
Cash breakven point= 90000-10000/25% = $ 320000
SIMULATION ANALYSIS
The word “simulation” itself means acting of something or pretending to be someone.
Therefore, the work of the analysis is to produce an outcome shoeing the different
probabilities of the outcome and showing interaction between different variables. It
becomes convenient for an analyst to take investment decisions through this analysis
(Saltelli, Chan and Scott, 2008). The outcomes that are derived from this analysis are
infinite. An analyst takes into consideration many other factors also before applying this
technique.
There are various steps that has to be followed to carry out this analysis-
Paraphrase This Document
Need a fresh take? Get an instant paraphrase of this document with our AI Paraphraser

1. The first step is to analyse the relationship between the present value and the
parameters. As we know parameters are constant they act as a benchmark.
2. The probabilities are then assigned to the random variables depending on the
parameters.
3. Select any one variable randomly to which the probability has already been assigned.
4. Then the NPV should be calculated for the given set of variables.
5. Then NPV is calculated for the required outcomes. However, it is noticed that there is
not a particular outcome nut there are several outcomes.
All these four techniques are considered the most important part of the capital
budgeting process.

REFERENCES:
Berman, K., Knight, J. and Case, J. (n.d.). Financial intelligence for HR professionals.
Bruner, R., Eades, K. and Schill, M. (2017). Case studies in finance. Dubuque, IA: McGraw-
Hill Education.
Clarke, R. and Clarke, R. (1990). Strategic financial management. Homewood, Ill.: R.D.
Irwin.
Fairhurst, D. (2015). Using Excel for Business Analysis A Guide to Financial Modelling
Fundamenta. John Wiley & Sons.
Galbraith, J., Downey, D. and Kates, A. (2002). Designing dynamic organizations. New
York: AMACOM.
Hassani, B. (2016). Scenario analysis in risk management. Cham: Springer International
Publishing.
Holland, J. and Torregrosa, D. (2008). Capital budgeting. [Washington, D.C.]: Congress of
the U.S., Congressional Budget Office.
Khan, M. and Jain, P. (2014). Financial management. New Delhi: McGraw Hill Education.
Palepu, K., Healy, P. and Peek, E. (2016). Business analysis and valuation. Andover,
Hampshire, United Kingdom: Cengage Learning EMEA.
Phillips, J. (2014). Capm / pmp. New York: McGraw Hill.
Reilly, F. and Brown, K. (2012). Investment analysis & portfolio management. Mason, OH:
South-Western Cengage Learning.
Saltelli, A., Chan, K. and Scott, E. (2008). Sensitivity analysis. Chichester: John Wiley &
Sons, Ltd.
Saunders, A. and Cornett, M. (2017). Financial institutions management. New York:
McGraw-Hill Education.
Shim, J. and Siegel, J. (2008). Financial management. Hauppauge, N.Y.: Barron's
Educational Series.
Taylor, S. (2008). Modelling financial time series. New Jersey: World Scientific.
TULSIAN, B. (2016). TULSIAN'S FINANCIAL MANAGEMENT FOR CA-IPC (GROUP-I).
[S.l.]: S CHAND & CO LTD.
⊘ This is a preview!⊘
Do you want full access?
Subscribe today to unlock all pages.
Trusted by 1+ million students worldwide
1 out of 9
Related Documents


Your All-in-One AI-Powered Toolkit for Academic Success.
+13062052269
info@desklib.com
Available 24*7 on WhatsApp / Email
![[object Object]](/_next/static/media/star-bottom.7253800d.svg)
Unlock your academic potential
Copyright © 2020–2026 A2Z Services. All Rights Reserved. Developed and managed by ZUCOL.