Managerial Finance Report: Portfolio Analysis and Capital Budgeting
VerifiedAdded on 2020/02/03
|16
|4254
|64
Report
AI Summary
This report provides a comprehensive analysis of managerial finance, focusing on portfolio construction and capital investment appraisal. It begins by examining the financial performance of Tesco Plc and J. Sainsbury Plc, two major UK retail companies, using various financial ratios such as current ratio, quick ratio, gross margin, net profit margin, ROCE, gearing ratios, price/earnings ratio, EPS, dividend payout ratio, and inventory turnover. The analysis includes graphical presentations and recommendations for improving the performance of a poorly performing business. The report also delves into capital investment appraisal techniques, applying methods like payback period, net present value (NPV), and internal rate of return (IRR) to evaluate potential investment projects. It highlights the limitations of both financial ratio analysis and investment appraisal techniques, providing a balanced perspective on their application in financial decision-making. The report aims to assist a Chief Financial Officer in portfolio construction and to guide investment decisions for a manufacturing concern, Midway Limited (ML), by comparing different capital budgeting tools and project evaluations.

MANAGERIAL FINANCE
1
1
Paraphrase This Document
Need a fresh take? Get an instant paraphrase of this document with our AI Paraphraser

Table of Contents
INTRODUCTION................................................................................................................................3
QUESTION: 1 PORTFOLIO...............................................................................................................3
Calculation of ratio and its analysis through graphical presentation...............................................3
Recommendation to poorly performing business............................................................................7
Limitations of financial ratios..........................................................................................................8
QUESTION: 2 CAPITAL INVESTMENT APPRAISALS.................................................................9
Application of different investment appraisal techniques...............................................................9
Limitations of using investment appraisal techniques...................................................................12
CONCLUSION..................................................................................................................................13
REFERENCES...................................................................................................................................14
2

Table of figures
Figure 1 Calculation of cash flows from project A..............................................................................9
Figure 2 Calculation of cash flows from project B............................................................................10
Figure 3 Calculation of payback period.............................................................................................10
Figure 4 Calculation of net present value...........................................................................................11
Figure 5 Calculation of internal rate of return....................................................................................11
3
⊘ This is a preview!⊘
Do you want full access?
Subscribe today to unlock all pages.
Trusted by 1+ million students worldwide
INTRODUCTION
In the present times of wide market volatility and fierce level of competition, it becomes
essential for the establishments to manage their funds in an effective manner. The present project
highlights the financial performance analysis of two well-known retail stores of UK, Tesco Plc and
J. Sainsbury Plc. The central aim of evaluation and examination of both the company’s performance
is to suggest Ross Hill Ltd’s Chief Financial Officer for his portfolio construction. Moreover, many-
times, companies are also require to make investment in various capital projects like introduction of
new product, acquisition of advanced technology, upgraded machinery etc. Henceforth, the report
will apply different capital budgeting tools i.e. payback period, net present value and internal rate of
return to suggest Midway Limited (ML) about the best project.
QUESTION: 1 PORTFOLIO
Calculation of ratio and its analysis through graphical presentation
Ratio calculation attached in Appendix
Tesco Plc is one of the largest UK-based retail organizations that operate in 12 countries around
the world, but still, it generates around 86% of total turnover from UK. On the other side, J
Sainsbury is operating in the market through more than 1200 supermarkets and convenience stores.
Both the company’s financial performance has been analyzed here as under:
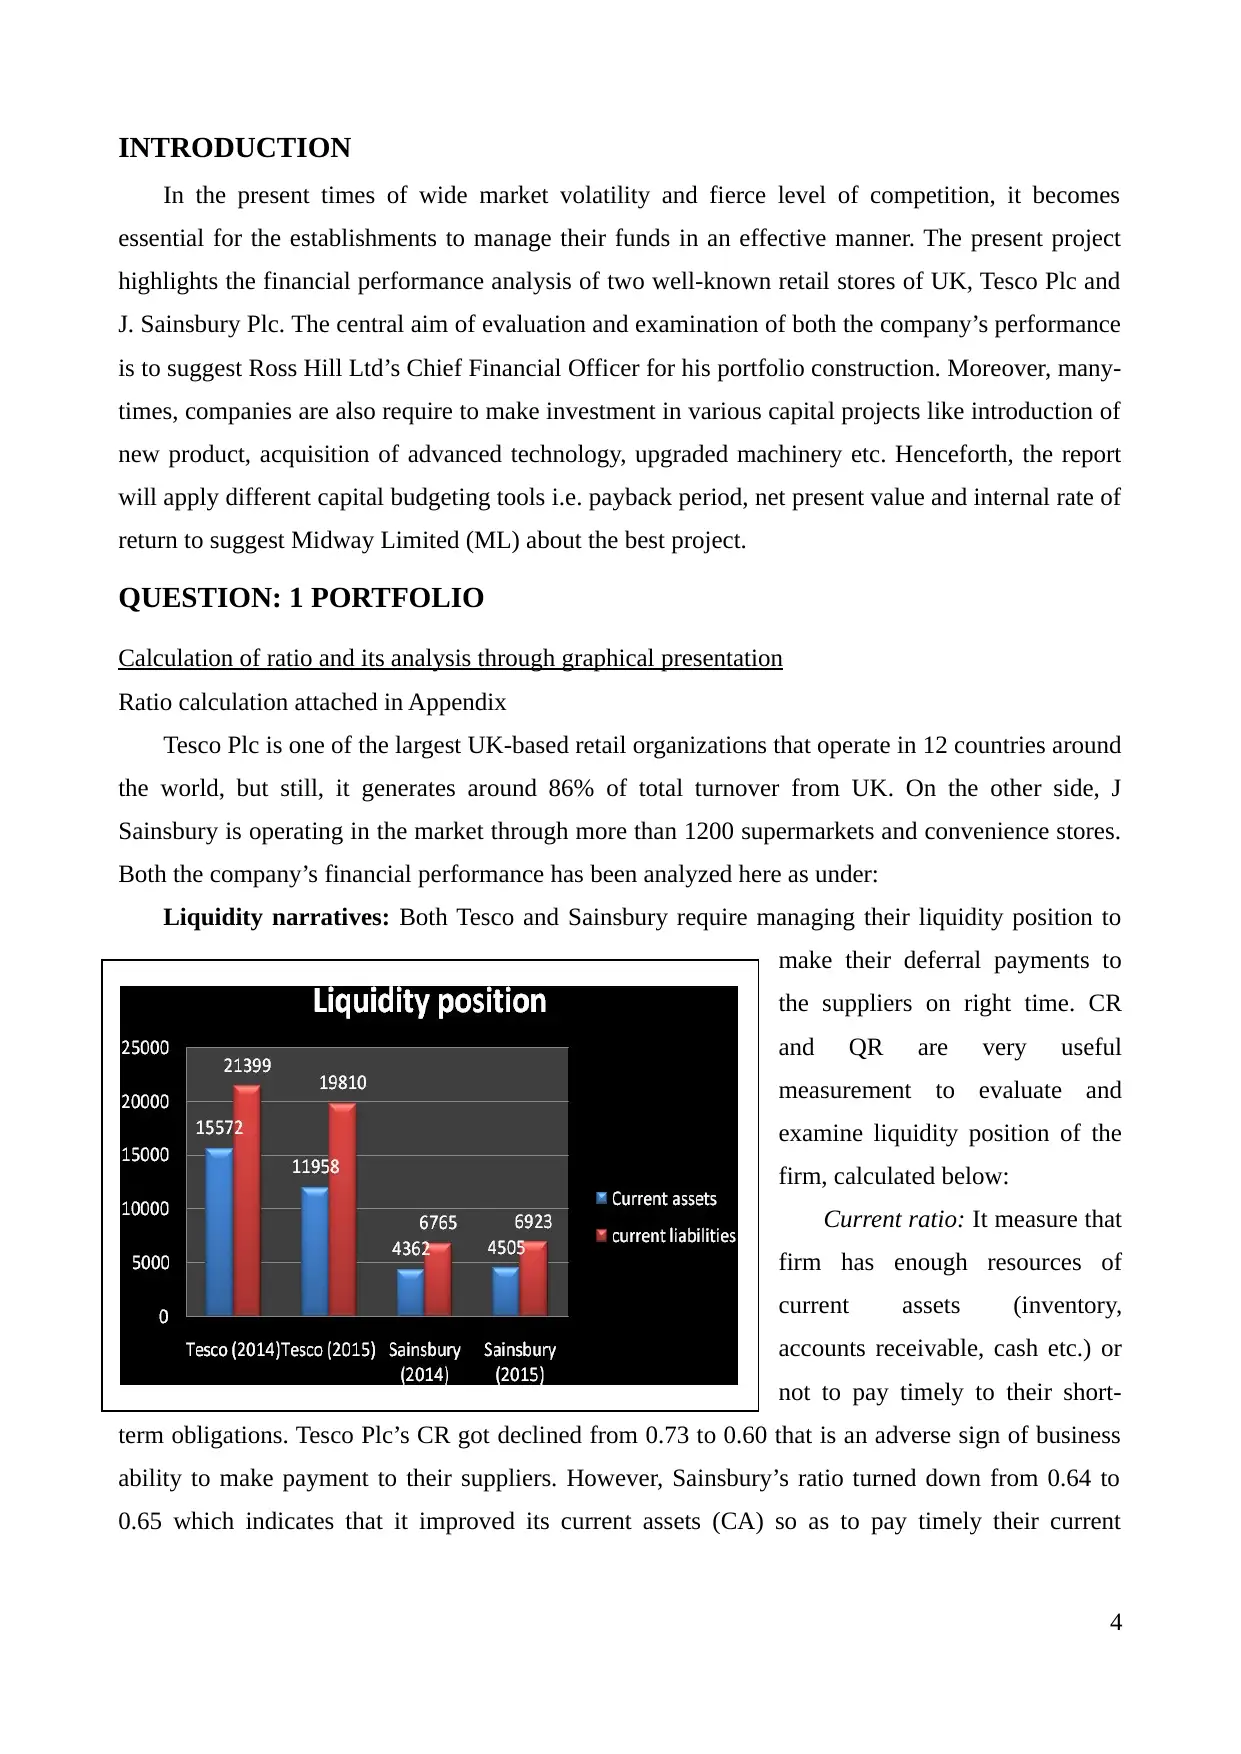
Liquidity narratives: Both Tesco and Sainsbury require managing their liquidity position to
make their deferral payments to
the suppliers on right time. CR
and QR are very useful
measurement to evaluate and
examine liquidity position of the
firm, calculated below:
Current ratio: It measure that
firm has enough resources of
current assets (inventory,
accounts receivable, cash etc.) or
not to pay timely to their short-
term obligations. Tesco Plc’s CR got declined from 0.73 to 0.60 that is an adverse sign of business
ability to make payment to their suppliers. However, Sainsbury’s ratio turned down from 0.64 to
0.65 which indicates that it improved its current assets (CA) so as to pay timely their current
4
In the present times of wide market volatility and fierce level of competition, it becomes
essential for the establishments to manage their funds in an effective manner. The present project
highlights the financial performance analysis of two well-known retail stores of UK, Tesco Plc and
J. Sainsbury Plc. The central aim of evaluation and examination of both the company’s performance
is to suggest Ross Hill Ltd’s Chief Financial Officer for his portfolio construction. Moreover, many-
times, companies are also require to make investment in various capital projects like introduction of
new product, acquisition of advanced technology, upgraded machinery etc. Henceforth, the report
will apply different capital budgeting tools i.e. payback period, net present value and internal rate of
return to suggest Midway Limited (ML) about the best project.
QUESTION: 1 PORTFOLIO
Calculation of ratio and its analysis through graphical presentation
Ratio calculation attached in Appendix
Tesco Plc is one of the largest UK-based retail organizations that operate in 12 countries around
the world, but still, it generates around 86% of total turnover from UK. On the other side, J
Sainsbury is operating in the market through more than 1200 supermarkets and convenience stores.
Both the company’s financial performance has been analyzed here as under:
Liquidity narratives: Both Tesco and Sainsbury require managing their liquidity position to
make their deferral payments to
the suppliers on right time. CR
and QR are very useful
measurement to evaluate and
examine liquidity position of the
firm, calculated below:
Current ratio: It measure that
firm has enough resources of
current assets (inventory,
accounts receivable, cash etc.) or
not to pay timely to their short-
term obligations. Tesco Plc’s CR got declined from 0.73 to 0.60 that is an adverse sign of business
ability to make payment to their suppliers. However, Sainsbury’s ratio turned down from 0.64 to
0.65 which indicates that it improved its current assets (CA) so as to pay timely their current
4
Paraphrase This Document
Need a fresh take? Get an instant paraphrase of this document with our AI Paraphraser
liabilities (CL) especially creditors. 2:1 is considered as idle industrial ratio thus, it becomes clear
that none of both these company has achieved target ratio to maintain their liquidity position.
Quick ratio: It measure liquidity position without taking into account closing inventory
balance. Tesco’s QR came down to 0.45 whereas Sainsbury’s ratio enhanced to 0.51 indicates that it
is comparatively more able to make deferral payments to suppliers on right time. Further, 1:1 is
considered as industrial benchmark, henceforth, it can be suggested to the both the companies to
maximize their CA and minimize their CL to achieve set standard.
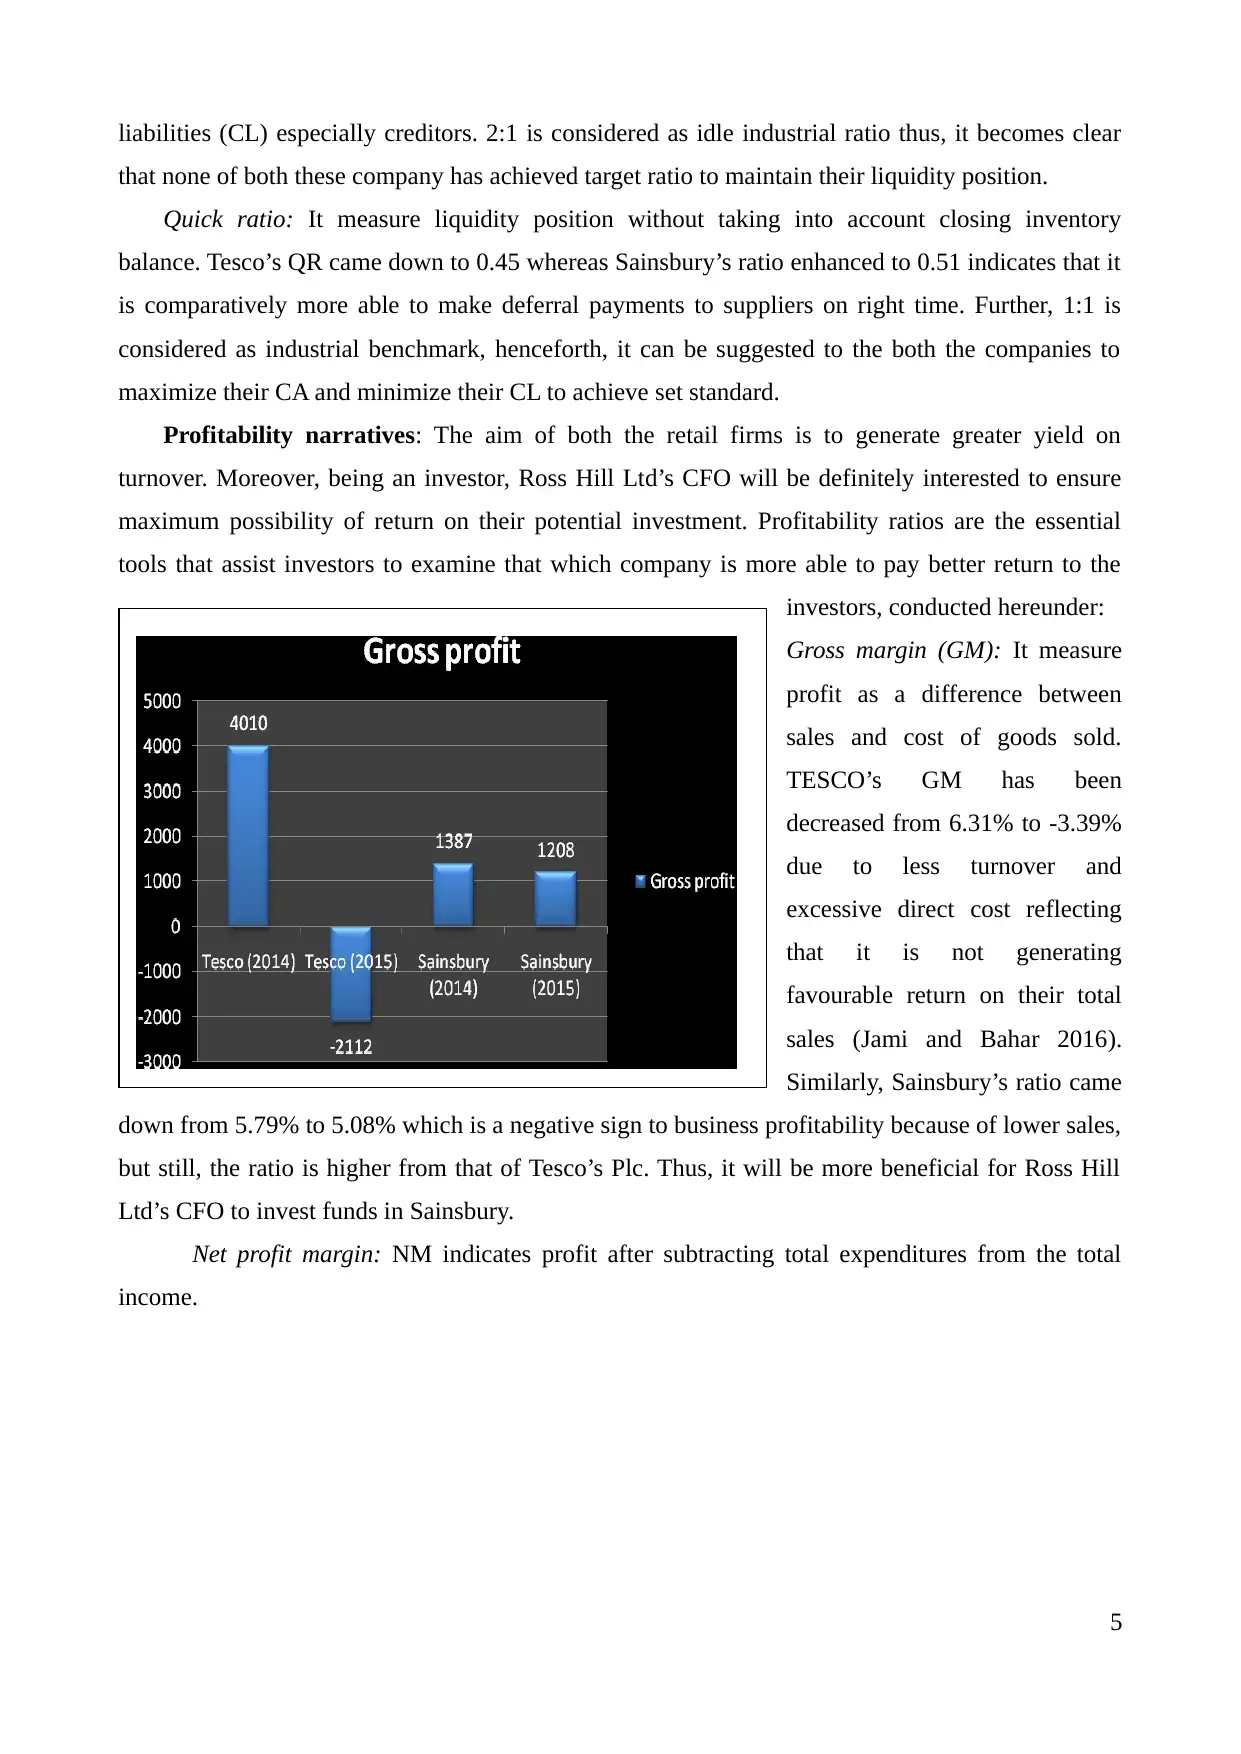
Profitability narratives: The aim of both the retail firms is to generate greater yield on
turnover. Moreover, being an investor, Ross Hill Ltd’s CFO will be definitely interested to ensure
maximum possibility of return on their potential investment. Profitability ratios are the essential
tools that assist investors to examine that which company is more able to pay better return to the
investors, conducted hereunder:
Gross margin (GM): It measure
profit as a difference between
sales and cost of goods sold.
TESCO’s GM has been
decreased from 6.31% to -3.39%
due to less turnover and
excessive direct cost reflecting
that it is not generating
favourable return on their total
sales (Jami and Bahar 2016).
Similarly, Sainsbury’s ratio came
down from 5.79% to 5.08% which is a negative sign to business profitability because of lower sales,
but still, the ratio is higher from that of Tesco’s Plc. Thus, it will be more beneficial for Ross Hill
Ltd’s CFO to invest funds in Sainsbury.
Net profit margin: NM indicates profit after subtracting total expenditures from the total
income.
5
that none of both these company has achieved target ratio to maintain their liquidity position.
Quick ratio: It measure liquidity position without taking into account closing inventory
balance. Tesco’s QR came down to 0.45 whereas Sainsbury’s ratio enhanced to 0.51 indicates that it
is comparatively more able to make deferral payments to suppliers on right time. Further, 1:1 is
considered as industrial benchmark, henceforth, it can be suggested to the both the companies to
maximize their CA and minimize their CL to achieve set standard.
Profitability narratives: The aim of both the retail firms is to generate greater yield on
turnover. Moreover, being an investor, Ross Hill Ltd’s CFO will be definitely interested to ensure
maximum possibility of return on their potential investment. Profitability ratios are the essential
tools that assist investors to examine that which company is more able to pay better return to the
investors, conducted hereunder:
Gross margin (GM): It measure
profit as a difference between
sales and cost of goods sold.
TESCO’s GM has been
decreased from 6.31% to -3.39%
due to less turnover and
excessive direct cost reflecting
that it is not generating
favourable return on their total
sales (Jami and Bahar 2016).
Similarly, Sainsbury’s ratio came
down from 5.79% to 5.08% which is a negative sign to business profitability because of lower sales,
but still, the ratio is higher from that of Tesco’s Plc. Thus, it will be more beneficial for Ross Hill
Ltd’s CFO to invest funds in Sainsbury.
Net profit margin: NM indicates profit after subtracting total expenditures from the total
income.
5
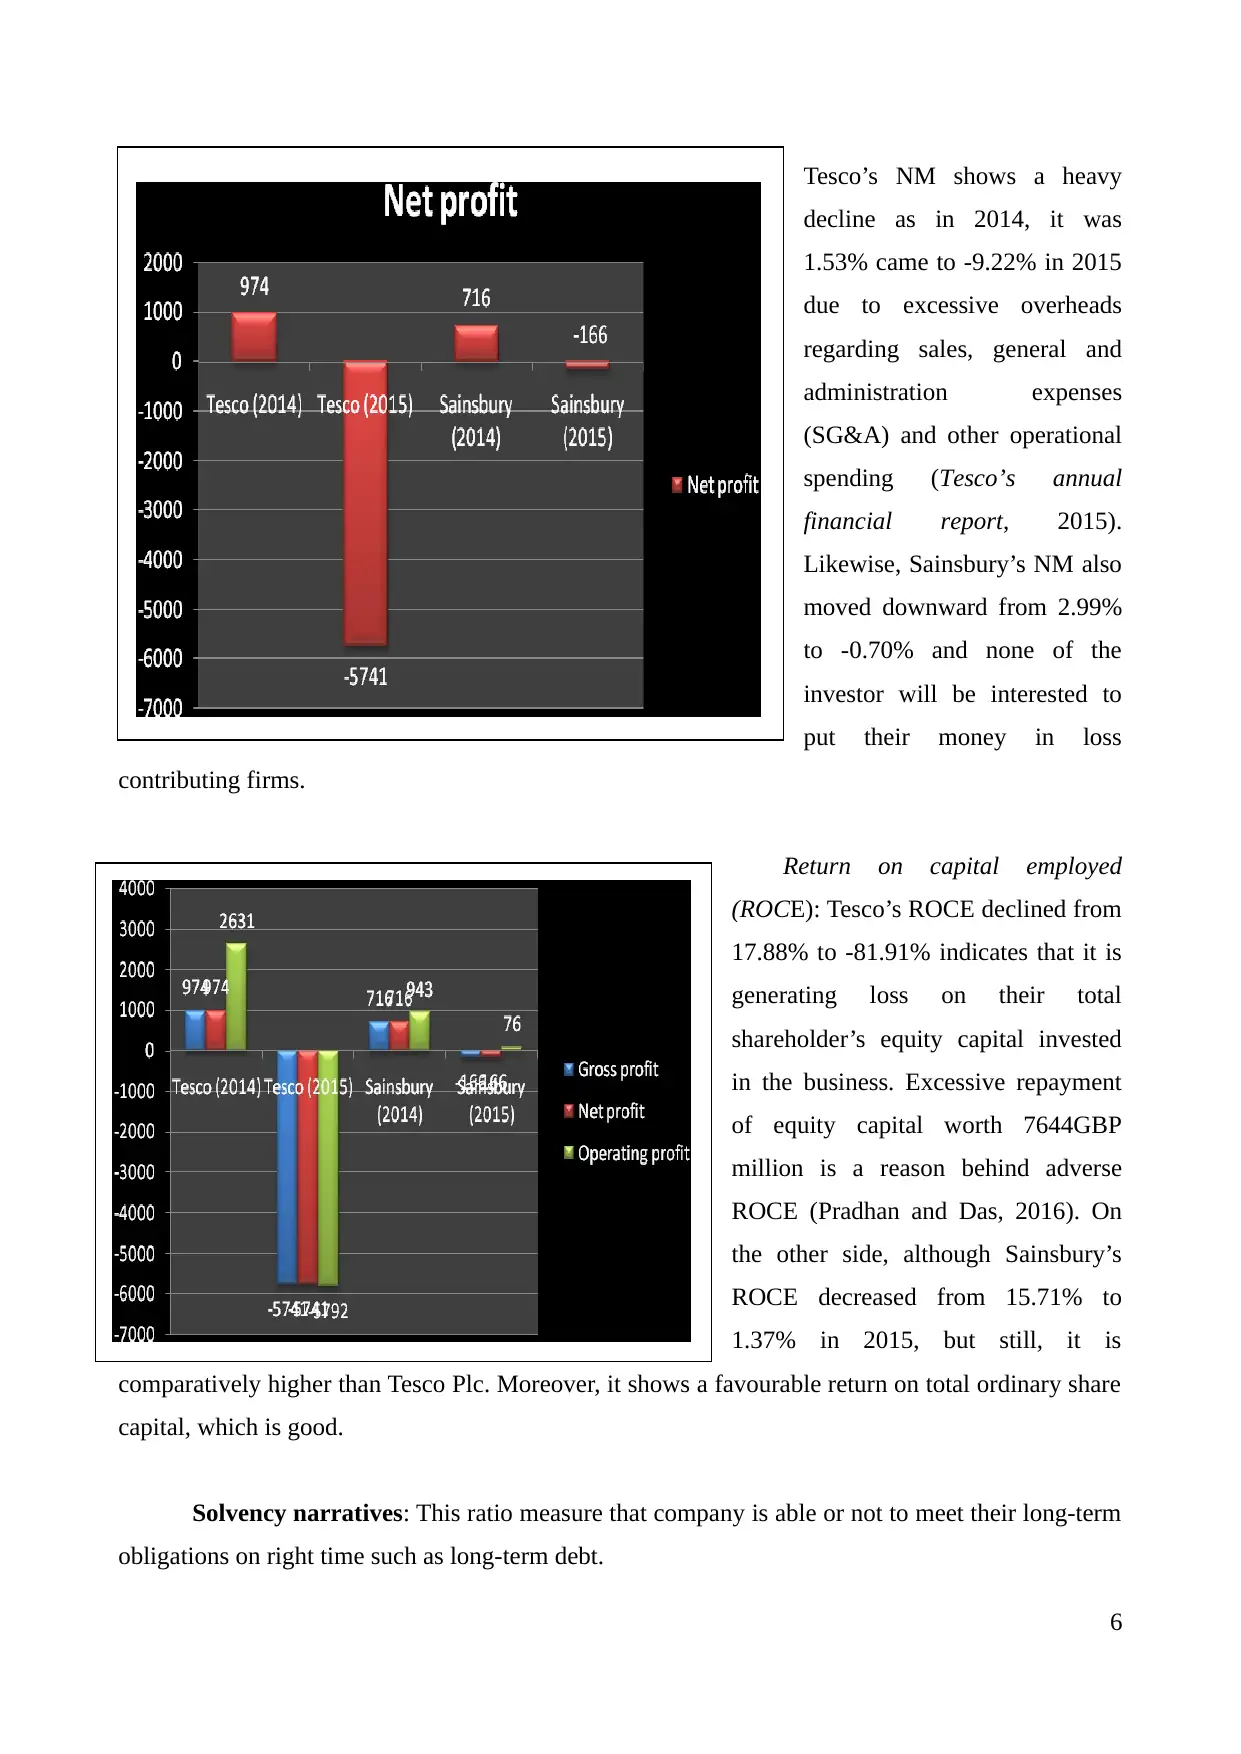
Tesco’s NM shows a heavy
decline as in 2014, it was
1.53% came to -9.22% in 2015
due to excessive overheads
regarding sales, general and
administration expenses
(SG&A) and other operational
spending (Tesco’s annual
financial report, 2015).
Likewise, Sainsbury’s NM also
moved downward from 2.99%
to -0.70% and none of the
investor will be interested to
put their money in loss
contributing firms.
Return on capital employed
(ROCE): Tesco’s ROCE declined from
17.88% to -81.91% indicates that it is
generating loss on their total
shareholder’s equity capital invested
in the business. Excessive repayment
of equity capital worth 7644GBP
million is a reason behind adverse
ROCE (Pradhan and Das, 2016). On
the other side, although Sainsbury’s
ROCE decreased from 15.71% to
1.37% in 2015, but still, it is
comparatively higher than Tesco Plc. Moreover, it shows a favourable return on total ordinary share
capital, which is good.
Solvency narratives: This ratio measure that company is able or not to meet their long-term
obligations on right time such as long-term debt.
6
⊘ This is a preview!⊘
Do you want full access?
Subscribe today to unlock all pages.
Trusted by 1+ million students worldwide
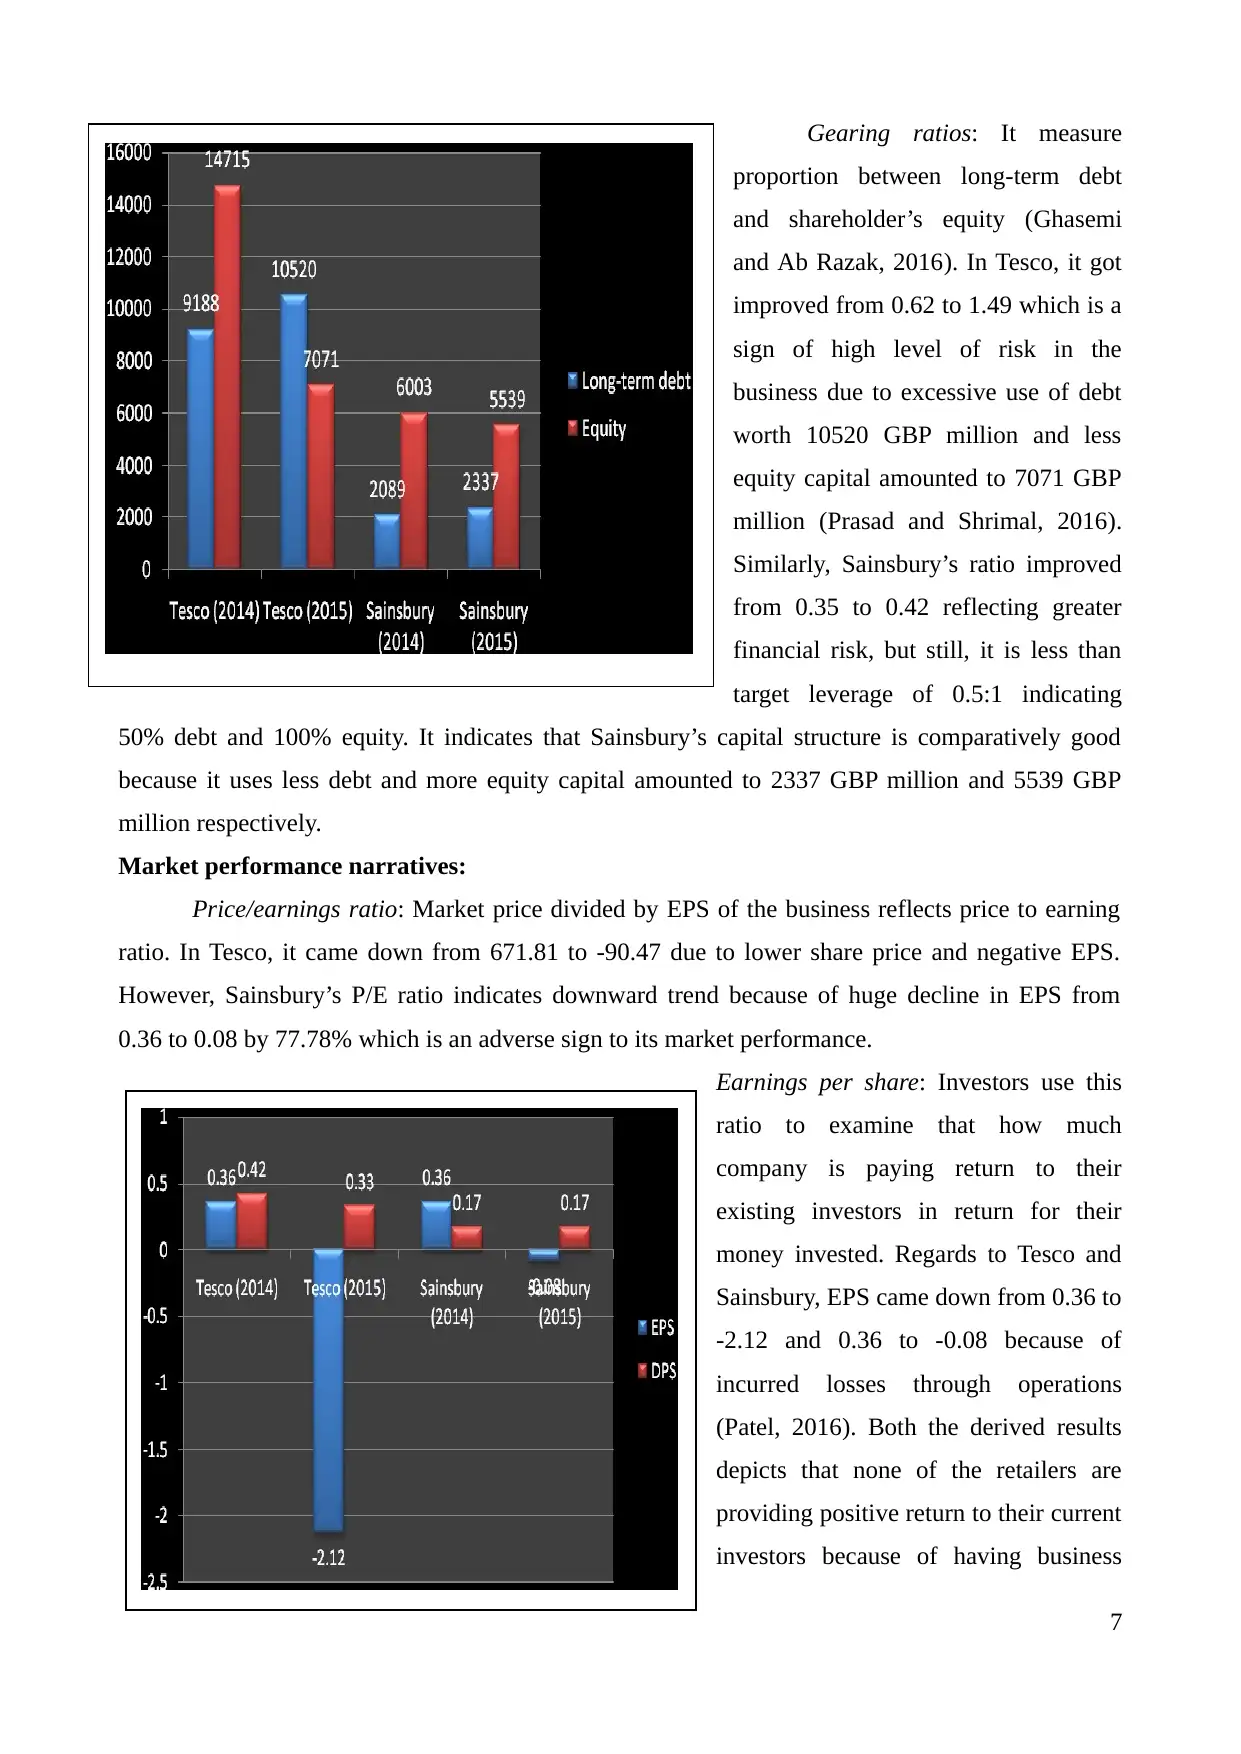
Gearing ratios: It measure
proportion between long-term debt
and shareholder’s equity (Ghasemi
and Ab Razak, 2016). In Tesco, it got
improved from 0.62 to 1.49 which is a
sign of high level of risk in the
business due to excessive use of debt
worth 10520 GBP million and less
equity capital amounted to 7071 GBP
million (Prasad and Shrimal, 2016).
Similarly, Sainsbury’s ratio improved
from 0.35 to 0.42 reflecting greater
financial risk, but still, it is less than
target leverage of 0.5:1 indicating
50% debt and 100% equity. It indicates that Sainsbury’s capital structure is comparatively good
because it uses less debt and more equity capital amounted to 2337 GBP million and 5539 GBP
million respectively.
Market performance narratives:
Price/earnings ratio: Market price divided by EPS of the business reflects price to earning
ratio. In Tesco, it came down from 671.81 to -90.47 due to lower share price and negative EPS.
However, Sainsbury’s P/E ratio indicates downward trend because of huge decline in EPS from
0.36 to 0.08 by 77.78% which is an adverse sign to its market performance.
Earnings per share: Investors use this
ratio to examine that how much
company is paying return to their
existing investors in return for their
money invested. Regards to Tesco and
Sainsbury, EPS came down from 0.36 to
-2.12 and 0.36 to -0.08 because of
incurred losses through operations
(Patel, 2016). Both the derived results
depicts that none of the retailers are
providing positive return to their current
investors because of having business
7
Paraphrase This Document
Need a fresh take? Get an instant paraphrase of this document with our AI Paraphraser
losses.
Dividend payout ratio: Tesco Plc’s dividend payout ratio got decreased from 116.67 to -
15.57% in 2015 whilst Sainsbury’s ratio got decreased came down from 47.22% to -212.50%. Less
DPS to 0.17 is the main reason behind lower DPR in Sainsbury.
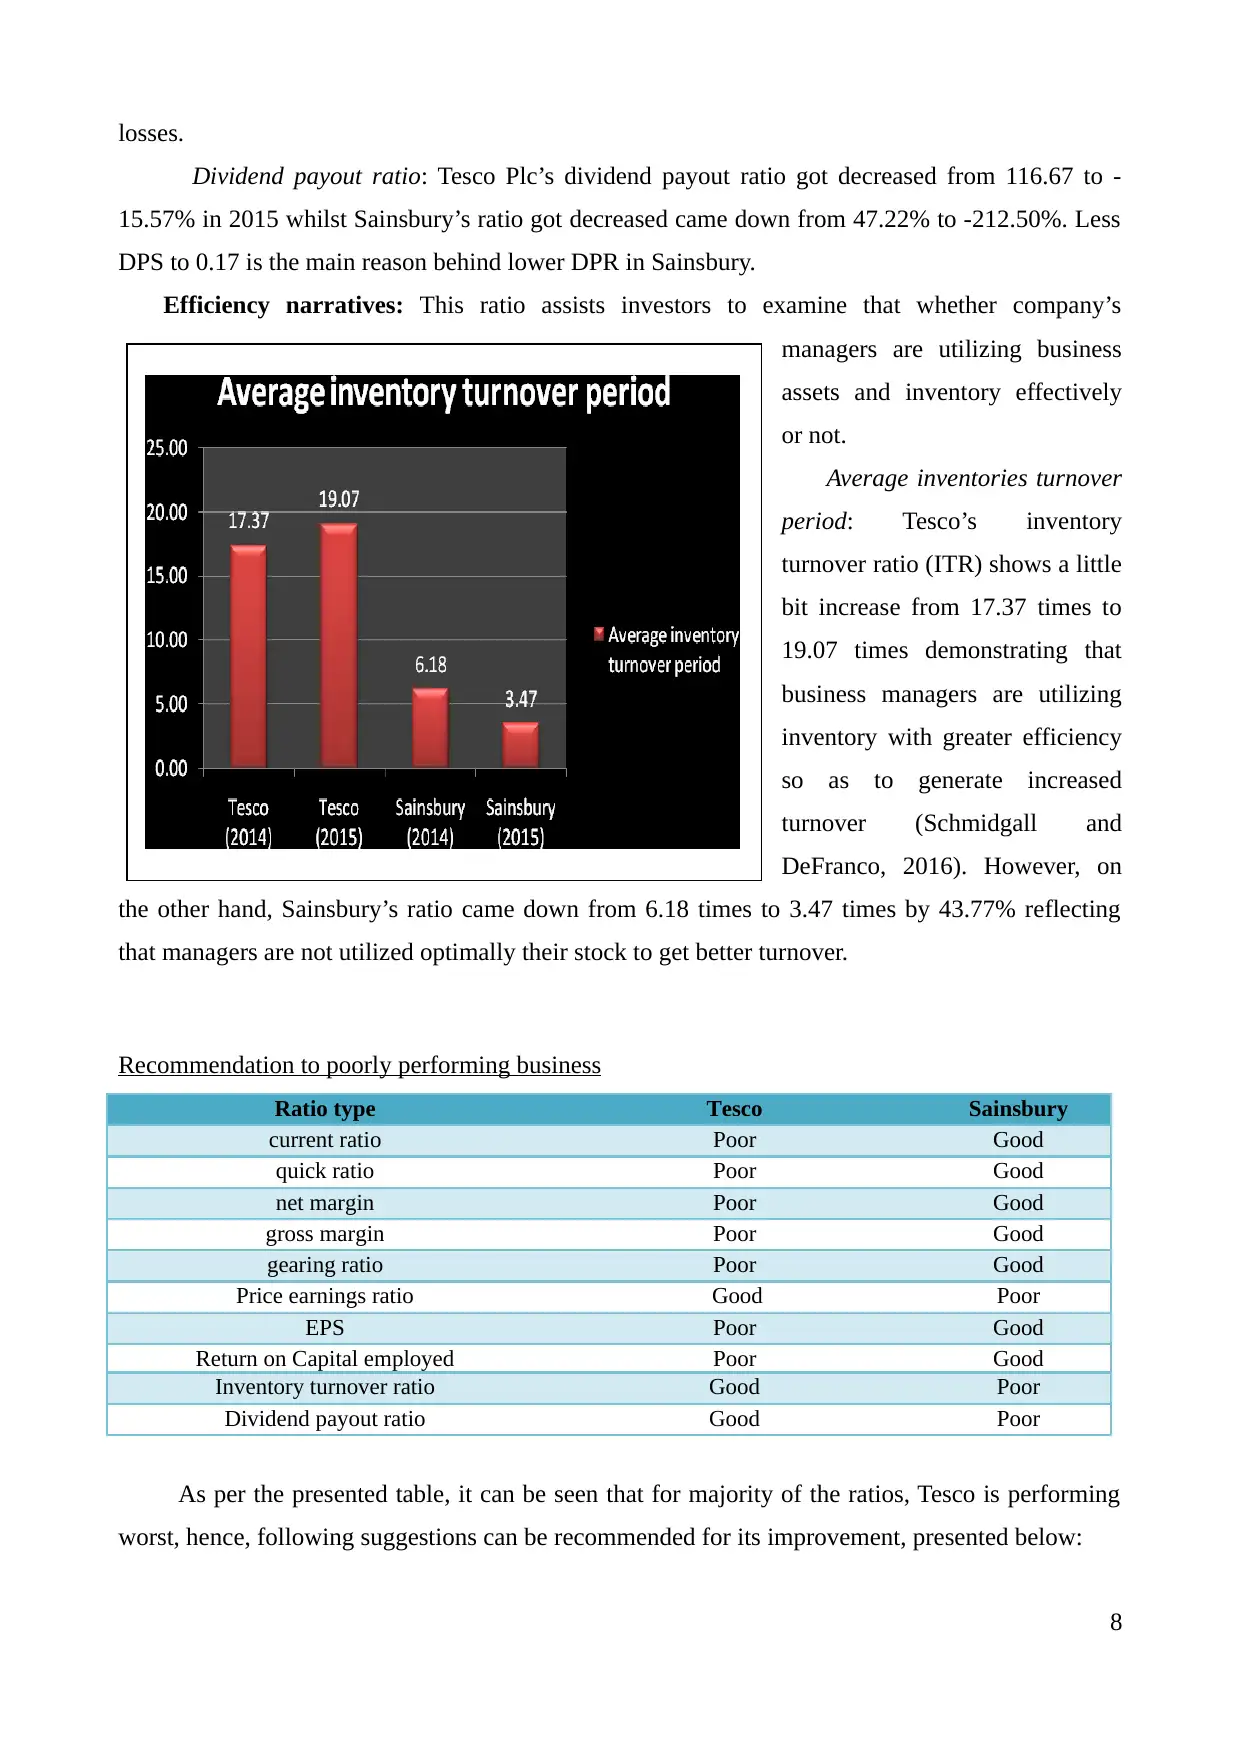
Efficiency narratives: This ratio assists investors to examine that whether company’s
managers are utilizing business
assets and inventory effectively
or not.
Average inventories turnover
period: Tesco’s inventory
turnover ratio (ITR) shows a little
bit increase from 17.37 times to
19.07 times demonstrating that
business managers are utilizing
inventory with greater efficiency
so as to generate increased
turnover (Schmidgall and
DeFranco, 2016). However, on
the other hand, Sainsbury’s ratio came down from 6.18 times to 3.47 times by 43.77% reflecting
that managers are not utilized optimally their stock to get better turnover.
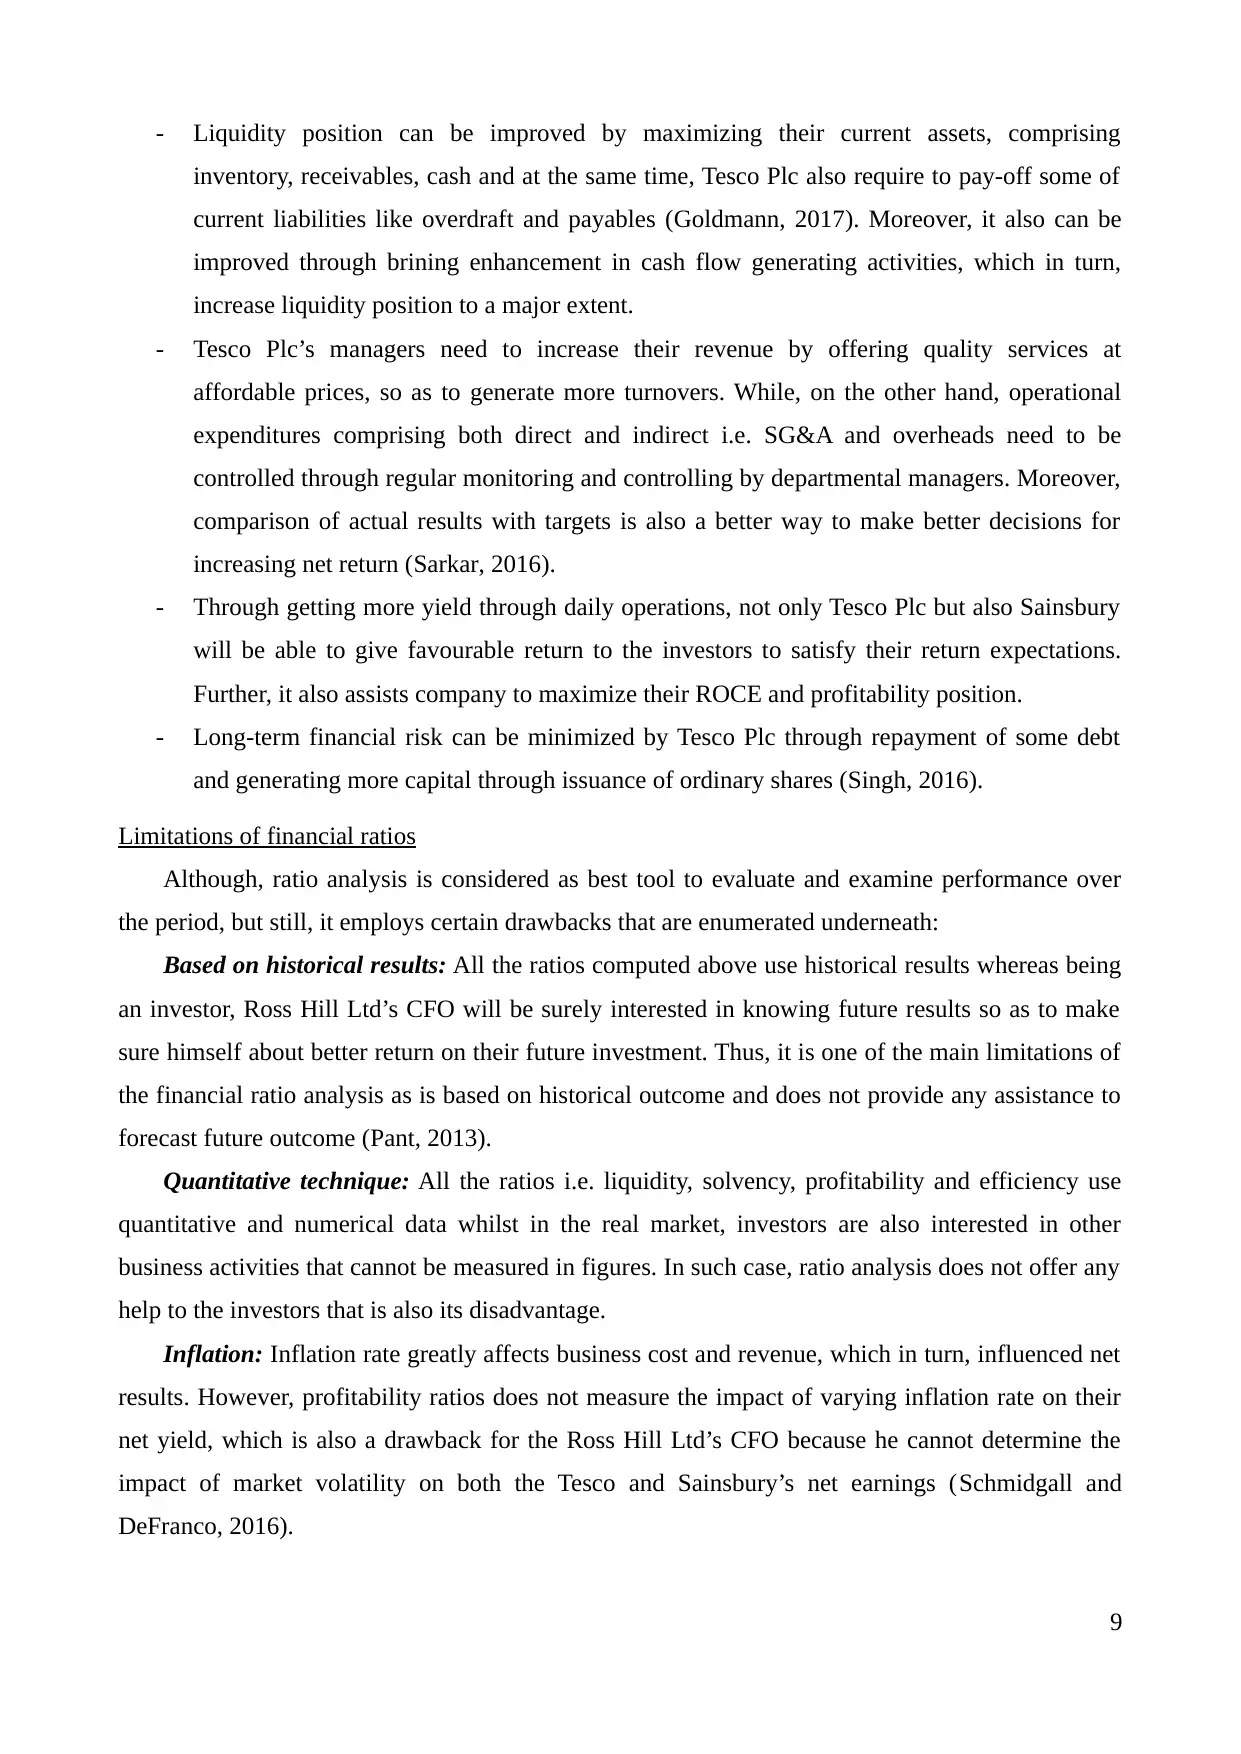
Recommendation to poorly performing business
Ratio type Tesco Sainsbury
current ratio Poor Good
quick ratio Poor Good
net margin Poor Good
gross margin Poor Good
gearing ratio Poor Good
Price earnings ratio Good Poor
EPS Poor Good
Return on Capital employed Poor Good
Inventory turnover ratio Good Poor
Dividend payout ratio Good Poor
As per the presented table, it can be seen that for majority of the ratios, Tesco is performing
worst, hence, following suggestions can be recommended for its improvement, presented below:
8
Dividend payout ratio: Tesco Plc’s dividend payout ratio got decreased from 116.67 to -
15.57% in 2015 whilst Sainsbury’s ratio got decreased came down from 47.22% to -212.50%. Less
DPS to 0.17 is the main reason behind lower DPR in Sainsbury.
Efficiency narratives: This ratio assists investors to examine that whether company’s
managers are utilizing business
assets and inventory effectively
or not.
Average inventories turnover
period: Tesco’s inventory
turnover ratio (ITR) shows a little
bit increase from 17.37 times to
19.07 times demonstrating that
business managers are utilizing
inventory with greater efficiency
so as to generate increased
turnover (Schmidgall and
DeFranco, 2016). However, on
the other hand, Sainsbury’s ratio came down from 6.18 times to 3.47 times by 43.77% reflecting
that managers are not utilized optimally their stock to get better turnover.
Recommendation to poorly performing business
Ratio type Tesco Sainsbury
current ratio Poor Good
quick ratio Poor Good
net margin Poor Good
gross margin Poor Good
gearing ratio Poor Good
Price earnings ratio Good Poor
EPS Poor Good
Return on Capital employed Poor Good
Inventory turnover ratio Good Poor
Dividend payout ratio Good Poor
As per the presented table, it can be seen that for majority of the ratios, Tesco is performing
worst, hence, following suggestions can be recommended for its improvement, presented below:
8
- Liquidity position can be improved by maximizing their current assets, comprising
inventory, receivables, cash and at the same time, Tesco Plc also require to pay-off some of
current liabilities like overdraft and payables (Goldmann, 2017). Moreover, it also can be
improved through brining enhancement in cash flow generating activities, which in turn,
increase liquidity position to a major extent.
- Tesco Plc’s managers need to increase their revenue by offering quality services at
affordable prices, so as to generate more turnovers. While, on the other hand, operational
expenditures comprising both direct and indirect i.e. SG&A and overheads need to be
controlled through regular monitoring and controlling by departmental managers. Moreover,
comparison of actual results with targets is also a better way to make better decisions for
increasing net return (Sarkar, 2016).
- Through getting more yield through daily operations, not only Tesco Plc but also Sainsbury
will be able to give favourable return to the investors to satisfy their return expectations.
Further, it also assists company to maximize their ROCE and profitability position.
- Long-term financial risk can be minimized by Tesco Plc through repayment of some debt
and generating more capital through issuance of ordinary shares (Singh, 2016).
Limitations of financial ratios
Although, ratio analysis is considered as best tool to evaluate and examine performance over
the period, but still, it employs certain drawbacks that are enumerated underneath:
Based on historical results: All the ratios computed above use historical results whereas being
an investor, Ross Hill Ltd’s CFO will be surely interested in knowing future results so as to make
sure himself about better return on their future investment. Thus, it is one of the main limitations of
the financial ratio analysis as is based on historical outcome and does not provide any assistance to
forecast future outcome (Pant, 2013).
Quantitative technique: All the ratios i.e. liquidity, solvency, profitability and efficiency use
quantitative and numerical data whilst in the real market, investors are also interested in other
business activities that cannot be measured in figures. In such case, ratio analysis does not offer any
help to the investors that is also its disadvantage.
Inflation: Inflation rate greatly affects business cost and revenue, which in turn, influenced net
results. However, profitability ratios does not measure the impact of varying inflation rate on their
net yield, which is also a drawback for the Ross Hill Ltd’s CFO because he cannot determine the
impact of market volatility on both the Tesco and Sainsbury’s net earnings (Schmidgall and
DeFranco, 2016).
9
⊘ This is a preview!⊘
Do you want full access?
Subscribe today to unlock all pages.
Trusted by 1+ million students worldwide
Accounting techniques and principles: Although both the companies operate in retail industry,
but still, data which they report in their annual accounts may be differ due to follow-up of
distinguish accounting principles, conventions, policies and rules. It directly influenced the reported
figures in the financial statement and quality of ratio analysis, which in turn, affect investor’s
decisions.
Operational change: Financial ratio analysis in Tesco and Sainsbury having differences in
internal business conditions, operational structure, system and processes and corporate strategies
and goals may lead to take harmful investment decisions. For instance, out of these companies, if
any one follows low-cost strategy and then it will definitely willing to accept lower GM so as to
attract larger market share (Ghasemi and Ab Razak, 2016).. In such case, profitability evaluation
may lead to take misleading decisions.
Difficult to interpret: It will not be easy for Ross Hill Ltd’s CFO to say a particular ratio good
or bad because of no idle set. For instance, although improvements in assets inventory turnover
ratio is a good sign of managerial efficiency, but still, it is not decided that at what level, it will be
considered as idle. As a result, interpretation of ratio becomes very difficult for the investor.
QUESTION: 2 CAPITAL INVESTMENT APPRAISALS
According to the given scenario, Midway Limited (ML) is a manufacturing concern that has an
opportunity available in the market to invest funds in one of two mutually exclusive projects about
machinery purchase. It is a type of capital expenditures which comprises both risk and return
possibility, therefore, in order to make better and viable decision, ML require to examine the risk-
return relationship in both the projects and thereby identify the best among these. Investment
appraisal techniques are of great importance that assists companies to evaluate project viability,
portfolio decision and identify the value that a project can generate in future. Here, both the
discounting and non-discounting techniques are applying to identify the most viable or profitable
proposal available to ML, executed below:
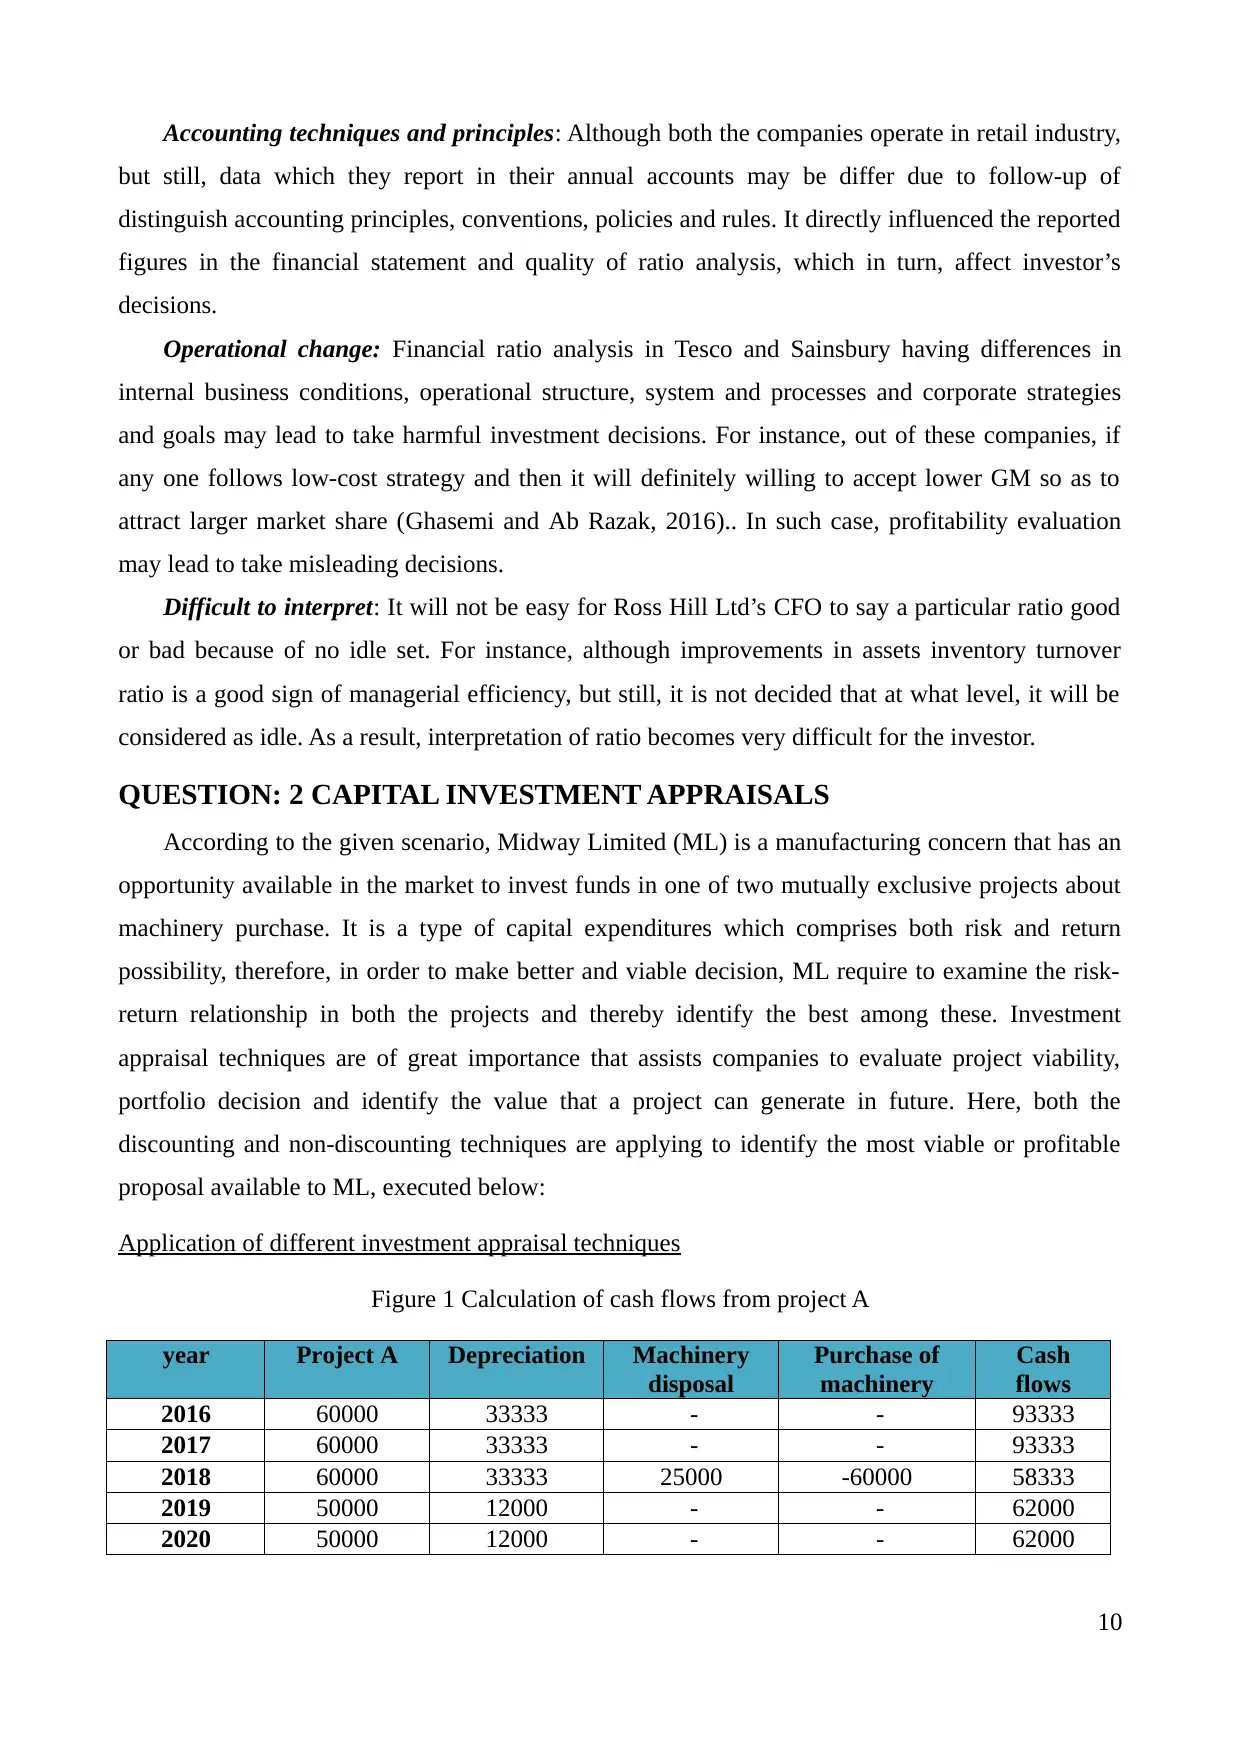
Application of different investment appraisal techniques
Figure 1 Calculation of cash flows from project A
year Project A Depreciation Machinery
disposal
Purchase of
machinery
Cash
flows
2016 60000 33333 - - 93333
2017 60000 33333 - - 93333
2018 60000 33333 25000 -60000 58333
2019 50000 12000 - - 62000
2020 50000 12000 - - 62000
10
but still, data which they report in their annual accounts may be differ due to follow-up of
distinguish accounting principles, conventions, policies and rules. It directly influenced the reported
figures in the financial statement and quality of ratio analysis, which in turn, affect investor’s
decisions.
Operational change: Financial ratio analysis in Tesco and Sainsbury having differences in
internal business conditions, operational structure, system and processes and corporate strategies
and goals may lead to take harmful investment decisions. For instance, out of these companies, if
any one follows low-cost strategy and then it will definitely willing to accept lower GM so as to
attract larger market share (Ghasemi and Ab Razak, 2016).. In such case, profitability evaluation
may lead to take misleading decisions.
Difficult to interpret: It will not be easy for Ross Hill Ltd’s CFO to say a particular ratio good
or bad because of no idle set. For instance, although improvements in assets inventory turnover
ratio is a good sign of managerial efficiency, but still, it is not decided that at what level, it will be
considered as idle. As a result, interpretation of ratio becomes very difficult for the investor.
QUESTION: 2 CAPITAL INVESTMENT APPRAISALS
According to the given scenario, Midway Limited (ML) is a manufacturing concern that has an
opportunity available in the market to invest funds in one of two mutually exclusive projects about
machinery purchase. It is a type of capital expenditures which comprises both risk and return
possibility, therefore, in order to make better and viable decision, ML require to examine the risk-
return relationship in both the projects and thereby identify the best among these. Investment
appraisal techniques are of great importance that assists companies to evaluate project viability,
portfolio decision and identify the value that a project can generate in future. Here, both the
discounting and non-discounting techniques are applying to identify the most viable or profitable
proposal available to ML, executed below:
Application of different investment appraisal techniques
Figure 1 Calculation of cash flows from project A
year Project A Depreciation Machinery
disposal
Purchase of
machinery
Cash
flows
2016 60000 33333 - - 93333
2017 60000 33333 - - 93333
2018 60000 33333 25000 -60000 58333
2019 50000 12000 - - 62000
2020 50000 12000 - - 62000
10
Paraphrase This Document
Need a fresh take? Get an instant paraphrase of this document with our AI Paraphraser
2021 40000 12000 - - 52000
Total 320000
Depreciation = (Initial investment – Residual/scrap value)/Estimated project life
Machine 1 = (£125000-£25000)/3 year
= £33333
Machine X = (£60000 – Nil)/5 year
= £12000
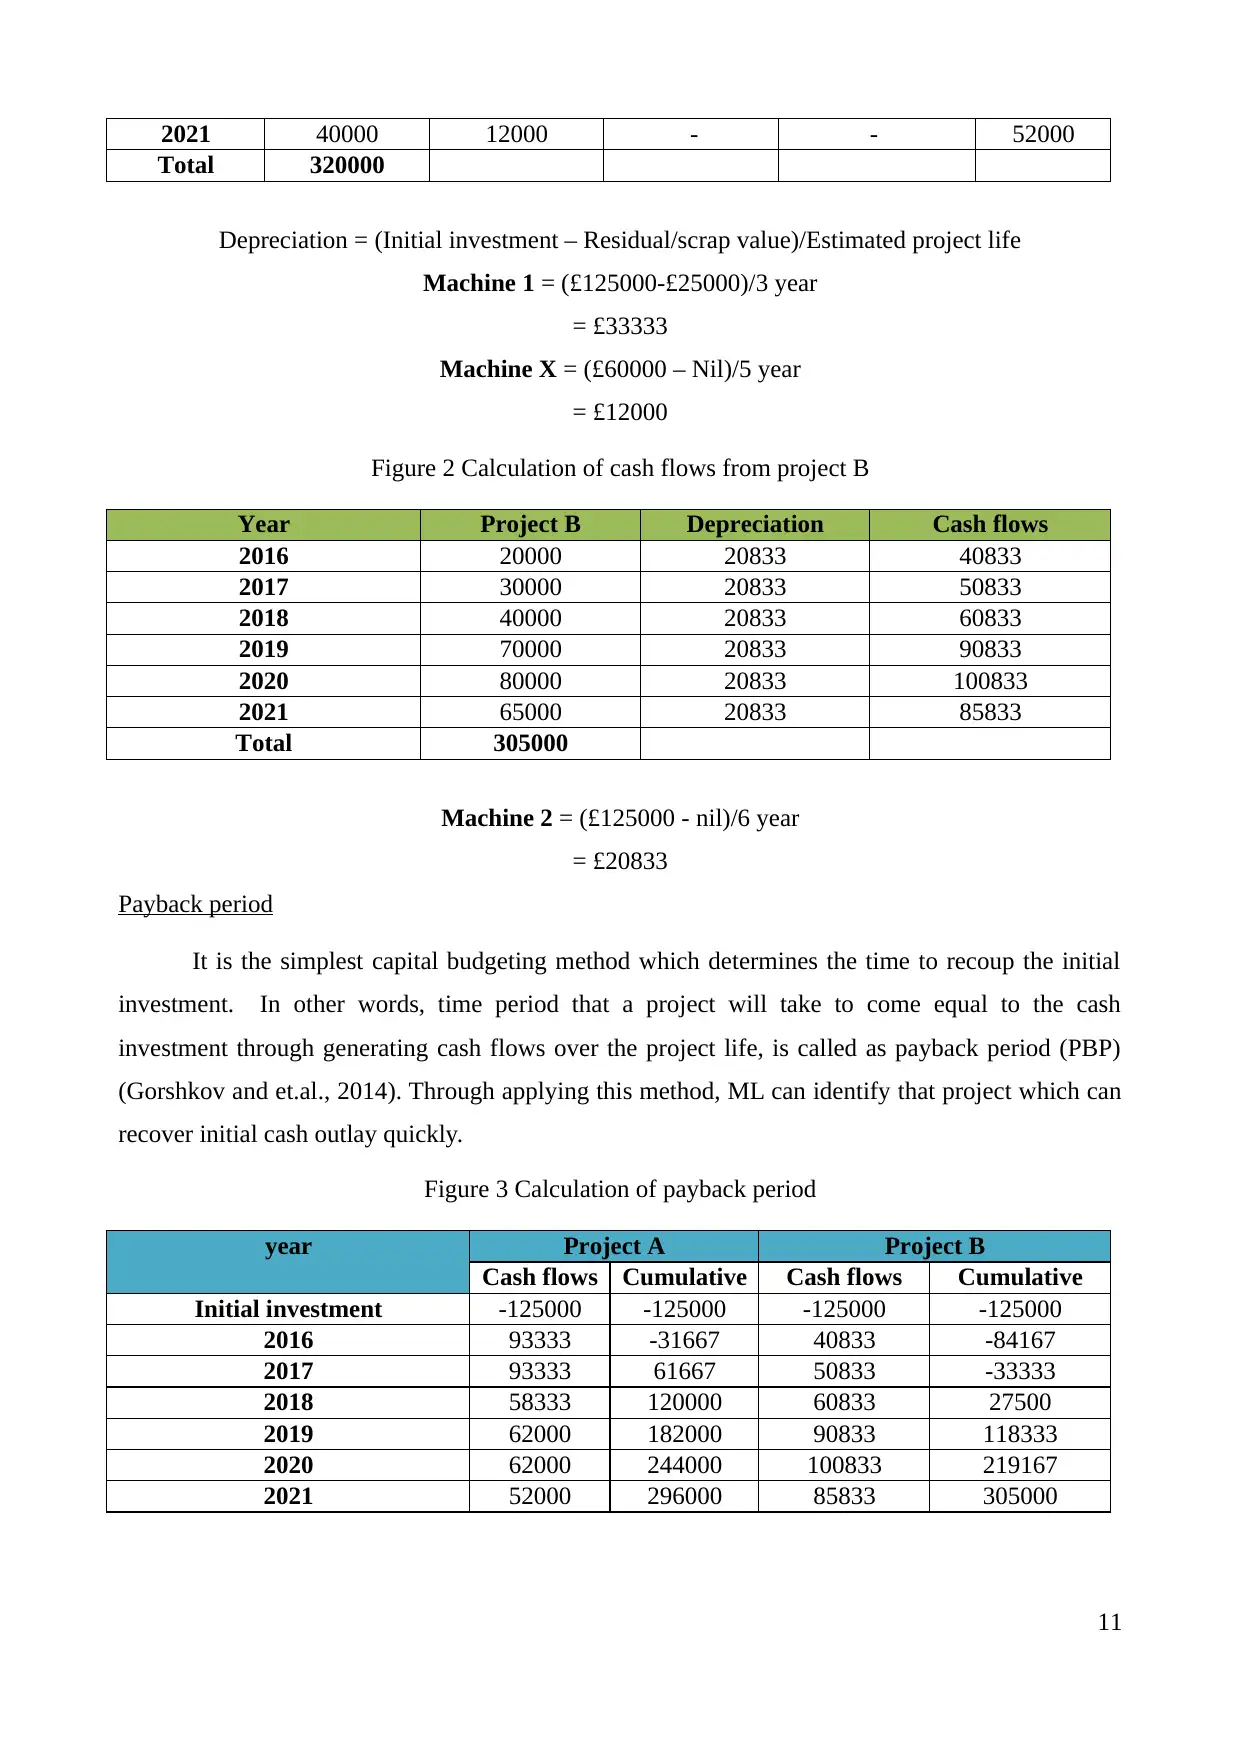
Figure 2 Calculation of cash flows from project B
Year Project B Depreciation Cash flows
2016 20000 20833 40833
2017 30000 20833 50833
2018 40000 20833 60833
2019 70000 20833 90833
2020 80000 20833 100833
2021 65000 20833 85833
Total 305000
Machine 2 = (£125000 - nil)/6 year
= £20833
Payback period
It is the simplest capital budgeting method which determines the time to recoup the initial
investment. In other words, time period that a project will take to come equal to the cash
investment through generating cash flows over the project life, is called as payback period (PBP)
(Gorshkov and et.al., 2014). Through applying this method, ML can identify that project which can
recover initial cash outlay quickly.
Figure 3 Calculation of payback period
year Project A Project B
Cash flows Cumulative Cash flows Cumulative
Initial investment -125000 -125000 -125000 -125000
2016 93333 -31667 40833 -84167
2017 93333 61667 50833 -33333
2018 58333 120000 60833 27500
2019 62000 182000 90833 118333
2020 62000 244000 100833 219167
2021 52000 296000 85833 305000
11
Total 320000
Depreciation = (Initial investment – Residual/scrap value)/Estimated project life
Machine 1 = (£125000-£25000)/3 year
= £33333
Machine X = (£60000 – Nil)/5 year
= £12000
Figure 2 Calculation of cash flows from project B
Year Project B Depreciation Cash flows
2016 20000 20833 40833
2017 30000 20833 50833
2018 40000 20833 60833
2019 70000 20833 90833
2020 80000 20833 100833
2021 65000 20833 85833
Total 305000
Machine 2 = (£125000 - nil)/6 year
= £20833
Payback period
It is the simplest capital budgeting method which determines the time to recoup the initial
investment. In other words, time period that a project will take to come equal to the cash
investment through generating cash flows over the project life, is called as payback period (PBP)
(Gorshkov and et.al., 2014). Through applying this method, ML can identify that project which can
recover initial cash outlay quickly.
Figure 3 Calculation of payback period
year Project A Project B
Cash flows Cumulative Cash flows Cumulative
Initial investment -125000 -125000 -125000 -125000
2016 93333 -31667 40833 -84167
2017 93333 61667 50833 -33333
2018 58333 120000 60833 27500
2019 62000 182000 90833 118333
2020 62000 244000 100833 219167
2021 52000 296000 85833 305000
11
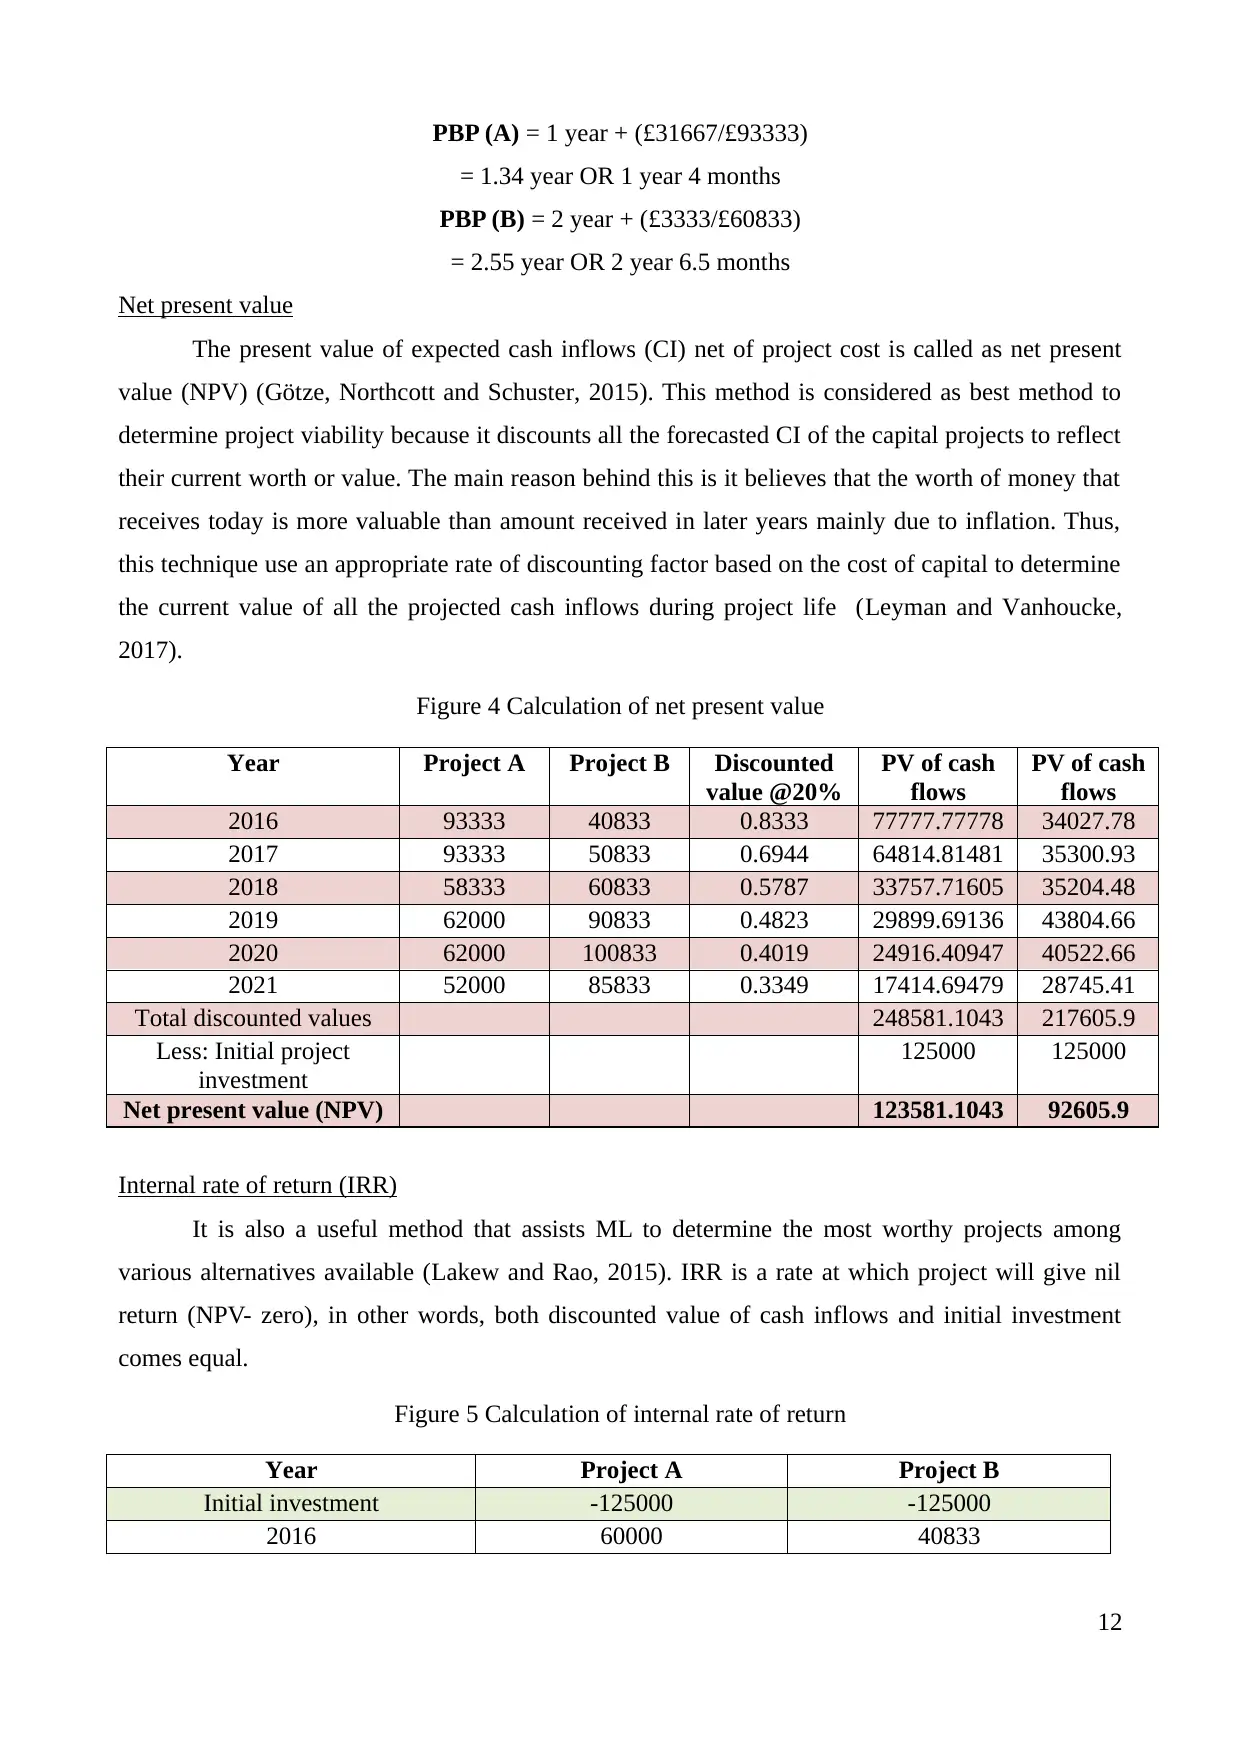
PBP (A) = 1 year + (£31667/£93333)
= 1.34 year OR 1 year 4 months
PBP (B) = 2 year + (£3333/£60833)
= 2.55 year OR 2 year 6.5 months
Net present value
The present value of expected cash inflows (CI) net of project cost is called as net present
value (NPV) (Götze, Northcott and Schuster, 2015). This method is considered as best method to
determine project viability because it discounts all the forecasted CI of the capital projects to reflect
their current worth or value. The main reason behind this is it believes that the worth of money that
receives today is more valuable than amount received in later years mainly due to inflation. Thus,
this technique use an appropriate rate of discounting factor based on the cost of capital to determine
the current value of all the projected cash inflows during project life (Leyman and Vanhoucke,
2017).
Figure 4 Calculation of net present value
Year Project A Project B Discounted
value @20%
PV of cash
flows
PV of cash
flows
2016 93333 40833 0.8333 77777.77778 34027.78
2017 93333 50833 0.6944 64814.81481 35300.93
2018 58333 60833 0.5787 33757.71605 35204.48
2019 62000 90833 0.4823 29899.69136 43804.66
2020 62000 100833 0.4019 24916.40947 40522.66
2021 52000 85833 0.3349 17414.69479 28745.41
Total discounted values 248581.1043 217605.9
Less: Initial project
investment
125000 125000
Net present value (NPV) 123581.1043 92605.9
Internal rate of return (IRR)
It is also a useful method that assists ML to determine the most worthy projects among
various alternatives available (Lakew and Rao, 2015). IRR is a rate at which project will give nil
return (NPV- zero), in other words, both discounted value of cash inflows and initial investment
comes equal.
Figure 5 Calculation of internal rate of return
Year Project A Project B
Initial investment -125000 -125000
2016 60000 40833
12
⊘ This is a preview!⊘
Do you want full access?
Subscribe today to unlock all pages.
Trusted by 1+ million students worldwide
1 out of 16
Related Documents


Your All-in-One AI-Powered Toolkit for Academic Success.
+13062052269
info@desklib.com
Available 24*7 on WhatsApp / Email
![[object Object]](/_next/static/media/star-bottom.7253800d.svg)
Unlock your academic potential
Copyright © 2020–2026 A2Z Services. All Rights Reserved. Developed and managed by ZUCOL.