ACC 515 - Capital Investment Decision & Financial Ratio Analysis
VerifiedAdded on 2023/06/03
|16
|2551
|97
Report
AI Summary
This report provides a detailed financial analysis of AMP Limited, including a comparative analysis of WAACC and capital structure against Commonwealth Bank, key financial ratio analysis covering liquidity, solvency, profitability, efficiency, and investor ratios, and an assessment of material risks faced by the business. The report evaluates a proposed capital investment using payback period, net present value (NPV), and profitability index methods, including sensitivity analysis by varying sales by 20%. Additionally, it compares two investment options using annualized cost. The analysis concludes with recommendations based on the financial metrics and risk assessment.

ACC 515
Paraphrase This Document
Need a fresh take? Get an instant paraphrase of this document with our AI Paraphraser
TABLE OF CONTENTS
Part A.........................................................................................................................................3
(i)............................................................................................................................................3
(ii)...........................................................................................................................................5
A.........................................................................................................................................5
B.........................................................................................................................................6
C.........................................................................................................................................8
(iii)..........................................................................................................................................8
Part B........................................................................................................................................10
References................................................................................................................................16
PART A
(i)
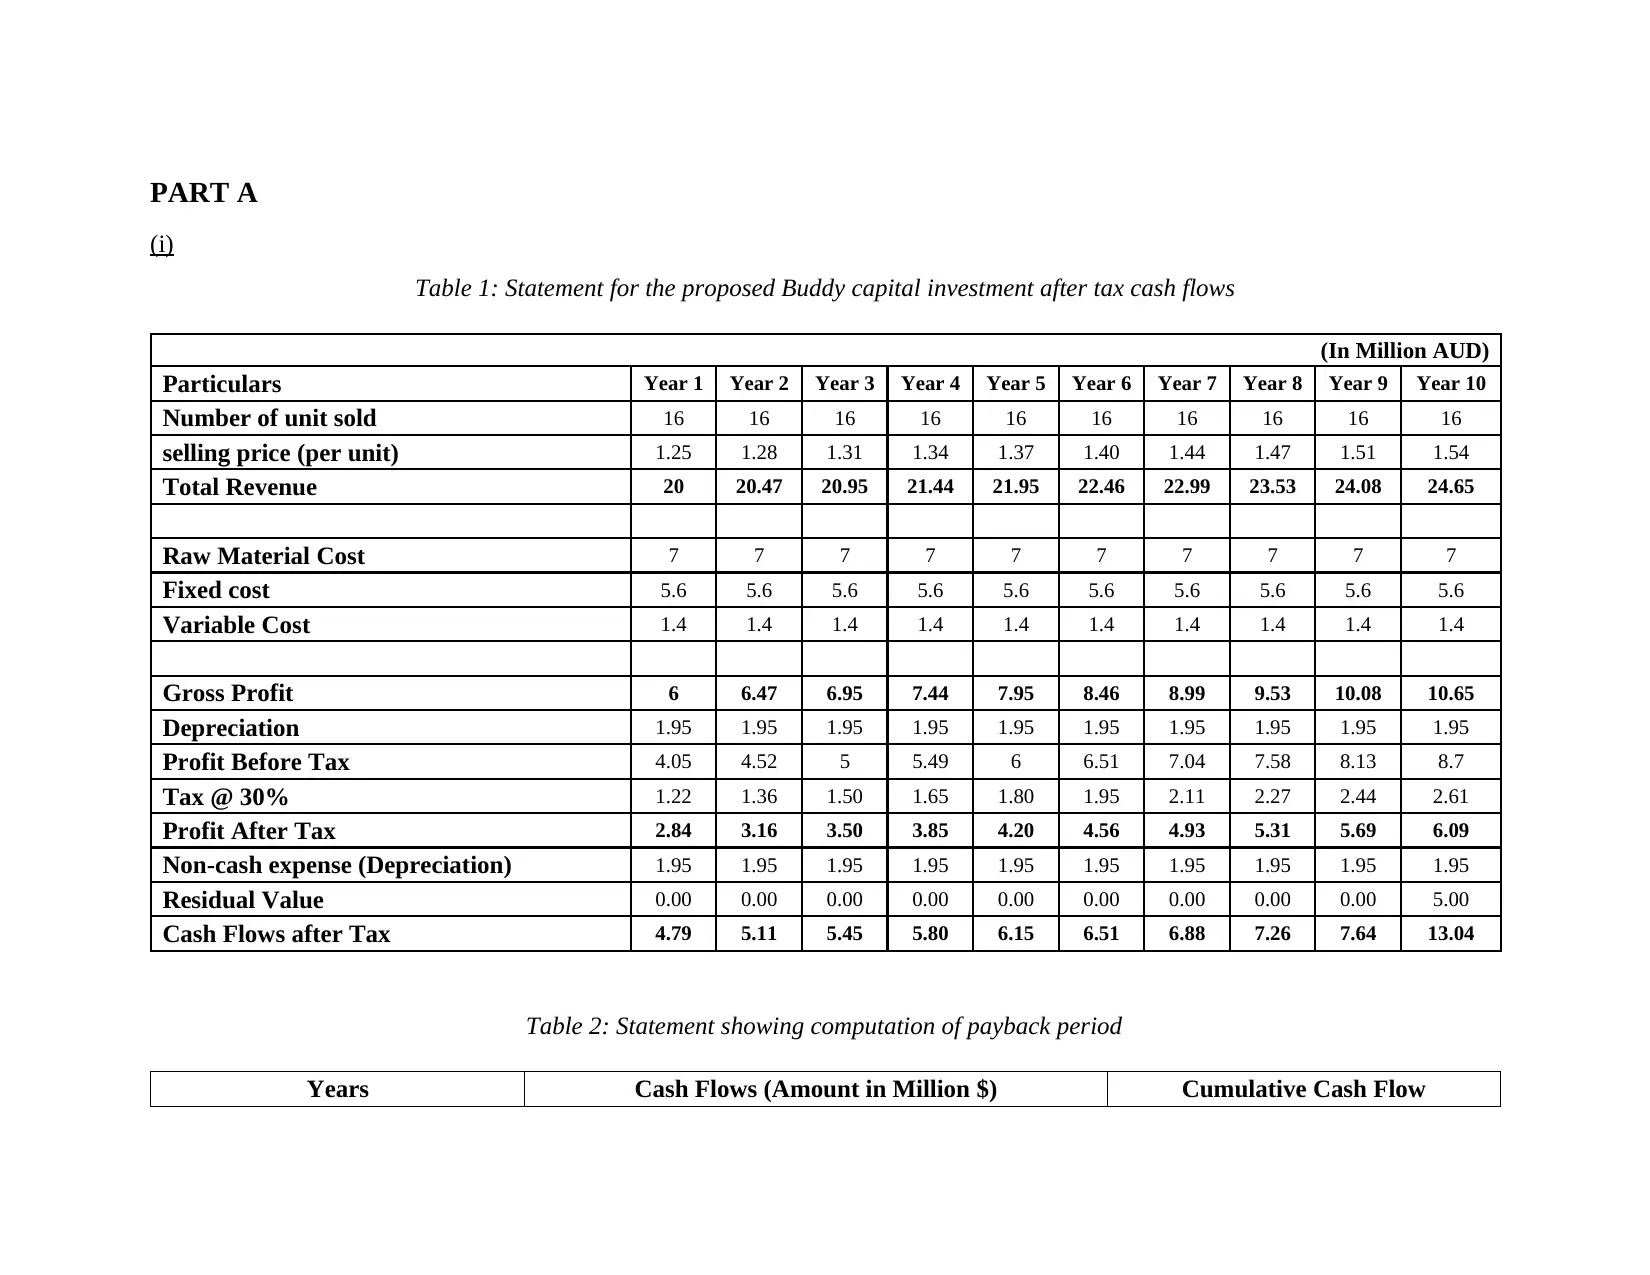
Table 1: Statement for the proposed Buddy capital investment after tax cash flows
(In Million AUD)
Particulars Year 1 Year 2 Year 3 Year 4 Year 5 Year 6 Year 7 Year 8 Year 9 Year 10
Number of unit sold 16 16 16 16 16 16 16 16 16 16
selling price (per unit) 1.25 1.28 1.31 1.34 1.37 1.40 1.44 1.47 1.51 1.54
Total Revenue 20 20.47 20.95 21.44 21.95 22.46 22.99 23.53 24.08 24.65
Raw Material Cost 7 7 7 7 7 7 7 7 7 7
Fixed cost 5.6 5.6 5.6 5.6 5.6 5.6 5.6 5.6 5.6 5.6
Variable Cost 1.4 1.4 1.4 1.4 1.4 1.4 1.4 1.4 1.4 1.4
Gross Profit 6 6.47 6.95 7.44 7.95 8.46 8.99 9.53 10.08 10.65
Depreciation 1.95 1.95 1.95 1.95 1.95 1.95 1.95 1.95 1.95 1.95
Profit Before Tax 4.05 4.52 5 5.49 6 6.51 7.04 7.58 8.13 8.7
Tax @ 30% 1.22 1.36 1.50 1.65 1.80 1.95 2.11 2.27 2.44 2.61
Profit After Tax 2.84 3.16 3.50 3.85 4.20 4.56 4.93 5.31 5.69 6.09
Non-cash expense (Depreciation) 1.95 1.95 1.95 1.95 1.95 1.95 1.95 1.95 1.95 1.95
Residual Value 0.00 0.00 0.00 0.00 0.00 0.00 0.00 0.00 0.00 5.00
Cash Flows after Tax 4.79 5.11 5.45 5.80 6.15 6.51 6.88 7.26 7.64 13.04
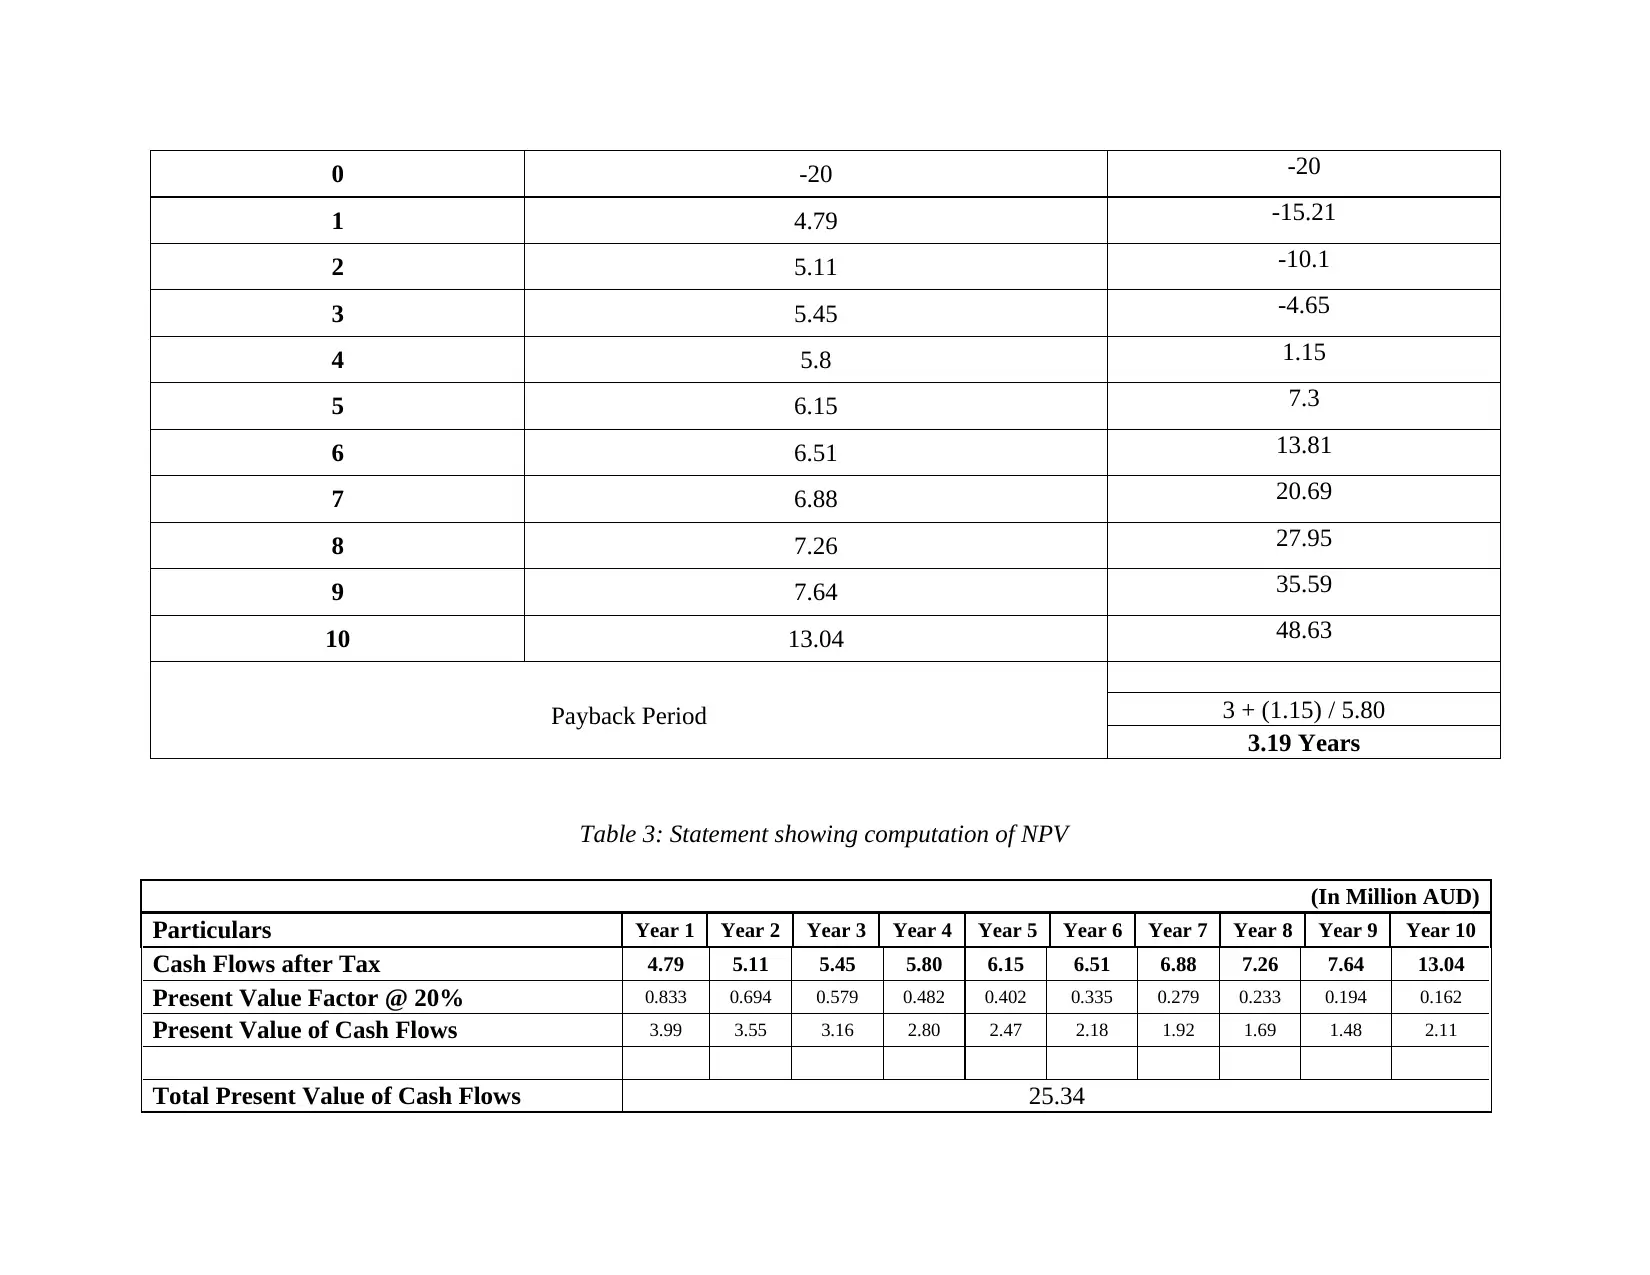
Table 2: Statement showing computation of payback period
Years Cash Flows (Amount in Million $) Cumulative Cash Flow
(i)
Table 1: Statement for the proposed Buddy capital investment after tax cash flows
(In Million AUD)
Particulars Year 1 Year 2 Year 3 Year 4 Year 5 Year 6 Year 7 Year 8 Year 9 Year 10
Number of unit sold 16 16 16 16 16 16 16 16 16 16
selling price (per unit) 1.25 1.28 1.31 1.34 1.37 1.40 1.44 1.47 1.51 1.54
Total Revenue 20 20.47 20.95 21.44 21.95 22.46 22.99 23.53 24.08 24.65
Raw Material Cost 7 7 7 7 7 7 7 7 7 7
Fixed cost 5.6 5.6 5.6 5.6 5.6 5.6 5.6 5.6 5.6 5.6
Variable Cost 1.4 1.4 1.4 1.4 1.4 1.4 1.4 1.4 1.4 1.4
Gross Profit 6 6.47 6.95 7.44 7.95 8.46 8.99 9.53 10.08 10.65
Depreciation 1.95 1.95 1.95 1.95 1.95 1.95 1.95 1.95 1.95 1.95
Profit Before Tax 4.05 4.52 5 5.49 6 6.51 7.04 7.58 8.13 8.7
Tax @ 30% 1.22 1.36 1.50 1.65 1.80 1.95 2.11 2.27 2.44 2.61
Profit After Tax 2.84 3.16 3.50 3.85 4.20 4.56 4.93 5.31 5.69 6.09
Non-cash expense (Depreciation) 1.95 1.95 1.95 1.95 1.95 1.95 1.95 1.95 1.95 1.95
Residual Value 0.00 0.00 0.00 0.00 0.00 0.00 0.00 0.00 0.00 5.00
Cash Flows after Tax 4.79 5.11 5.45 5.80 6.15 6.51 6.88 7.26 7.64 13.04
Table 2: Statement showing computation of payback period
Years Cash Flows (Amount in Million $) Cumulative Cash Flow
⊘ This is a preview!⊘
Do you want full access?
Subscribe today to unlock all pages.
Trusted by 1+ million students worldwide
0 -20 -20
1 4.79 -15.21
2 5.11 -10.1
3 5.45 -4.65
4 5.8 1.15
5 6.15 7.3
6 6.51 13.81
7 6.88 20.69
8 7.26 27.95
9 7.64 35.59
10 13.04 48.63
Payback Period 3 + (1.15) / 5.80
3.19 Years
Table 3: Statement showing computation of NPV
(In Million AUD)
Particulars Year 1 Year 2 Year 3 Year 4 Year 5 Year 6 Year 7 Year 8 Year 9 Year 10
Cash Flows after Tax 4.79 5.11 5.45 5.80 6.15 6.51 6.88 7.26 7.64 13.04
Present Value Factor @ 20% 0.833 0.694 0.579 0.482 0.402 0.335 0.279 0.233 0.194 0.162
Present Value of Cash Flows 3.99 3.55 3.16 2.80 2.47 2.18 1.92 1.69 1.48 2.11
Total Present Value of Cash Flows 25.34
Paraphrase This Document
Need a fresh take? Get an instant paraphrase of this document with our AI Paraphraser
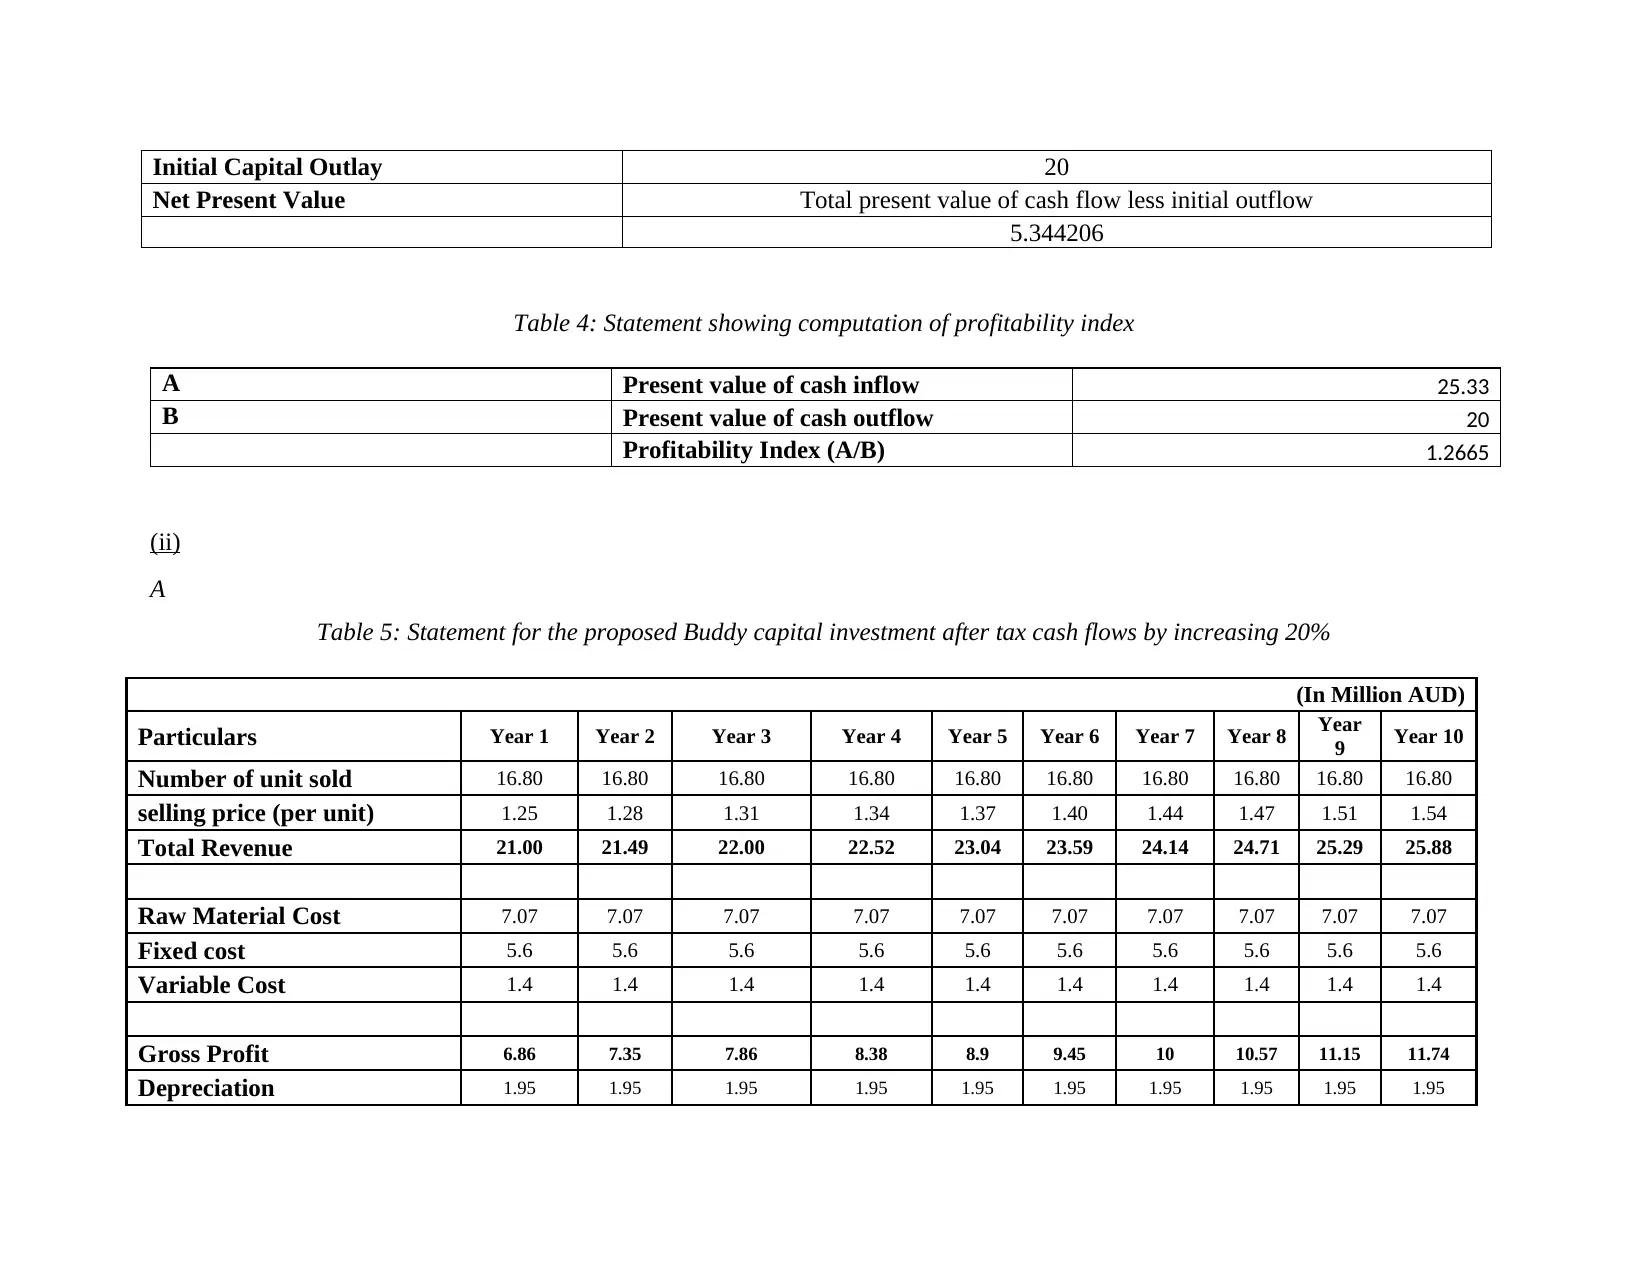
Initial Capital Outlay 20
Net Present Value Total present value of cash flow less initial outflow
5.344206
Table 4: Statement showing computation of profitability index
A Present value of cash inflow 25.33
B Present value of cash outflow 20
Profitability Index (A/B) 1.2665
(ii)
A
Table 5: Statement for the proposed Buddy capital investment after tax cash flows by increasing 20%
(In Million AUD)
Particulars Year 1 Year 2 Year 3 Year 4 Year 5 Year 6 Year 7 Year 8 Year
9 Year 10
Number of unit sold 16.80 16.80 16.80 16.80 16.80 16.80 16.80 16.80 16.80 16.80
selling price (per unit) 1.25 1.28 1.31 1.34 1.37 1.40 1.44 1.47 1.51 1.54
Total Revenue 21.00 21.49 22.00 22.52 23.04 23.59 24.14 24.71 25.29 25.88
Raw Material Cost 7.07 7.07 7.07 7.07 7.07 7.07 7.07 7.07 7.07 7.07
Fixed cost 5.6 5.6 5.6 5.6 5.6 5.6 5.6 5.6 5.6 5.6
Variable Cost 1.4 1.4 1.4 1.4 1.4 1.4 1.4 1.4 1.4 1.4
Gross Profit 6.86 7.35 7.86 8.38 8.9 9.45 10 10.57 11.15 11.74
Depreciation 1.95 1.95 1.95 1.95 1.95 1.95 1.95 1.95 1.95 1.95
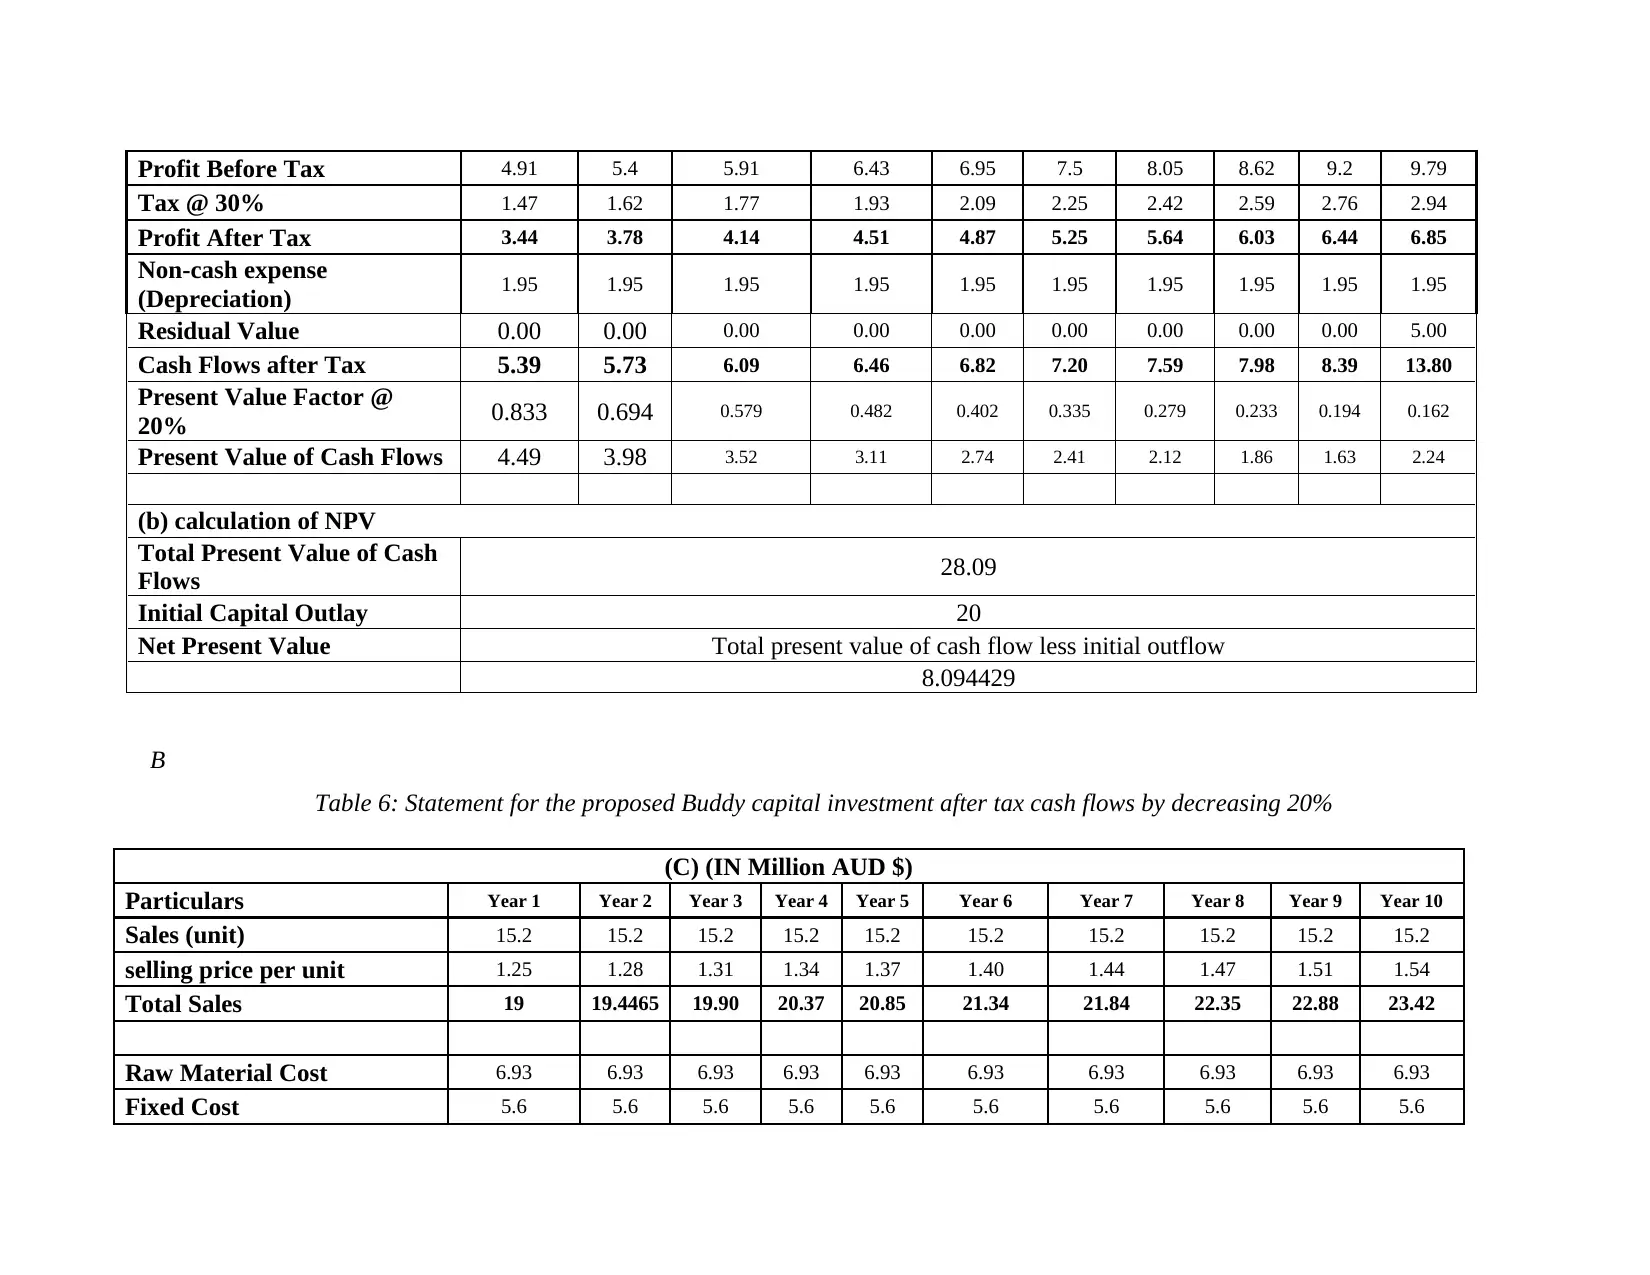
Profit Before Tax 4.91 5.4 5.91 6.43 6.95 7.5 8.05 8.62 9.2 9.79
Tax @ 30% 1.47 1.62 1.77 1.93 2.09 2.25 2.42 2.59 2.76 2.94
Profit After Tax 3.44 3.78 4.14 4.51 4.87 5.25 5.64 6.03 6.44 6.85
Non-cash expense
(Depreciation) 1.95 1.95 1.95 1.95 1.95 1.95 1.95 1.95 1.95 1.95
Residual Value 0.00 0.00 0.00 0.00 0.00 0.00 0.00 0.00 0.00 5.00
Cash Flows after Tax 5.39 5.73 6.09 6.46 6.82 7.20 7.59 7.98 8.39 13.80
Present Value Factor @
20% 0.833 0.694 0.579 0.482 0.402 0.335 0.279 0.233 0.194 0.162
Present Value of Cash Flows 4.49 3.98 3.52 3.11 2.74 2.41 2.12 1.86 1.63 2.24
(b) calculation of NPV
Total Present Value of Cash
Flows 28.09
Initial Capital Outlay 20
Net Present Value Total present value of cash flow less initial outflow
8.094429
B
Table 6: Statement for the proposed Buddy capital investment after tax cash flows by decreasing 20%
(C) (IN Million AUD $)
Particulars Year 1 Year 2 Year 3 Year 4 Year 5 Year 6 Year 7 Year 8 Year 9 Year 10
Sales (unit) 15.2 15.2 15.2 15.2 15.2 15.2 15.2 15.2 15.2 15.2
selling price per unit 1.25 1.28 1.31 1.34 1.37 1.40 1.44 1.47 1.51 1.54
Total Sales 19 19.4465 19.90 20.37 20.85 21.34 21.84 22.35 22.88 23.42
Raw Material Cost 6.93 6.93 6.93 6.93 6.93 6.93 6.93 6.93 6.93 6.93
Fixed Cost 5.6 5.6 5.6 5.6 5.6 5.6 5.6 5.6 5.6 5.6
⊘ This is a preview!⊘
Do you want full access?
Subscribe today to unlock all pages.
Trusted by 1+ million students worldwide
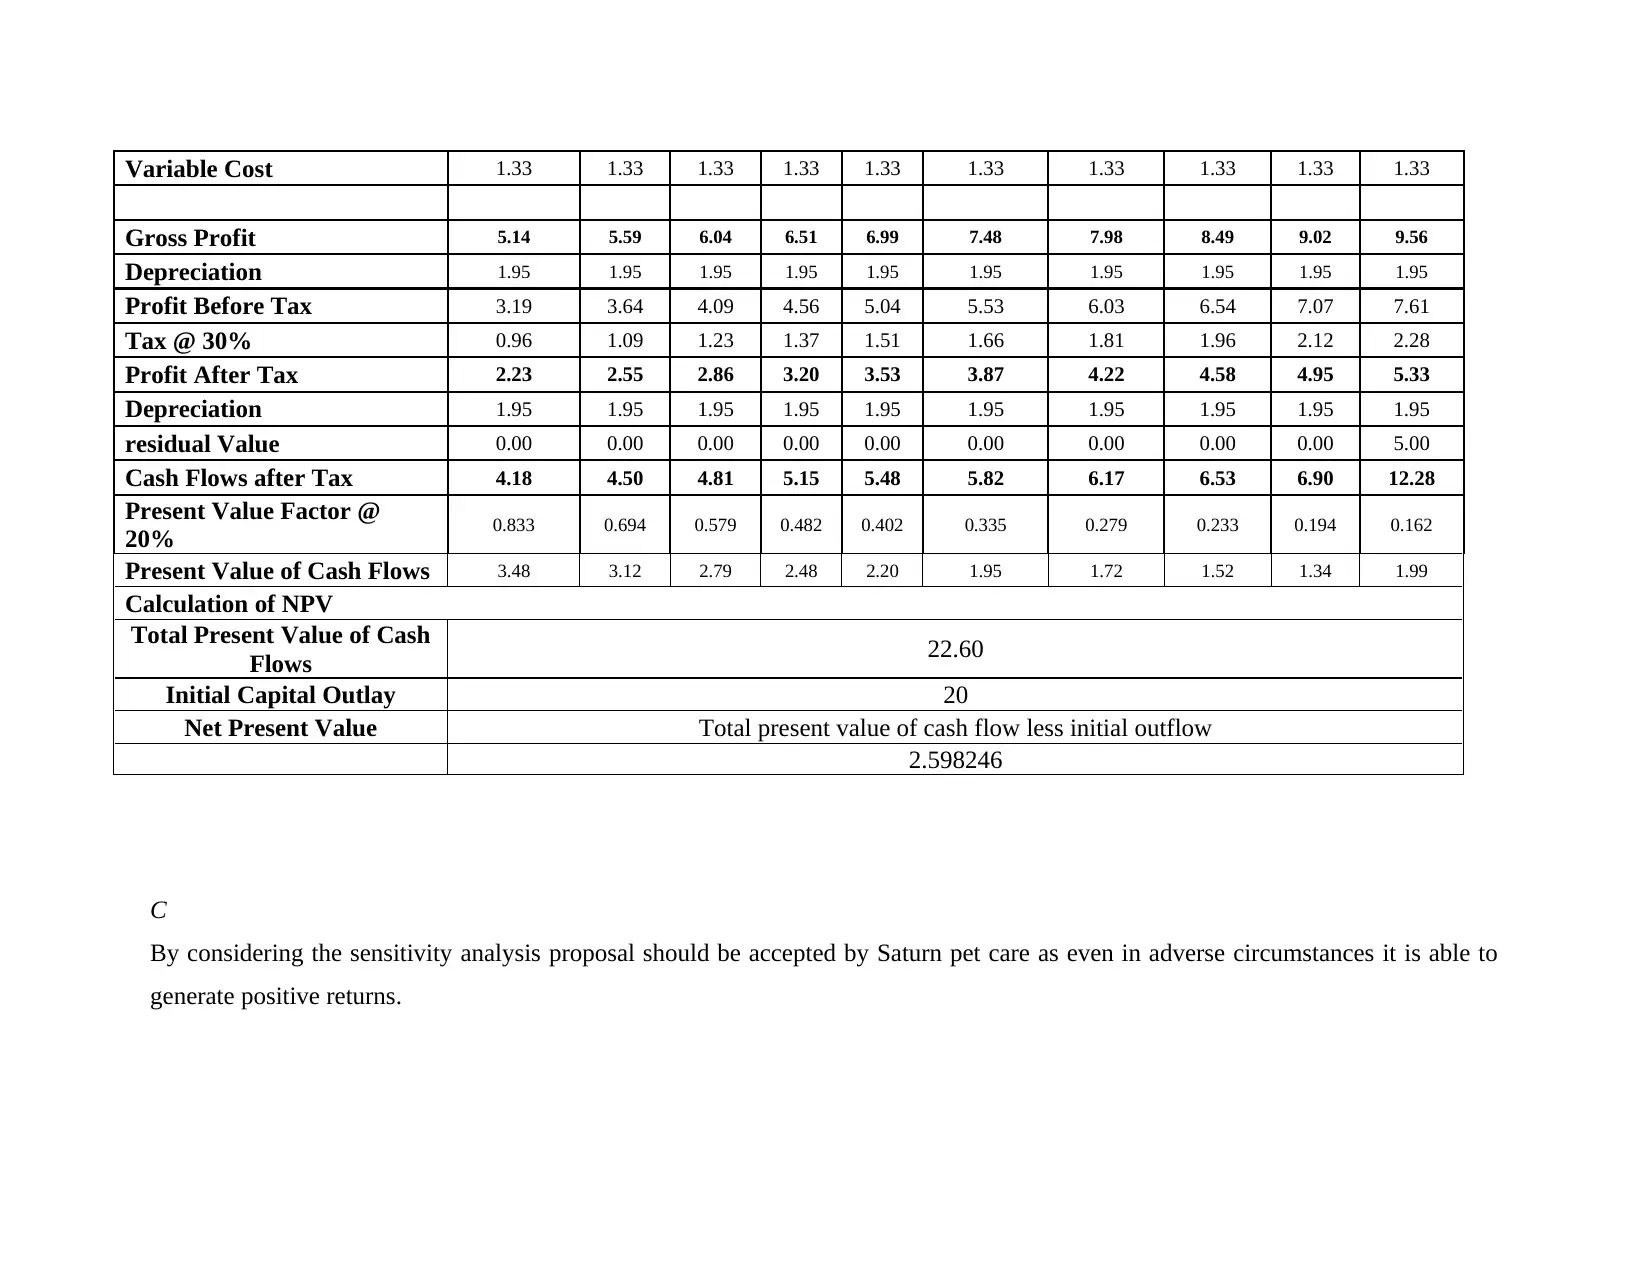
Variable Cost 1.33 1.33 1.33 1.33 1.33 1.33 1.33 1.33 1.33 1.33
Gross Profit 5.14 5.59 6.04 6.51 6.99 7.48 7.98 8.49 9.02 9.56
Depreciation 1.95 1.95 1.95 1.95 1.95 1.95 1.95 1.95 1.95 1.95
Profit Before Tax 3.19 3.64 4.09 4.56 5.04 5.53 6.03 6.54 7.07 7.61
Tax @ 30% 0.96 1.09 1.23 1.37 1.51 1.66 1.81 1.96 2.12 2.28
Profit After Tax 2.23 2.55 2.86 3.20 3.53 3.87 4.22 4.58 4.95 5.33
Depreciation 1.95 1.95 1.95 1.95 1.95 1.95 1.95 1.95 1.95 1.95
residual Value 0.00 0.00 0.00 0.00 0.00 0.00 0.00 0.00 0.00 5.00
Cash Flows after Tax 4.18 4.50 4.81 5.15 5.48 5.82 6.17 6.53 6.90 12.28
Present Value Factor @
20% 0.833 0.694 0.579 0.482 0.402 0.335 0.279 0.233 0.194 0.162
Present Value of Cash Flows 3.48 3.12 2.79 2.48 2.20 1.95 1.72 1.52 1.34 1.99
Calculation of NPV
Total Present Value of Cash
Flows 22.60
Initial Capital Outlay 20
Net Present Value Total present value of cash flow less initial outflow
2.598246
C
By considering the sensitivity analysis proposal should be accepted by Saturn pet care as even in adverse circumstances it is able to
generate positive returns.
Paraphrase This Document
Need a fresh take? Get an instant paraphrase of this document with our AI Paraphraser
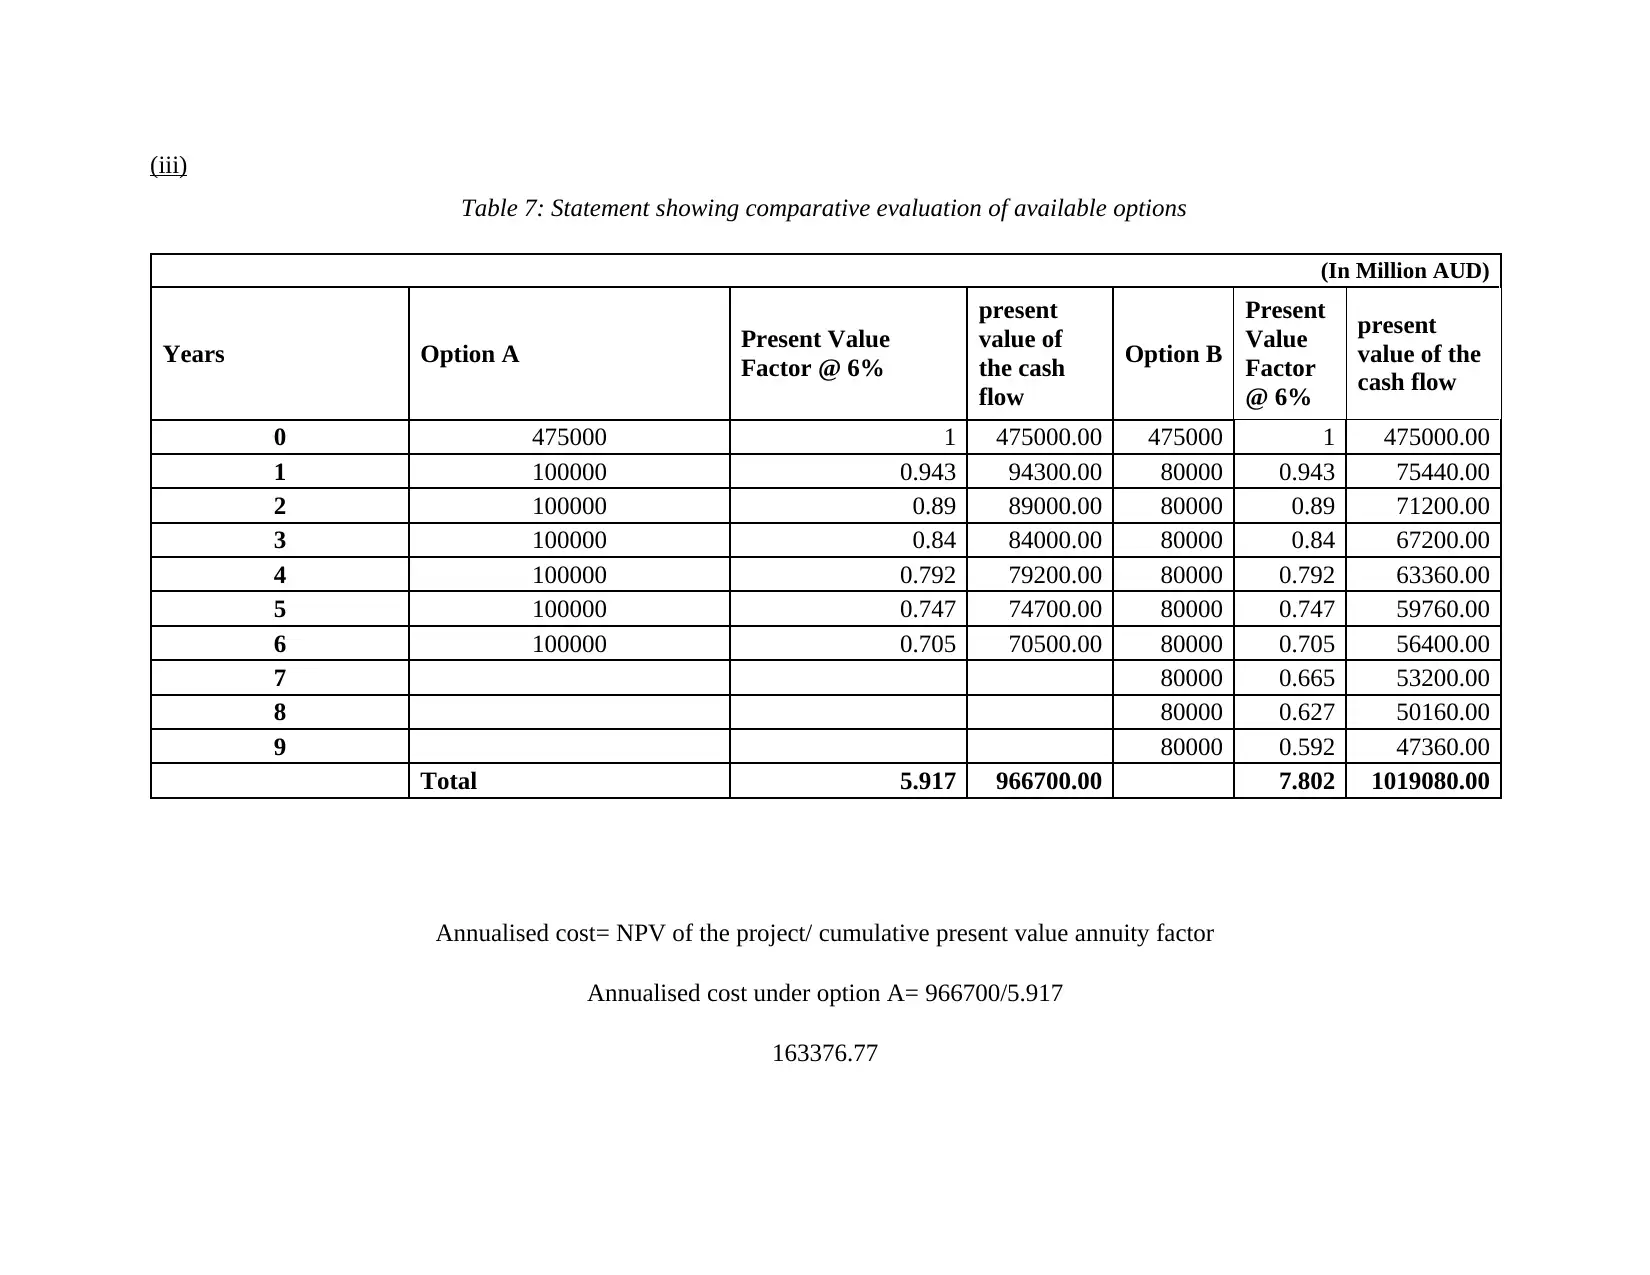
(iii)
Table 7: Statement showing comparative evaluation of available options
(In Million AUD)
Years Option A Present Value
Factor @ 6%
present
value of
the cash
flow
Option B
Present
Value
Factor
@ 6%
present
value of the
cash flow
0 475000 1 475000.00 475000 1 475000.00
1 100000 0.943 94300.00 80000 0.943 75440.00
2 100000 0.89 89000.00 80000 0.89 71200.00
3 100000 0.84 84000.00 80000 0.84 67200.00
4 100000 0.792 79200.00 80000 0.792 63360.00
5 100000 0.747 74700.00 80000 0.747 59760.00
6 100000 0.705 70500.00 80000 0.705 56400.00
7 80000 0.665 53200.00
8 80000 0.627 50160.00
9 80000 0.592 47360.00
Total 5.917 966700.00 7.802 1019080.00
Annualised cost= NPV of the project/ cumulative present value annuity factor
Annualised cost under option A= 966700/5.917
163376.77
Annualised cost under option B= 1019080/7.802
130617.79
By considering the analysis, it can be noticed that project A is more beneficial in comparison to project B.
130617.79
By considering the analysis, it can be noticed that project A is more beneficial in comparison to project B.
⊘ This is a preview!⊘
Do you want full access?
Subscribe today to unlock all pages.
Trusted by 1+ million students worldwide
PART B
Executive summary
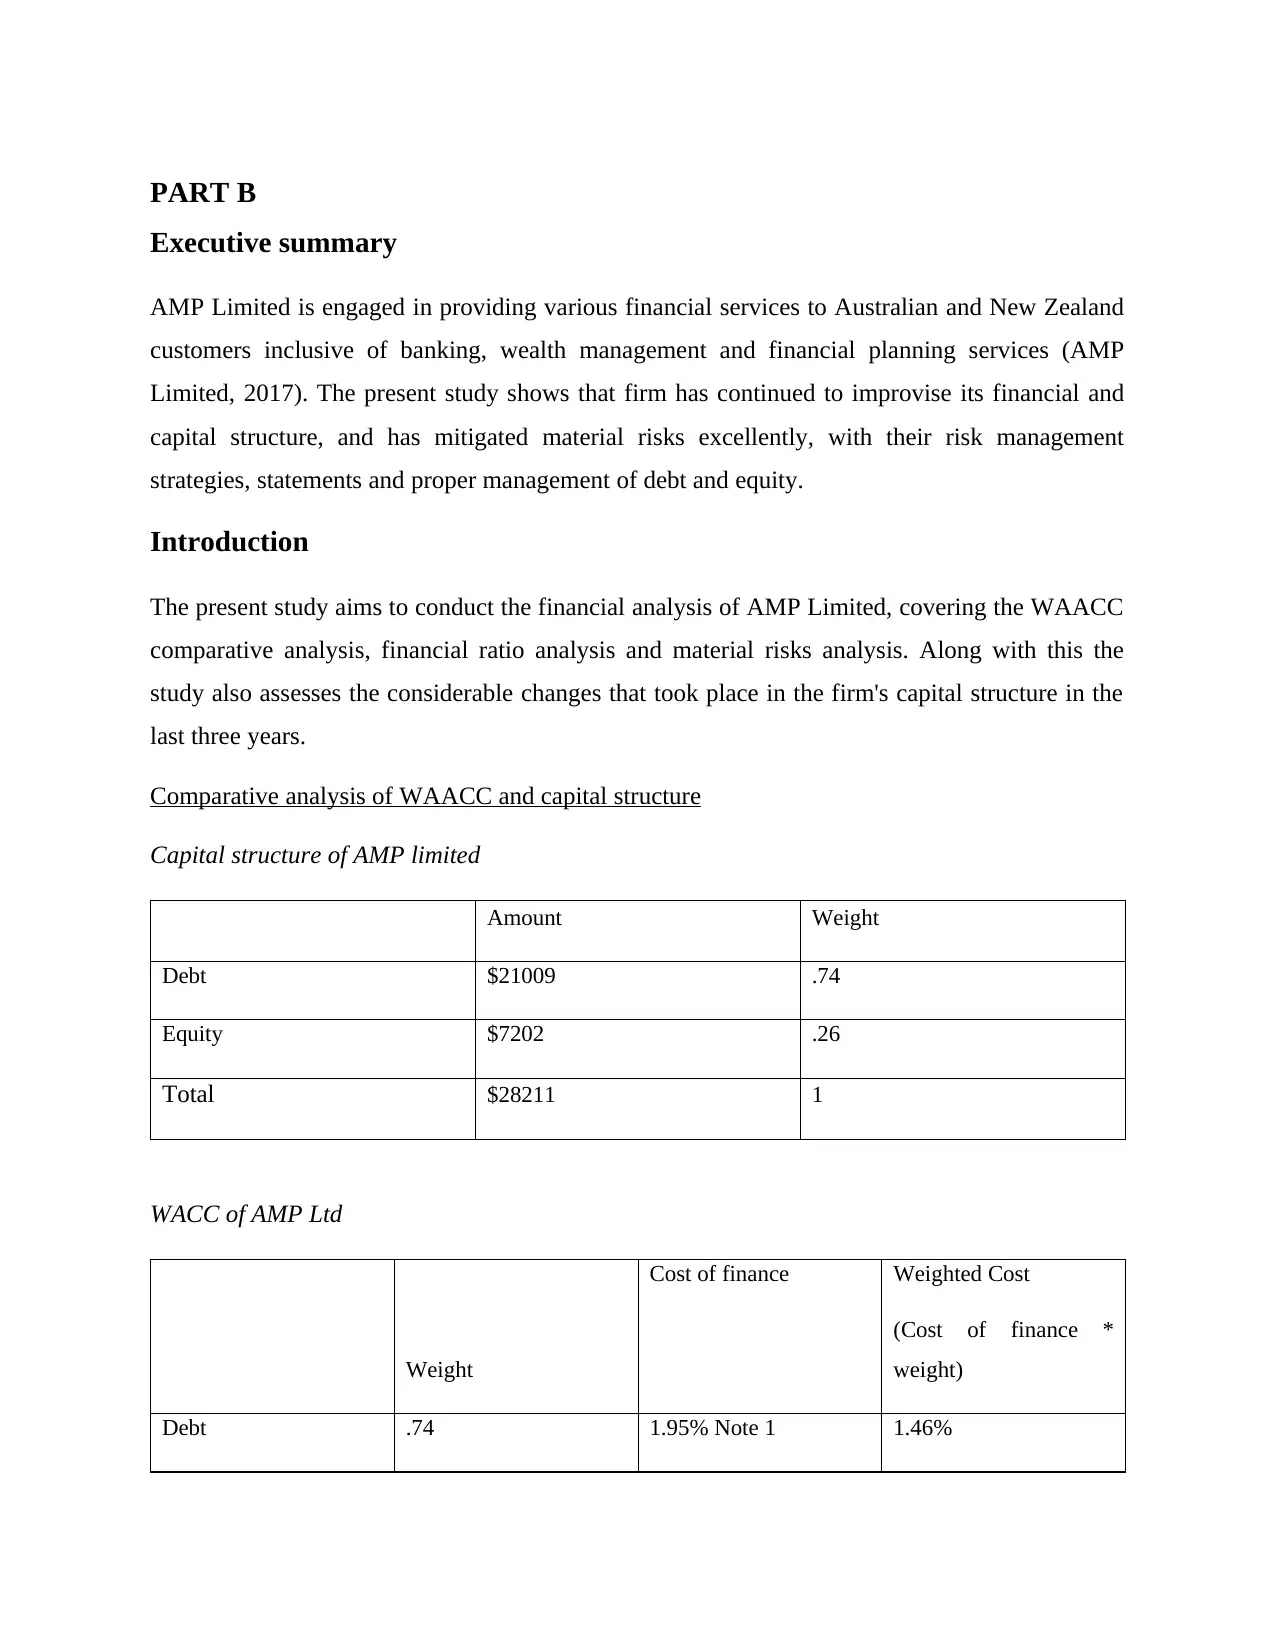
AMP Limited is engaged in providing various financial services to Australian and New Zealand
customers inclusive of banking, wealth management and financial planning services (AMP
Limited, 2017). The present study shows that firm has continued to improvise its financial and
capital structure, and has mitigated material risks excellently, with their risk management
strategies, statements and proper management of debt and equity.
Introduction
The present study aims to conduct the financial analysis of AMP Limited, covering the WAACC
comparative analysis, financial ratio analysis and material risks analysis. Along with this the
study also assesses the considerable changes that took place in the firm's capital structure in the
last three years.
Comparative analysis of WAACC and capital structure
Capital structure of AMP limited
Amount Weight
Debt $21009 .74
Equity $7202 .26
Total $28211 1
WACC of AMP Ltd
Weight
Cost of finance Weighted Cost
(Cost of finance *
weight)
Debt .74 1.95% Note 1 1.46%
Executive summary
AMP Limited is engaged in providing various financial services to Australian and New Zealand
customers inclusive of banking, wealth management and financial planning services (AMP
Limited, 2017). The present study shows that firm has continued to improvise its financial and
capital structure, and has mitigated material risks excellently, with their risk management
strategies, statements and proper management of debt and equity.
Introduction
The present study aims to conduct the financial analysis of AMP Limited, covering the WAACC
comparative analysis, financial ratio analysis and material risks analysis. Along with this the
study also assesses the considerable changes that took place in the firm's capital structure in the
last three years.
Comparative analysis of WAACC and capital structure
Capital structure of AMP limited
Amount Weight
Debt $21009 .74
Equity $7202 .26
Total $28211 1
WACC of AMP Ltd
Weight
Cost of finance Weighted Cost
(Cost of finance *
weight)
Debt .74 1.95% Note 1 1.46%
Paraphrase This Document
Need a fresh take? Get an instant paraphrase of this document with our AI Paraphraser
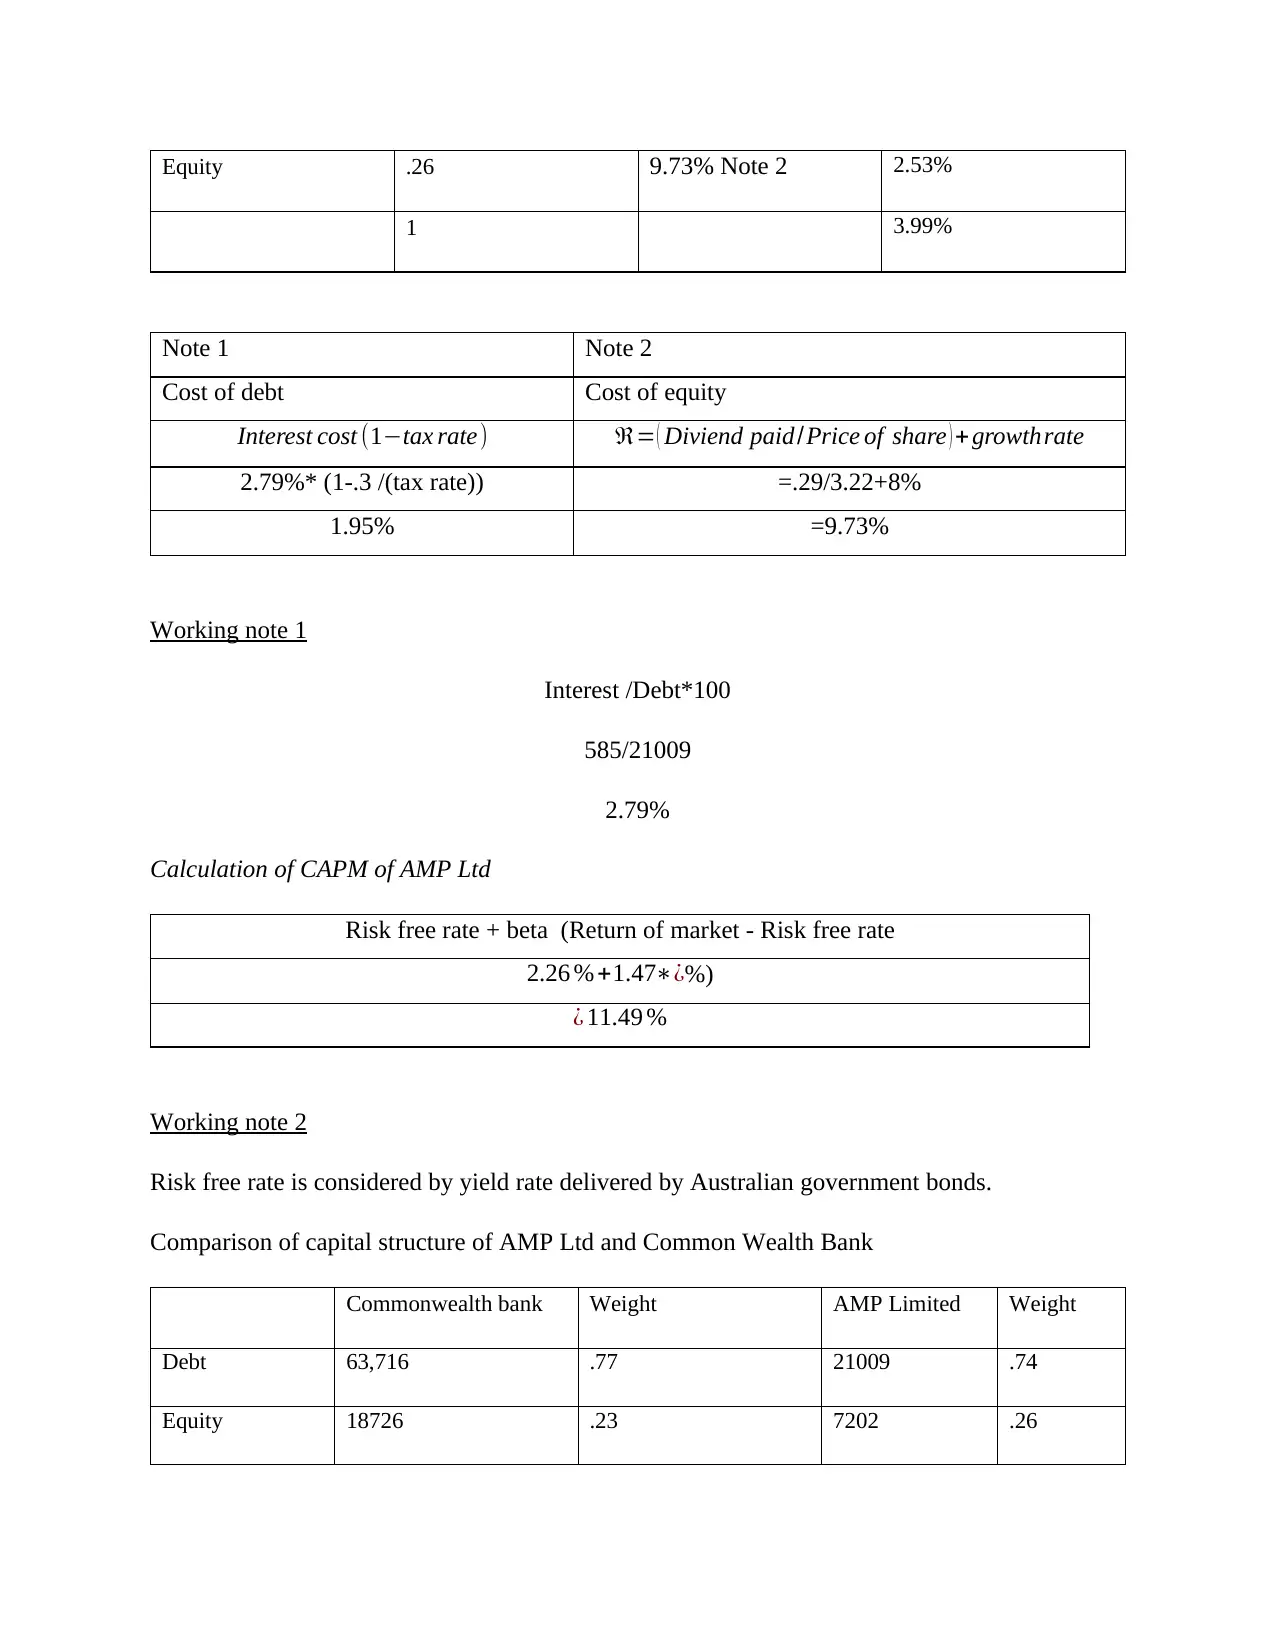
Equity .26 9.73% Note 2 2.53%
1 3.99%
Note 1 Note 2
Cost of debt Cost of equity
Interest cost (1−tax rate) ℜ= ( Diviend paid/Price of share ) + growthrate
2.79%* (1-.3 /(tax rate)) =.29/3.22+8%
1.95% =9.73%
Working note 1
Interest /Debt*100
585/21009
2.79%
Calculation of CAPM of AMP Ltd
Risk free rate + beta (Return of market - Risk free rate
2.26 % +1.47∗¿%)
¿ 11.49 %
Working note 2
Risk free rate is considered by yield rate delivered by Australian government bonds.
Comparison of capital structure of AMP Ltd and Common Wealth Bank
Commonwealth bank Weight AMP Limited Weight
Debt 63,716 .77 21009 .74
Equity 18726 .23 7202 .26
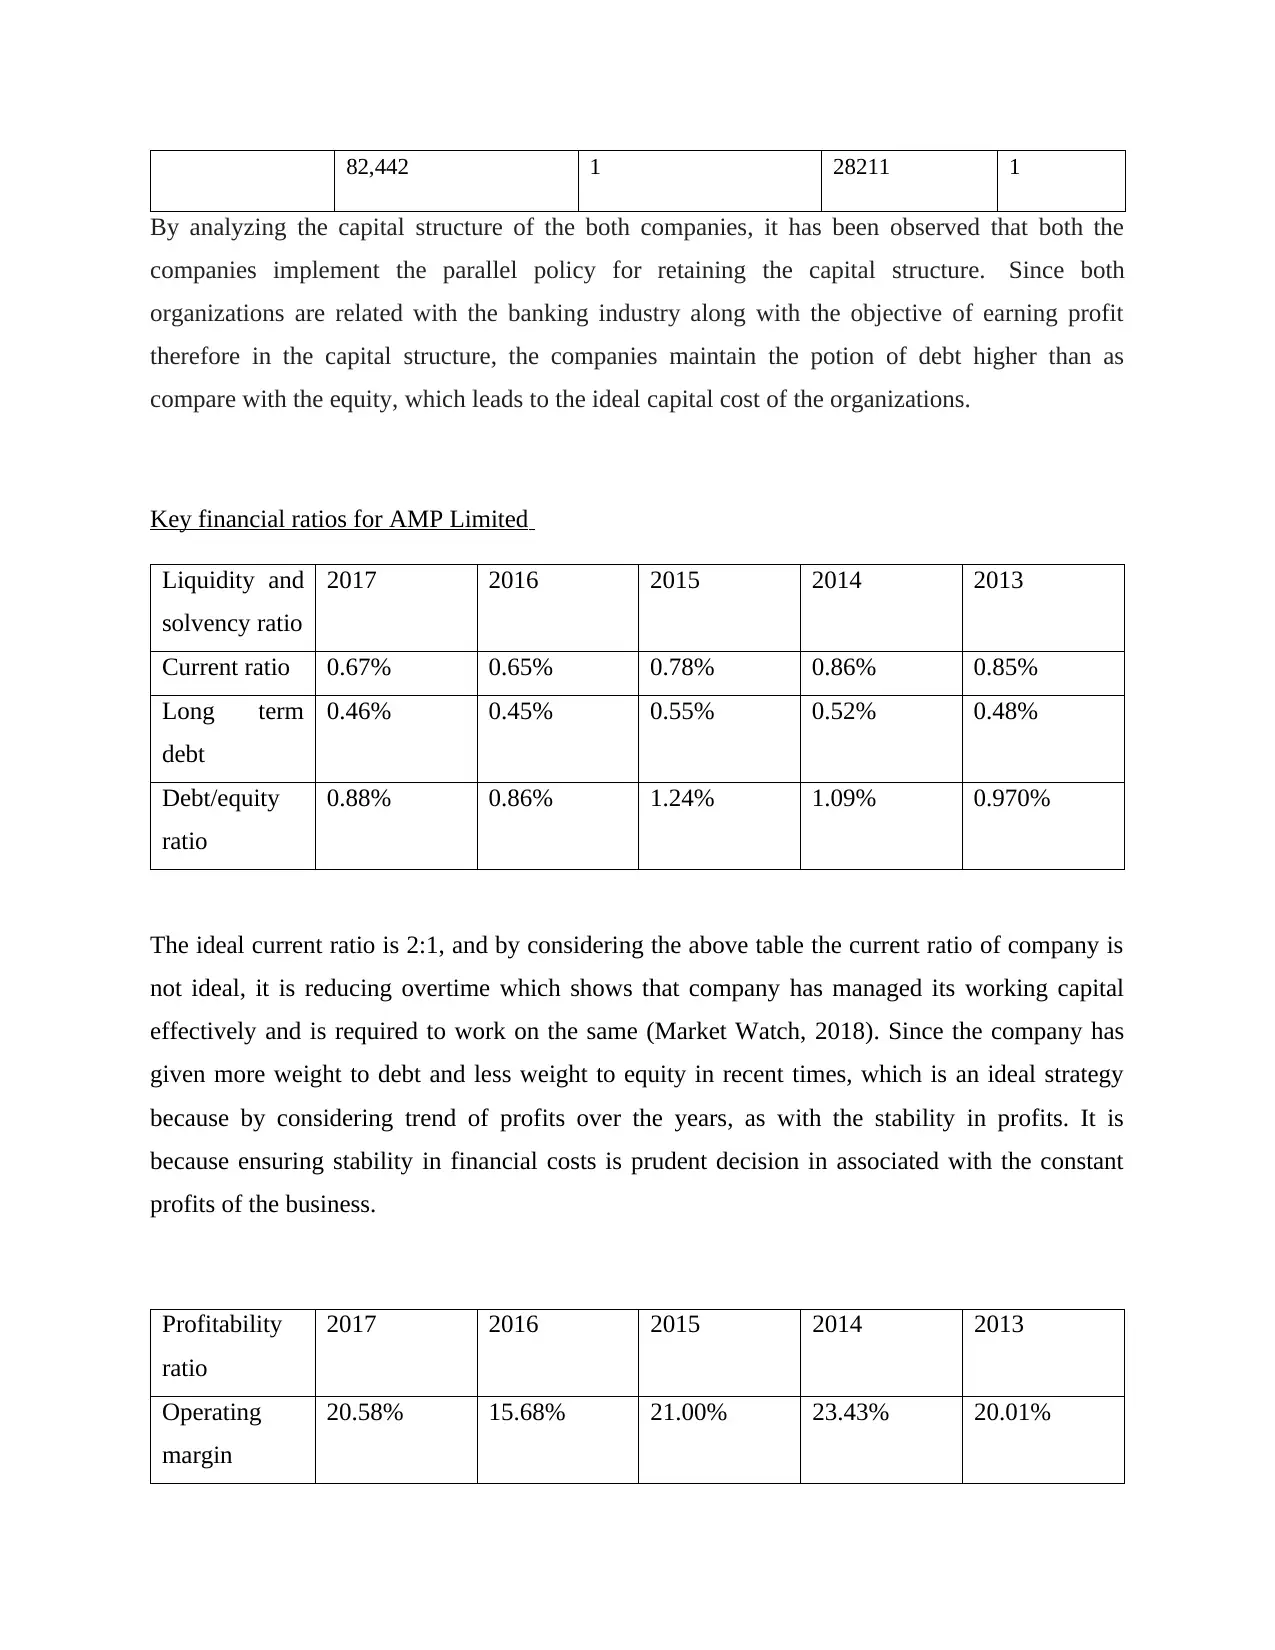
82,442 1 28211 1
By analyzing the capital structure of the both companies, it has been observed that both the
companies implement the parallel policy for retaining the capital structure. Since both
organizations are related with the banking industry along with the objective of earning profit
therefore in the capital structure, the companies maintain the potion of debt higher than as
compare with the equity, which leads to the ideal capital cost of the organizations.
Key financial ratios for AMP Limited
Liquidity and
solvency ratio
2017 2016 2015 2014 2013
Current ratio 0.67% 0.65% 0.78% 0.86% 0.85%
Long term
debt
0.46% 0.45% 0.55% 0.52% 0.48%
Debt/equity
ratio
0.88% 0.86% 1.24% 1.09% 0.970%
The ideal current ratio is 2:1, and by considering the above table the current ratio of company is
not ideal, it is reducing overtime which shows that company has managed its working capital
effectively and is required to work on the same (Market Watch, 2018). Since the company has
given more weight to debt and less weight to equity in recent times, which is an ideal strategy
because by considering trend of profits over the years, as with the stability in profits. It is
because ensuring stability in financial costs is prudent decision in associated with the constant
profits of the business.
Profitability
ratio
2017 2016 2015 2014 2013
Operating
margin
20.58% 15.68% 21.00% 23.43% 20.01%
⊘ This is a preview!⊘
Do you want full access?
Subscribe today to unlock all pages.
Trusted by 1+ million students worldwide
1 out of 16


Your All-in-One AI-Powered Toolkit for Academic Success.
+13062052269
info@desklib.com
Available 24*7 on WhatsApp / Email
![[object Object]](/_next/static/media/star-bottom.7253800d.svg)
Unlock your academic potential
Copyright © 2020–2026 A2Z Services. All Rights Reserved. Developed and managed by ZUCOL.