Comprehensive Report: SML, CML, CAPM, and Portfolio Management
VerifiedAdded on 2020/10/23
|10
|2691
|469
Report
AI Summary
This report provides a detailed analysis of the Security Market Line (SML) and Capital Market Line (CML), essential tools for making informed investment decisions. It explains the differences between SML and CML, highlighting how the SML, a graphical representation of the Capital Asset Pricing Model (CAPM), illustrates the relationship between risk and expected return, while the CML focuses on efficient portfolios. The report explores the CAPM, its assumptions, and its formula, emphasizing its role in calculating the required rate of return. It also discusses the importance of minimum variance portfolios in minimizing portfolio risk. Furthermore, the report includes the equations and formulas related to the CML, SML, and CAPM, offering a comprehensive overview of these critical financial concepts and their practical applications in portfolio management and investment strategies.

ACCOUNTS
Paraphrase This Document
Need a fresh take? Get an instant paraphrase of this document with our AI Paraphraser
Table of Contents
INTRODUCTION...........................................................................................................................1
MAIN BODY...................................................................................................................................1
Security Market Line...................................................................................................................1
Capital Market Line....................................................................................................................2
Difference between the SML and CML......................................................................................4
Capital asset pricing model (CAPM)..........................................................................................4
Importance of minimum variance portfolios...............................................................................6
CONCLUSION................................................................................................................................6
REFERENCES................................................................................................................................7
INTRODUCTION
Security market line and capital market line both are essential subject to make
appropriate investment decisions. The management authority are mainly associated with
analysing the best investment decisions and creating the values for best plans and effective
management decision (Ahmed and Zlate, 2014). this report elaborate the scope of capital market
line and security market line. Difference between security market line and Capital market line
are defined subject to incorporate the information and analyse the details for better management
decisions. Importance of Capital Asset Pricing Method equation relevancy is defined, for the
purpose of calculating required rate of return.
MAIN BODY
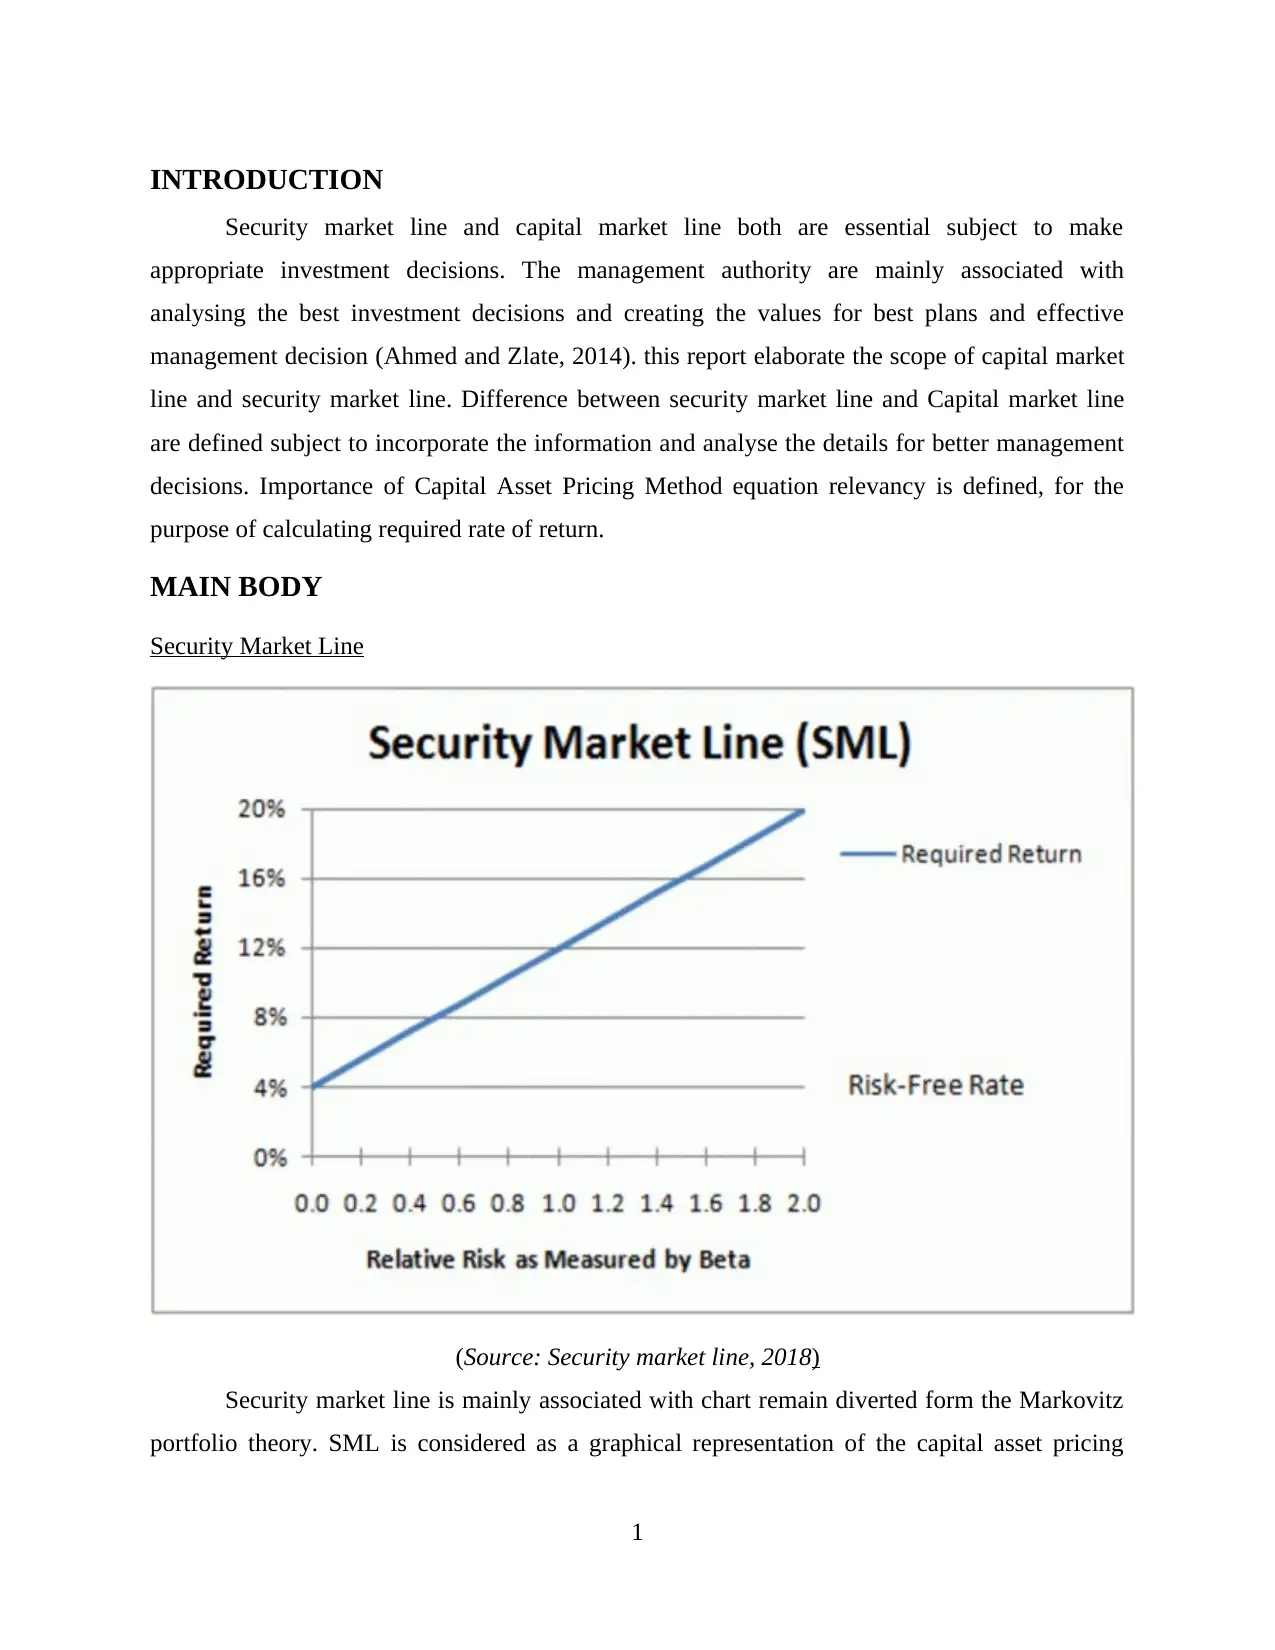
Security Market Line
(Source: Security market line, 2018)
Security market line is mainly associated with chart remain diverted form the Markovitz
portfolio theory. SML is considered as a graphical representation of the capital asset pricing
1
Security market line and capital market line both are essential subject to make
appropriate investment decisions. The management authority are mainly associated with
analysing the best investment decisions and creating the values for best plans and effective
management decision (Ahmed and Zlate, 2014). this report elaborate the scope of capital market
line and security market line. Difference between security market line and Capital market line
are defined subject to incorporate the information and analyse the details for better management
decisions. Importance of Capital Asset Pricing Method equation relevancy is defined, for the
purpose of calculating required rate of return.
MAIN BODY
Security Market Line
(Source: Security market line, 2018)
Security market line is mainly associated with chart remain diverted form the Markovitz
portfolio theory. SML is considered as a graphical representation of the capital asset pricing
1
⊘ This is a preview!⊘
Do you want full access?
Subscribe today to unlock all pages.
Trusted by 1+ million students worldwide
model and it delivers levels of risk against the expected return of the entire market given point in
time. Basically it is used to analyse the position of organisation in security market and the
variation in value, portfolios through global change in policies. The security market line mainly
defines and justify the relations between risk and return is linear subject to individual securities
and the market holdings (Brooks and Mukherjee, 2013). As per this assumption the increased
risk remain equal to increased return. There is a particular data and analysis done regarding the
portfolio. This initially presents the results, what return an investor needs to earn on an
investment in order for it to be worth taking and increase with riskiness of the investment. It is
calculated as per following formula
Required Return = Risk Free Rate + ( Beta x [Market Return - Risk Free Rate])
It is understandable by following instance, suppose an investor is screening a selection of
stock to analyse the best investment plan for getting the returns. As the risk free rate in Australia
is 2% in current time and the S&P 500 is returning approximately 5% and the company has a
beta of 0.6 and a return (including dividend) of 4% annually and the company B has a beta of 1.8
and a return of 7%.
As per above defined example the required rate to invest in company A will be
calculated as follows 2% + ( 0.6 x [5% - 2%] ) = 3.8% and the required rate of return for
Company B is 2% + ( 1.8 x [5% - 2%]) = 7.4%. In the above case example the best option is
identified as Company A due to the return would not be earned is not enough to compensate the
risk which are taking. This is an effective technique which helps in looking at portfolio and stock
choice and treated with caution for various reasons. Rate over the risk free return is not the only
thing to analyse and is deficit the differences and the analysis with objectivity.
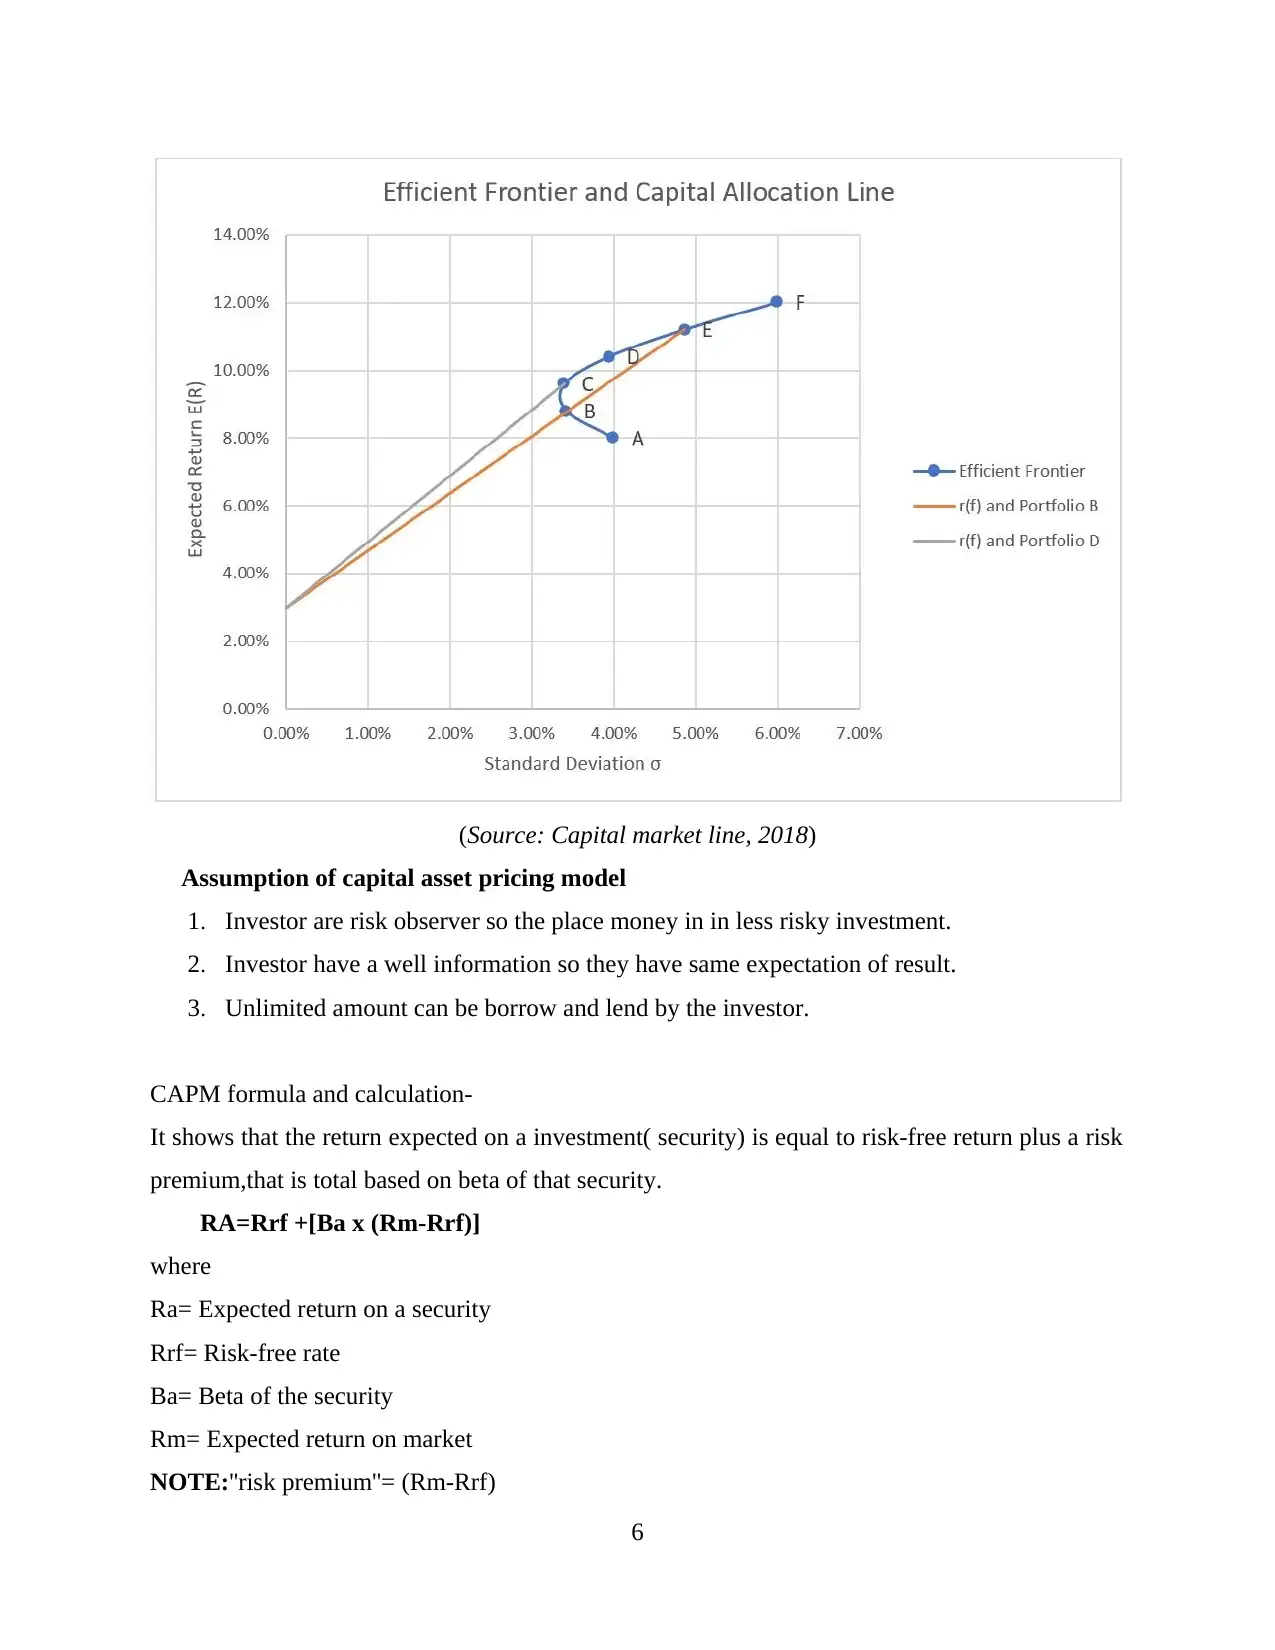
With the help of Security market line method efficient frontier as the CML does. In
equilibrium the equations there is a risk free return mainly refers to a asset or portfolios. It refers
the portfolios on the CML portfolios and the remain differ form the SML slope.
Capital Market Line
Capital market line is a graph which present the results in terms of managing the results
associated with the further earnings and the returns by analysing the expected results. The
graphical presentation mainly associated with examination of a portfolio and the possible
properties between the market portfolio remain consisting for all the possible proportions
between the market portfolio and a risk free asset (Gallati, 2003). Market portfolio remains
2
time. Basically it is used to analyse the position of organisation in security market and the
variation in value, portfolios through global change in policies. The security market line mainly
defines and justify the relations between risk and return is linear subject to individual securities
and the market holdings (Brooks and Mukherjee, 2013). As per this assumption the increased
risk remain equal to increased return. There is a particular data and analysis done regarding the
portfolio. This initially presents the results, what return an investor needs to earn on an
investment in order for it to be worth taking and increase with riskiness of the investment. It is
calculated as per following formula
Required Return = Risk Free Rate + ( Beta x [Market Return - Risk Free Rate])
It is understandable by following instance, suppose an investor is screening a selection of
stock to analyse the best investment plan for getting the returns. As the risk free rate in Australia
is 2% in current time and the S&P 500 is returning approximately 5% and the company has a
beta of 0.6 and a return (including dividend) of 4% annually and the company B has a beta of 1.8
and a return of 7%.
As per above defined example the required rate to invest in company A will be
calculated as follows 2% + ( 0.6 x [5% - 2%] ) = 3.8% and the required rate of return for
Company B is 2% + ( 1.8 x [5% - 2%]) = 7.4%. In the above case example the best option is
identified as Company A due to the return would not be earned is not enough to compensate the
risk which are taking. This is an effective technique which helps in looking at portfolio and stock
choice and treated with caution for various reasons. Rate over the risk free return is not the only
thing to analyse and is deficit the differences and the analysis with objectivity.
With the help of Security market line method efficient frontier as the CML does. In
equilibrium the equations there is a risk free return mainly refers to a asset or portfolios. It refers
the portfolios on the CML portfolios and the remain differ form the SML slope.
Capital Market Line
Capital market line is a graph which present the results in terms of managing the results
associated with the further earnings and the returns by analysing the expected results. The
graphical presentation mainly associated with examination of a portfolio and the possible
properties between the market portfolio remain consisting for all the possible proportions
between the market portfolio and a risk free asset (Gallati, 2003). Market portfolio remains
2
Paraphrase This Document
Need a fresh take? Get an instant paraphrase of this document with our AI Paraphraser
completely different carried out only systematic risk and the expected return remain equal to the
anticipated market return. The equation stands for E(Rc) = y × E(RM) + (1 – y) × RF. There is a
portion of market portfolios where E(RM) an expected return of a market portfolio, (1-Y) is a
portion of a risk free asset and R is a risk free rate.
Capital market line is considered as a graph of the required return and risk which is
measured by standards deviations subject to a portfolio and the risk free asset and a hoop of most
contingent and risky assets. There is a proper review of the article on risk and return to obtain an
understanding the portfolio expected return and the portfolio standard deviation and helps in
using the efficient frontier.
There is a well diversified portfolio off risky assets and the zero unsystematic risk are
considered as Zero (Henriques and Richardson, 2013). Global minimum variance portfolio and
the investor are some options provided to investors in terms of borrowing and lend at risk free
rate. It is created as an asset which is allocated with a mix of a the risk free asset and the
portfolio risk portfolio. It is considered as an asset which remain sited at risk free rate and the
portfolio of risk can be determined using the following formula as E(R) = w1 * rf + (1- wr) * rp.
This mainly helps in managing the operations and management for better operations and
management of authorities and the reliabilities in terms of investment plans. It is associated with
analysing the managing the determination of investment plans.
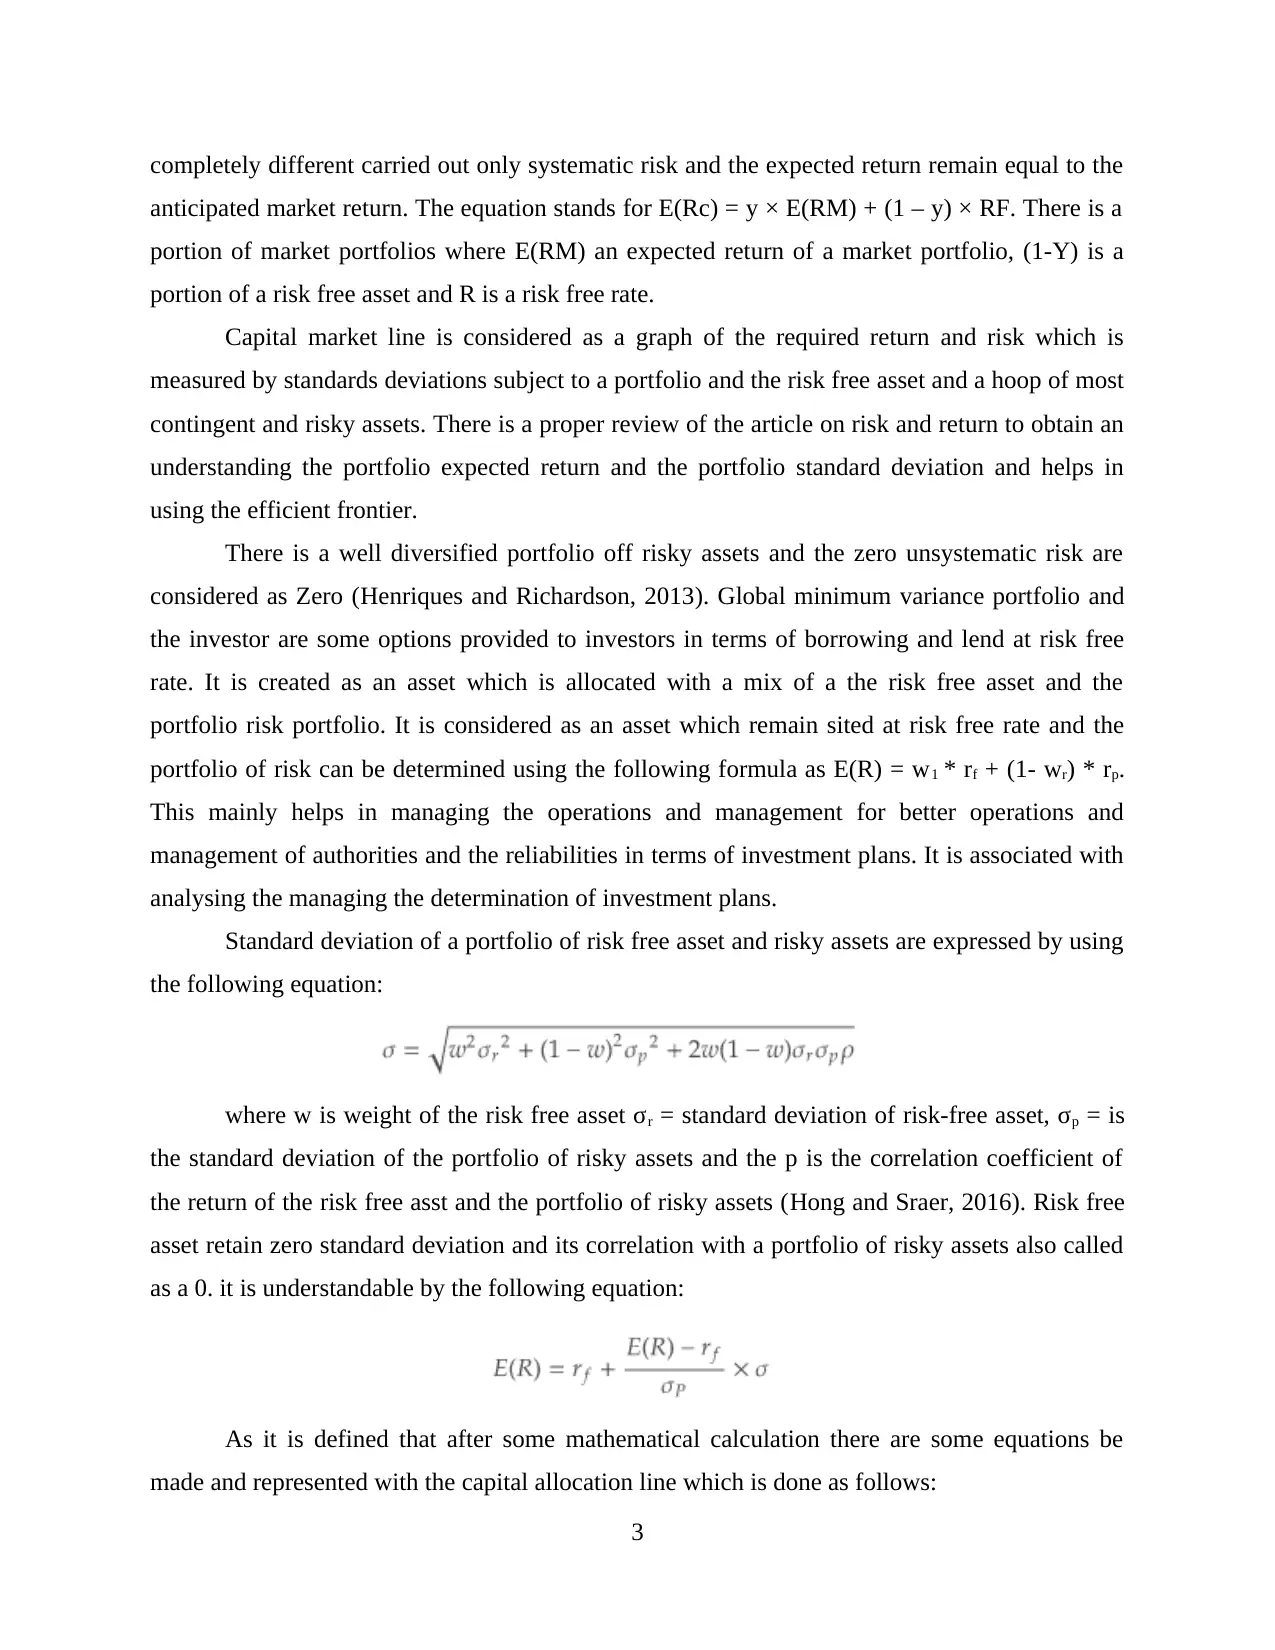
Standard deviation of a portfolio of risk free asset and risky assets are expressed by using
the following equation:
where w is weight of the risk free asset σr = standard deviation of risk-free asset, σp = is
the standard deviation of the portfolio of risky assets and the p is the correlation coefficient of
the return of the risk free asst and the portfolio of risky assets (Hong and Sraer, 2016). Risk free
asset retain zero standard deviation and its correlation with a portfolio of risky assets also called
as a 0. it is understandable by the following equation:
As it is defined that after some mathematical calculation there are some equations be
made and represented with the capital allocation line which is done as follows:
3
anticipated market return. The equation stands for E(Rc) = y × E(RM) + (1 – y) × RF. There is a
portion of market portfolios where E(RM) an expected return of a market portfolio, (1-Y) is a
portion of a risk free asset and R is a risk free rate.
Capital market line is considered as a graph of the required return and risk which is
measured by standards deviations subject to a portfolio and the risk free asset and a hoop of most
contingent and risky assets. There is a proper review of the article on risk and return to obtain an
understanding the portfolio expected return and the portfolio standard deviation and helps in
using the efficient frontier.
There is a well diversified portfolio off risky assets and the zero unsystematic risk are
considered as Zero (Henriques and Richardson, 2013). Global minimum variance portfolio and
the investor are some options provided to investors in terms of borrowing and lend at risk free
rate. It is created as an asset which is allocated with a mix of a the risk free asset and the
portfolio risk portfolio. It is considered as an asset which remain sited at risk free rate and the
portfolio of risk can be determined using the following formula as E(R) = w1 * rf + (1- wr) * rp.
This mainly helps in managing the operations and management for better operations and
management of authorities and the reliabilities in terms of investment plans. It is associated with
analysing the managing the determination of investment plans.
Standard deviation of a portfolio of risk free asset and risky assets are expressed by using
the following equation:
where w is weight of the risk free asset σr = standard deviation of risk-free asset, σp = is
the standard deviation of the portfolio of risky assets and the p is the correlation coefficient of
the return of the risk free asst and the portfolio of risky assets (Hong and Sraer, 2016). Risk free
asset retain zero standard deviation and its correlation with a portfolio of risky assets also called
as a 0. it is understandable by the following equation:
As it is defined that after some mathematical calculation there are some equations be
made and represented with the capital allocation line which is done as follows:
3
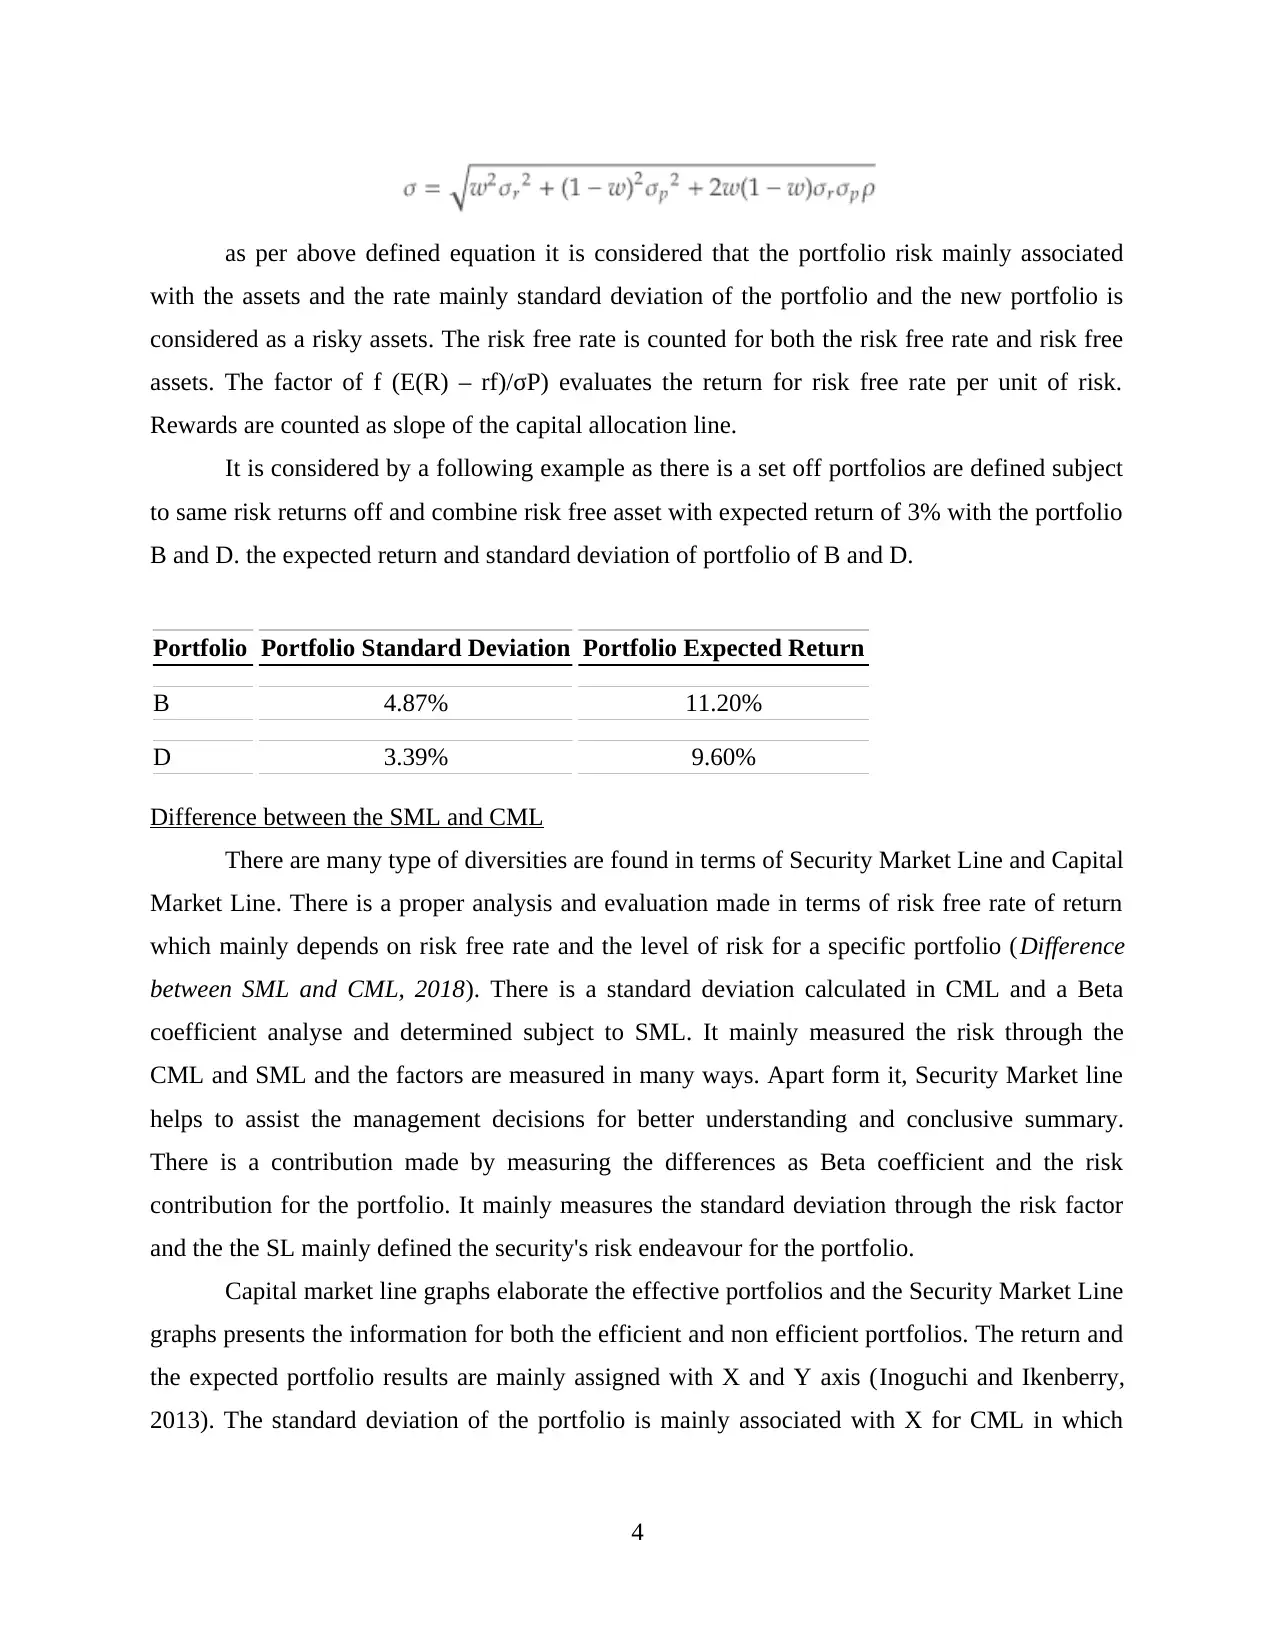
as per above defined equation it is considered that the portfolio risk mainly associated
with the assets and the rate mainly standard deviation of the portfolio and the new portfolio is
considered as a risky assets. The risk free rate is counted for both the risk free rate and risk free
assets. The factor of f (E(R) – rf)/σP) evaluates the return for risk free rate per unit of risk.
Rewards are counted as slope of the capital allocation line.
It is considered by a following example as there is a set off portfolios are defined subject
to same risk returns off and combine risk free asset with expected return of 3% with the portfolio
B and D. the expected return and standard deviation of portfolio of B and D.
Portfolio Portfolio Standard Deviation Portfolio Expected Return
B 4.87% 11.20%
D 3.39% 9.60%
Difference between the SML and CML
There are many type of diversities are found in terms of Security Market Line and Capital
Market Line. There is a proper analysis and evaluation made in terms of risk free rate of return
which mainly depends on risk free rate and the level of risk for a specific portfolio (Difference
between SML and CML, 2018). There is a standard deviation calculated in CML and a Beta
coefficient analyse and determined subject to SML. It mainly measured the risk through the
CML and SML and the factors are measured in many ways. Apart form it, Security Market line
helps to assist the management decisions for better understanding and conclusive summary.
There is a contribution made by measuring the differences as Beta coefficient and the risk
contribution for the portfolio. It mainly measures the standard deviation through the risk factor
and the the SL mainly defined the security's risk endeavour for the portfolio.
Capital market line graphs elaborate the effective portfolios and the Security Market Line
graphs presents the information for both the efficient and non efficient portfolios. The return and
the expected portfolio results are mainly assigned with X and Y axis (Inoguchi and Ikenberry,
2013). The standard deviation of the portfolio is mainly associated with X for CML in which
4
⊘ This is a preview!⊘
Do you want full access?
Subscribe today to unlock all pages.
Trusted by 1+ million students worldwide
Beta of security along the X for SML is counted. CML defines the expected rate of returns for
individual assets and also determines the risk of return for individual stocks.
In summarised form it is considered that the expected return Beta are counted in
systematic risk space and standard deviation mainly considered as deviation in Capital Market
Line. CAPM model mainly considered in CML that represents relations between the efficient
portfolio and the total risk associated with the management decisions.
Capital asset pricing model (CAPM)
The capital assets pricing model (CAPM) is a method which makes easy for the investor
as it actually describe the relation between the risk of investing in a security and expected result
coming from out. It helps investor in calculating risk related to the particular investment and
what type of exact return they should expect (Jordan, Miller and Yüce, 2008). It is more often
used to identify the fair price of an investment arising in the market. Basically, according to this
capital pricing model the investor must be compensated in two major ways : time value of
money and risk factor. The time value of money means that the value of amount that is involved
in a investment today will worth more than the value of the same amount in the future. Therefore
investor make a complete study of market before employing a certain sum of money in a
particular investment over a period of time.
5
Paraphrase This Document
Need a fresh take? Get an instant paraphrase of this document with our AI Paraphraser
(Source: Capital market line, 2018)
Assumption of capital asset pricing model
1. Investor are risk observer so the place money in in less risky investment.
2. Investor have a well information so they have same expectation of result.
3. Unlimited amount can be borrow and lend by the investor.
CAPM formula and calculation-
It shows that the return expected on a investment( security) is equal to risk-free return plus a risk
premium,that is total based on beta of that security.
RA=Rrf +[Ba x (Rm-Rrf)]
where
Ra= Expected return on a security
Rrf= Risk-free rate
Ba= Beta of the security
Rm= Expected return on market
NOTE:''risk premium''= (Rm-Rrf)
6
CAPM equation might be more relevant than other equations when calculating required rate of
return because:
1. Easy of use: CAPM has simply calculation that can easily memorised and gives possible
outcome to provide best required rate of return.
2. Systematic risk (beta): there are many model which left out systematic or market risk
(beta) which is very important variable for any of the investment ,so CAPM takes these
systematic risk
3. Business and financial risk variability: whenever there is a situation arise of business
expanding ,the current business situation and financial situation differ from each other .
so to calculate required return CAPM can be applied than any other model.
Comparison of CAPM with Dividend growth model
It is considered that the dividend discount model and the capital asset pricing model
which are two methods for evaluative the value in respect of investments. As DDM depends
upon dividend a share of stock and the CAPM measures the risk and returns compared to the
market average. This is the main reason that CAPM preferred to calculate expected rate of
return.
Importance of minimum variance portfolios
It is considered as a spread of investments with the lowest volatilities and the least to
fluctuate in price because the it contains lowest sensitivity risk (Milkovich, Newman and
Milkovich, 2002). It mainly assigns weight to asset in a way that portfolio risk is minimised and
the MVP is evaluated at lower risk.
It is showed in terms of managing the operations and effective engagement of investment
and plans. It is mainly defined subject to determine the capital line and the market risk for
deriving the return at a given time. Major difference between the SML and CML is how
risk factors and the associated rate are measured.
It also offers the best effective and risk free trade off. It is mainly related to the capital
allocation and the line used in organisational context to line up the Sharpe ratios.
There is a significant point is considered as an efficient and effective portion for
developing the strategies and the plans in more effective and contingent way.
7
⊘ This is a preview!⊘
Do you want full access?
Subscribe today to unlock all pages.
Trusted by 1+ million students worldwide
CONCLUSION
Security market line and capital market line concept is summarised in above report. By
evaluating the concept it is considered that efficient portfolios are evaluated on the basis of
Capital Market line and the both the efficient and non efficient portfolios are evaluated on the
basis of capital market line. There is a particular evaluation of portfolio analysed by using both
the methods. It is concluded that CAPM is reliable in terms of analysing the investment plans.
8
1 out of 10
Related Documents


Your All-in-One AI-Powered Toolkit for Academic Success.
+13062052269
info@desklib.com
Available 24*7 on WhatsApp / Email
![[object Object]](/_next/static/media/star-bottom.7253800d.svg)
Unlock your academic potential
Copyright © 2020–2026 A2Z Services. All Rights Reserved. Developed and managed by ZUCOL.