CML, SML, and Minimum Variance Portfolios: A Finance Report
VerifiedAdded on 2021/05/31
|8
|2333
|32
Report
AI Summary
This report provides a detailed comparison of the Capital Market Line (CML) and the Security Market Line (SML), highlighting their graphical representations, risk measurement methodologies, and portfolio performance evaluations. It then explores the concept and importance of Minimum Variance Portfolios (MVP), emphasizing their role in reducing portfolio price instability and minimizing risk for investors, especially those averse to high risks. The report explains how MVPs aim to achieve better-than-expected performance by focusing on underpriced assets and minimizing volatility. Finally, the report discusses the Capital Asset Pricing Model (CAPM) and its equation, explaining why it's considered more relevant than other equations for calculating the required rate of return, particularly when dealing with varying project risks and investment decisions, and considering its advantages over other methods such as WACC and dividend growth models. The report emphasizes the CAPM's ability to incorporate systematic risk and provide a theoretically derived link between risk and return.
Explain and graphically depict how Security Market Line (SML) is different from
Capital Market Line (CML). Identify and discuss the importance of minimum variance
portfolios?Why CAPM equation might be more relevant than other equations when
calculating required rate of return.
CML is the abbreviated version of Capital Market Line and SML stands for Security Market
Line. Both these lines are basically the graphical representation of the Capital Asset Pricing
Model (CAPM). The capital market theory reveals a crucial step towards how stakeholders
should ponder over their investment procedures. Further to this, it is the CAPM which
furthers down the capital market theory in a manner which permits investors to examine the
risk-return trade-off for both diversified portfolios as well as single securities. It is the CAPM
which utilises the SML and CML. However both of these lines are very different both
graphically as well as conceptually. The under mentioned paragraph would enable detailing
about the difference between the SML and CML.
The CML is the line that reveals the rate of returns, that is dependent upon rates of return
which is free from all risks and levels of risk for a particular portfolio. Whereas SML which
is also connoted as Characteristic Line, is a graphical presentation of the risk which is
prevalent in the market and the return at a particular time. Another difference between the
two terms is the methodology of measuring risk factors. CML measures the risk factor by the
method of standard deviation or via the total risk factor whereas the SML measures the risk
factor with the help of Beta Coefficient which enables to search the security’s peril
involvement to the portfolio. The third dissimilarity between the two is that the Capital
Market Line’s graph defines which portfolios are performing well and competent by nature
whereas the Security market Line graph determines both competent as well as non-competent
portfolios (Lee & SU., 2014). CML is a narrowed terminology as it establishes only market
portfolio and those assets which are free from any kind of risks, whereas on the contrary
SML enables determination of all the security variables and factors. In contrast to the Capital
Market Line, the Security Market Line reveals the anticipated returns of the single assets.
Thereby it can be construed that while CML shows the risk and return for the portfolios
which yield good results and are competent by nature, the SML establishes the risk or return
for each and every stock or asset separately (differencebetween.net., 2016). However, as
compared to the Security Market Line with the Capital Market Line, the latter is construed to
be superior when measuring the risk variables.
Paraphrase This Document
Need a fresh take? Get an instant paraphrase of this document with our AI Paraphraser
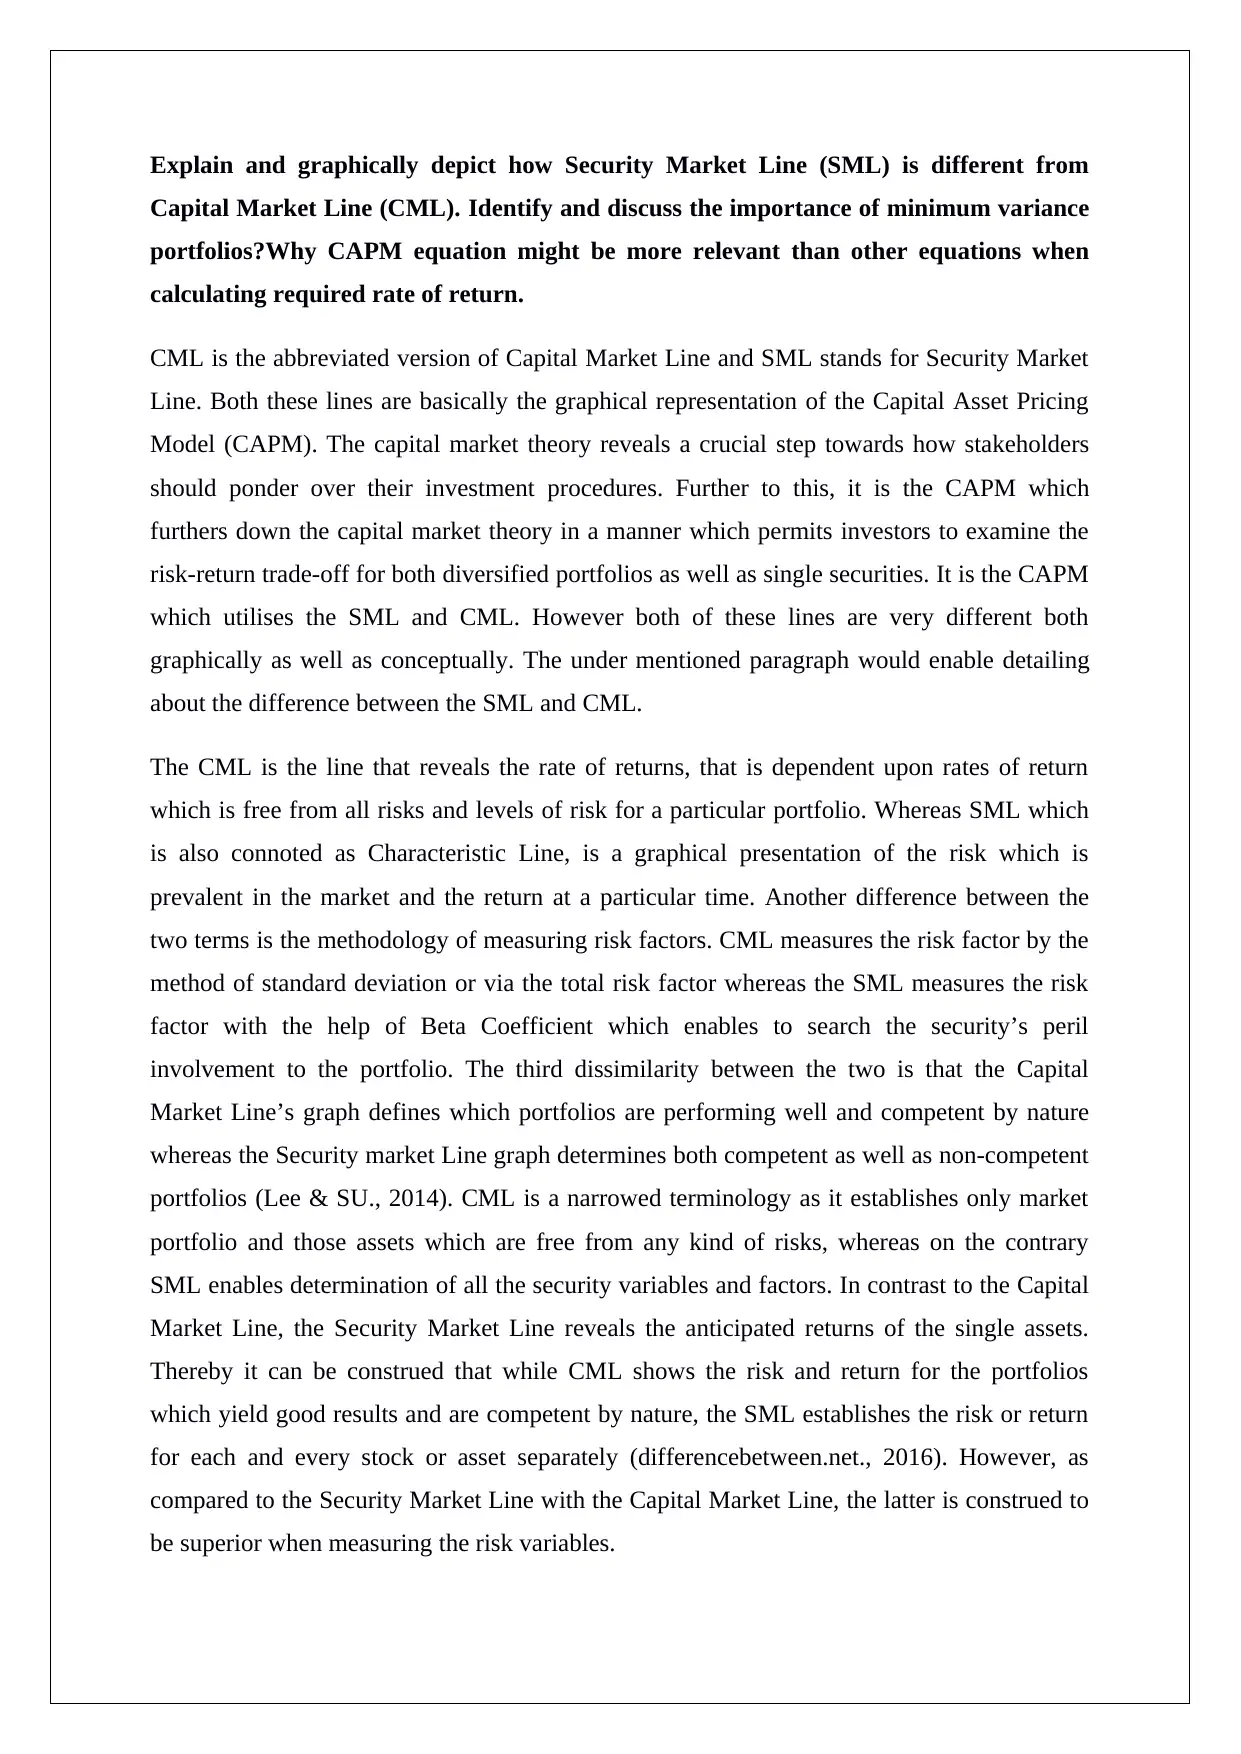
Source: http://financialmanagementpro.com/capital-market-line-cml/
In the said CML graph, two portfolios are assumed:
1. Lending (non-leveraged) Portfolio A with a standard deviation 5%
2. Borrowing (Leveraged) Portfolio B with standard deviation 15% (Smirnov., 2016)
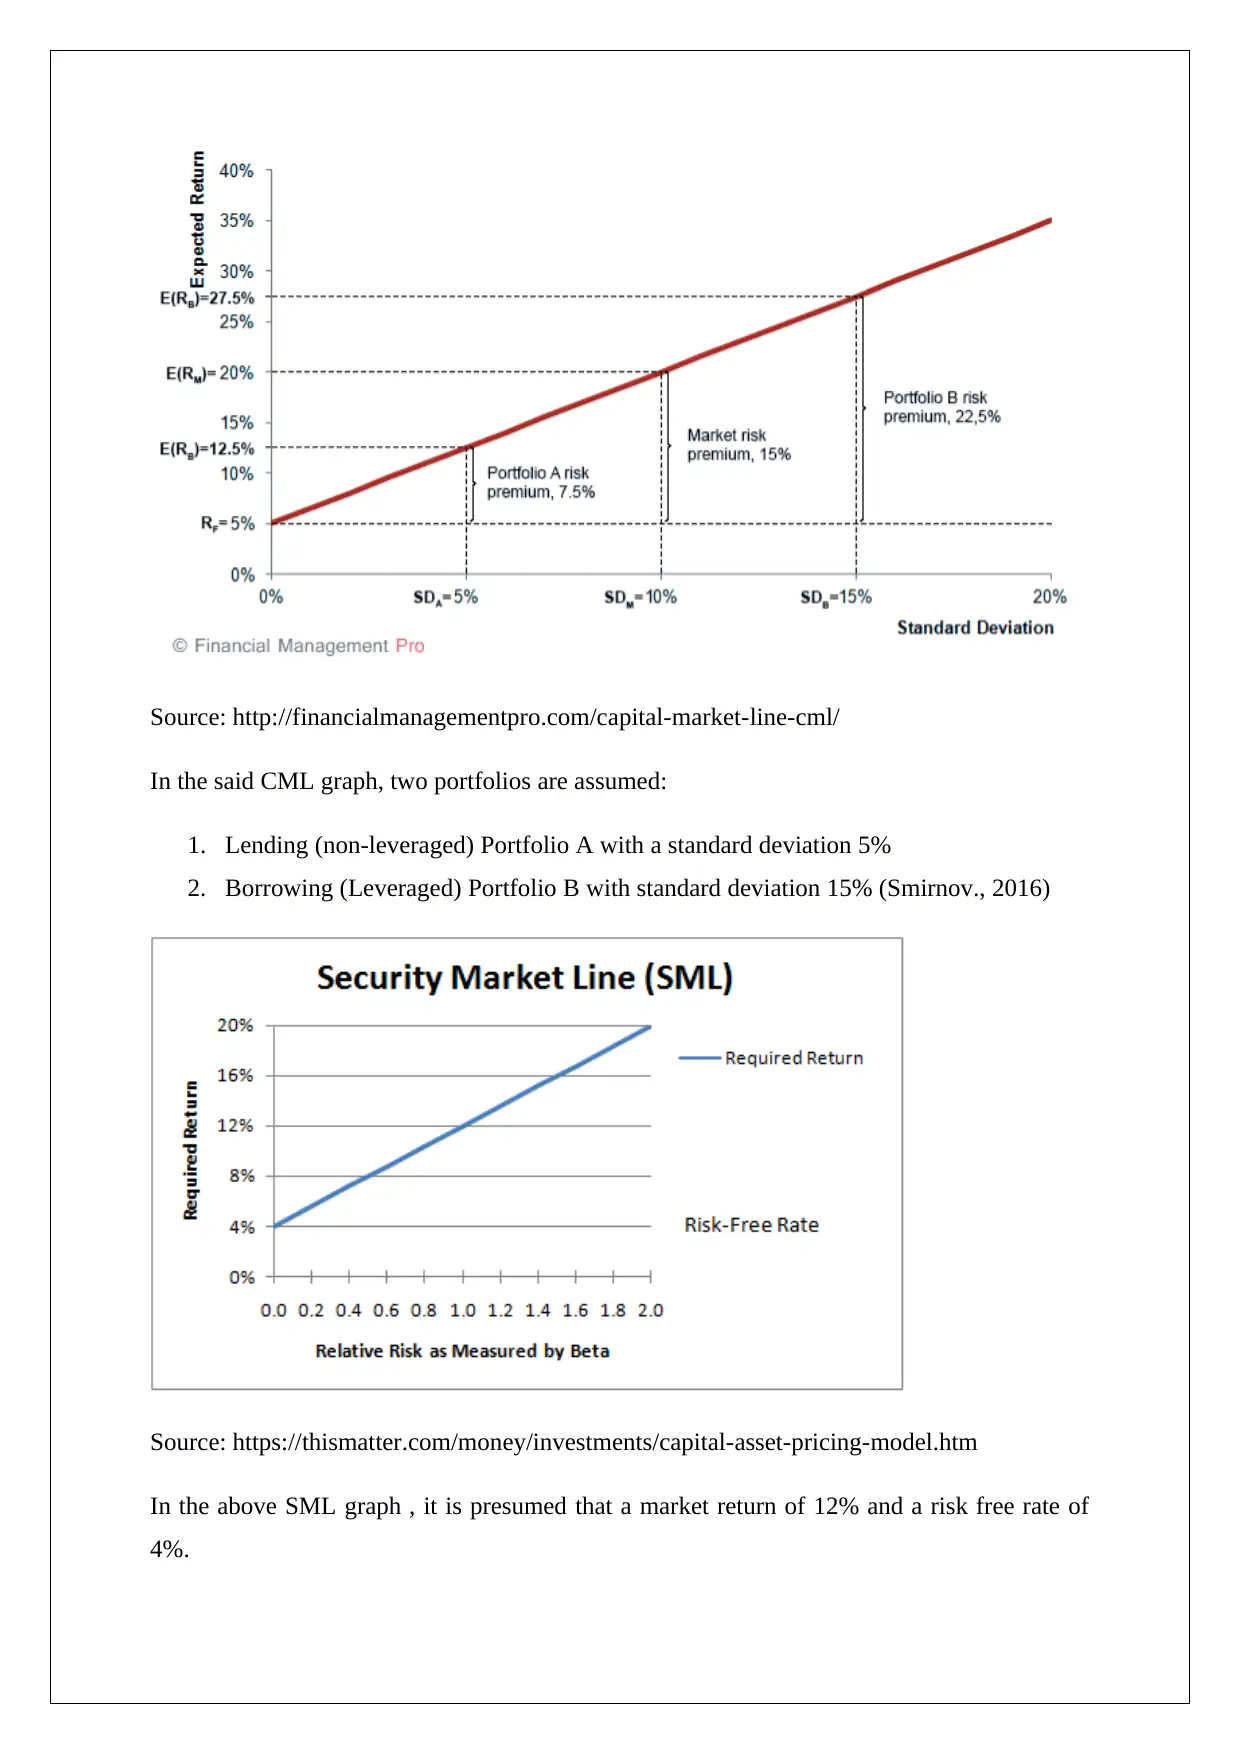
Source: https://thismatter.com/money/investments/capital-asset-pricing-model.htm
In the above SML graph , it is presumed that a market return of 12% and a risk free rate of
4%.
In the said CML graph, two portfolios are assumed:
1. Lending (non-leveraged) Portfolio A with a standard deviation 5%
2. Borrowing (Leveraged) Portfolio B with standard deviation 15% (Smirnov., 2016)
Source: https://thismatter.com/money/investments/capital-asset-pricing-model.htm
In the above SML graph , it is presumed that a market return of 12% and a risk free rate of
4%.
Thus Y axis of the Capital Market Line shows the expected return and the X axis shows the
standard deviation and the Y axis of Security Market Line shows the level of return that is
needed on the individual assets and the X axis reveals the level of risk represented by Beta.
Minimum Variance Portfolio (MVP) is a portfolio structuring model which may apparently
seem to be complicated but the same can enable maximise returns and reduce the risk
considerably, which is the main aim of all the investors across the globe. If one can formulate
and develop a minimum variance portfolio successfully, the investor can gain the best
possible result with minimum risk. Therefore it can be said that it’s a type of a “have your
cake and eat it too” tactics in the investment globe (Thune, 2017).
Before its importance is discussed it is very crucial to know what it is actually. The minimum
variance portfolio is a portfolio of stocks and securities that come together to reduce the price
instability of the entire portfolio. Volatility which a more commonly used word than variance
in the investment world, is basically a statistical measurement of a specific stock’s price
movement i.e. its ups and downs. Further to this, the instability of a security is also
exchangeable in line with the risk in the market. Thus more the volatility of a particular stock
or portfolio, the higher the market risk and vice-versa. Therefore it can be said that MVP is a
spread of investments with the least amount of volatilities i.e. those securities which have
lowest chances of fluctuate with regards price as they have the least amount of sensitivity
towards risk. Investors who are not wanting and desirous to undertake higher risks should
take into account the minimum variance portfolio. The concept is explained int he below
graph
⊘ This is a preview!⊘
Do you want full access?
Subscribe today to unlock all pages.
Trusted by 1+ million students worldwide
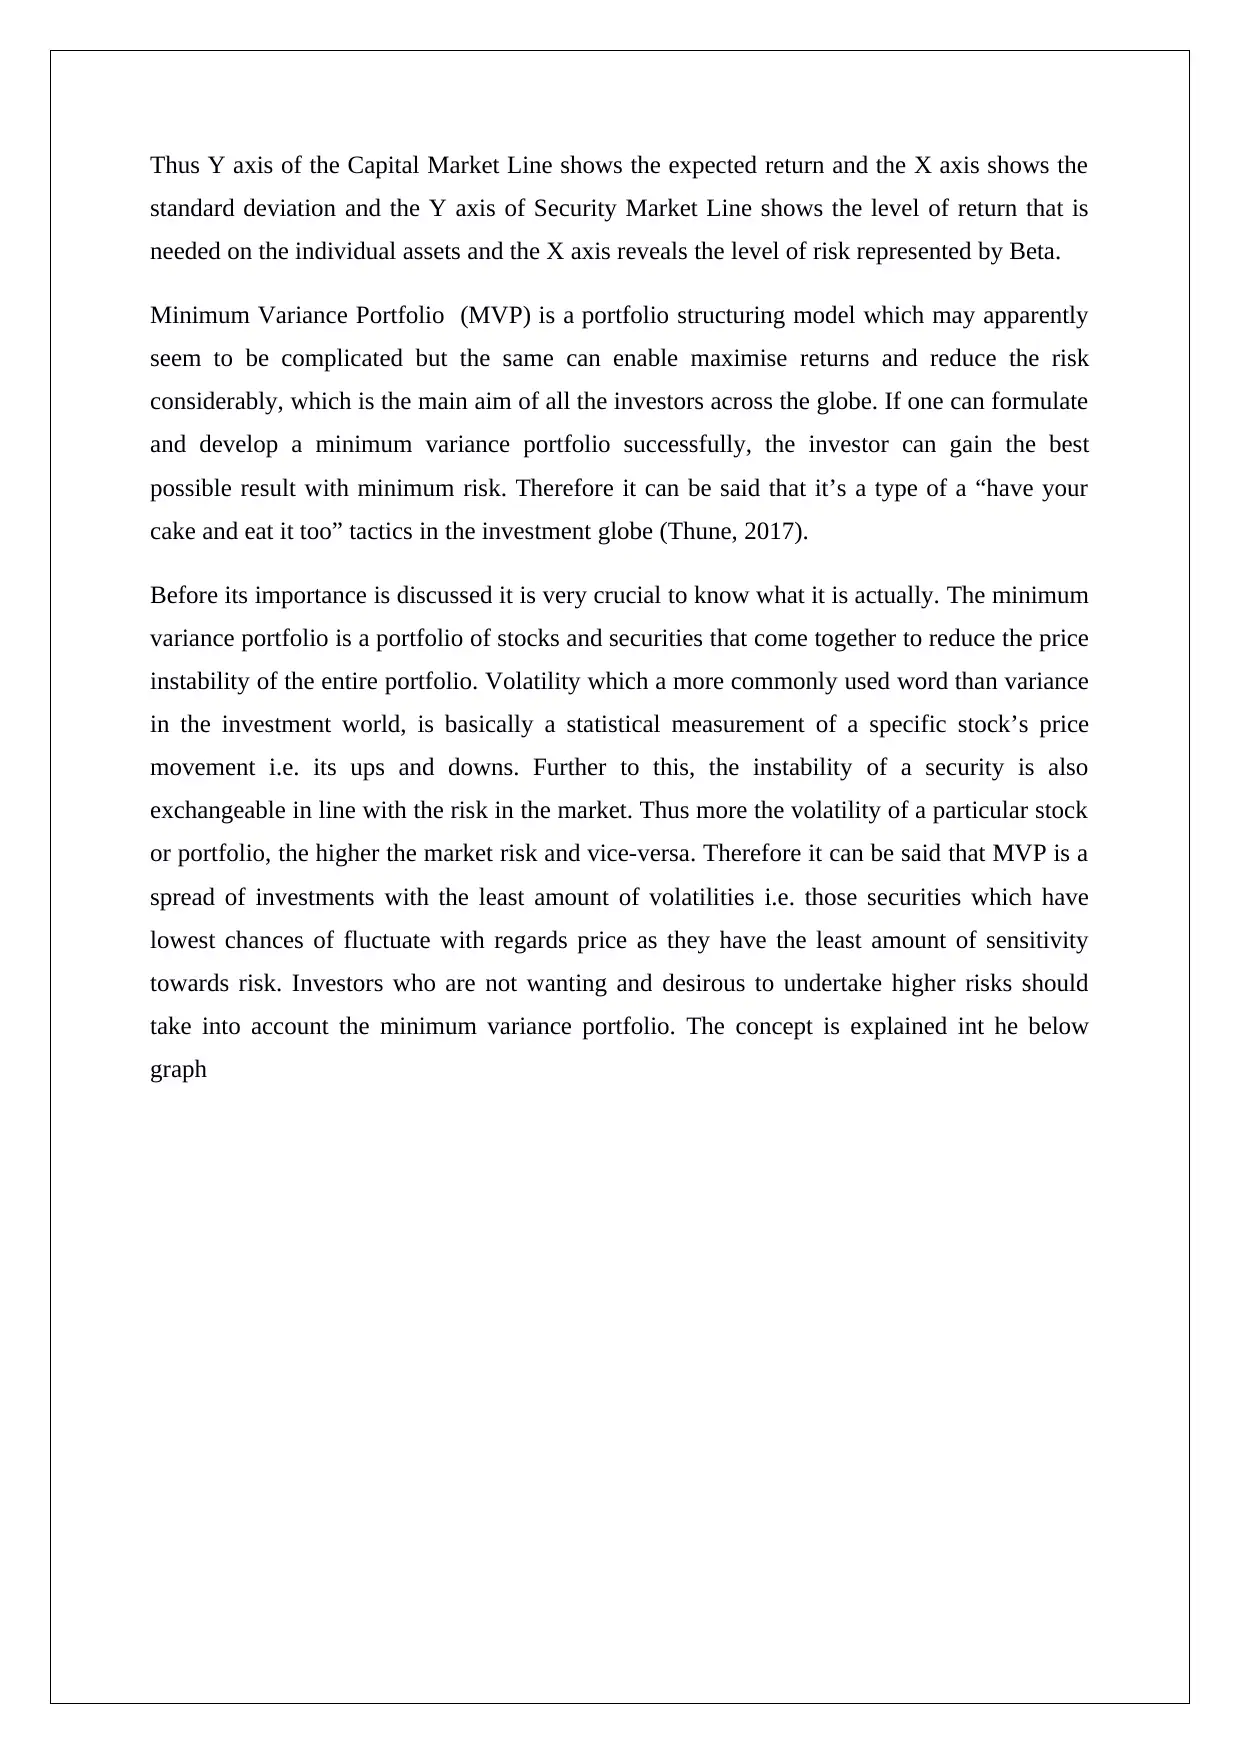
As is understood that the minimum variance portfolio is at the turn of the curve, where
variance (price fluctuation likelihood) is at its minimum.
Source: https://marketbusinessnews.com/financial-glossary/minimum-variance-portfolio/
The Minimum Variance Portfolio is considered to be very crucial and important due to
various features it offers to the investors which helps them form a portfolio with minimum
risk. The MVPs generally ensure to robustly surpass and perform better than expected market
cap, weighted portfolios and at the same time ensures to minimise the risk for the long term
future. The MVP basically does not support the Capital Asset Pricing Model which states that
more risk means more returns. The market cap weighted portfolios consider certain risks
which are branched out and is not supported by any kind of risk premium (Market Business
News., 2016). Thus in the theoretical parlance, MVPs do not consider these risks, hence gains
advantage via these lesser risky portfolios and at the same time not compromising on the
return. But this single handed does not clarify the fact of outperformance.
Paraphrase This Document
Need a fresh take? Get an instant paraphrase of this document with our AI Paraphraser
The main purpose of MVPs is to reduce the level of risk associated with the securities which
form a part of the portfolio, hence they will be inclined towards those securities and assets
which are not too volatile by nature, and move away from those assets which are highly
volatile by nature. Thus MVPs pick those assets only which are underpriced. As and when
the said underpricing gets minimised and the variables start moving towards volatility and
interrelated to other assets, their weightage is minimised in the MVP and may even be
gradually removed totally, and by the application of the said procedure, MVP helps to
achieve better than expected performance (Thune, 2017). Thus it is best for those investors
who are risk averse.
The importance of Minimum Variance can be understood from the view point of an investor
who is more apprehensive by the chances of any kind of major losses or reduction in the
portfolio value and hence with the entire volatility of their equity portfolio, they may be
interested in taking up such portfolios which have lesser volatility issues but at the same time
are inclined towards continuing a totally unprejudiced coverage to the appropriate equity
yardstick. The Minimum Variance approach has come to the highlight recently due to the
prologue of various indexes. In contradiction to the squat instability approach as discussed
above, the main motive of the MVP is to form such a portfolio which would comprise of
securities with, the on the whole, lowest instability, question to definite constrictions. Thus
the main reason why investors are inclined towards a Minimum Variance Portfolio is simply
because the risks are low yet the returns are outstanding (FTSE Russel, 2015).
The Capital Asset Pricing Model (CAPM) was developed in 1952 by Harry Markowitz and
was gradually adopted by other economists and investors such as William Sharpe. It enables
developing the linkage between the risk that an investor is exposed to and the expected rate of
return. As per the CAPM model and the equation it states, the required rate of return of a
specific security or asset or portfolio is equal to the addition of the rate on a risk-free security
and risk premium (moneystock.net., 2009).
The CAPM equation is considered to be more apt in comparison to the other equations while
computing the required rate of return due to varying reasons. The Weighted Average Cost of
Capital (WACC) can be used as the discount rate in the investment appraisal on the
presumption that a certain number of restrictive assumptions are met. The assumption
basically discusses that WACC can be applied as a discount rate only if the investment
project or portfolio stays intact without any kind of alterations such as business risk or
financial risk. If the business risk of the investment portfolio alters and is dissimilar to that of
the investing entity, then CAPM can be the best method to be used to compute the project
particular discount rate. Thus using of CAPM would be more apt than WACC in the twin
shaded area which can be understood by taking two projects A and B. The project A would
be rebuffed if WACC was taken as the discount rate, since the internal rate of return (IRR) of
the project is lower than that of WACC. The said investment decision is construed to be
wrong. But if the CAPM was applied, then the project would have been accepted since the
project IRR lies above SML. The returns given by the project is much more than that required
balancing for its range of systematic risk and thereby by accepting it will ensure to enhance
the wealth of the shareholders. Further if WACC was applied to project B then it would have
been accepted since the IRR is more than the WACC discount rate. But if CAPM was applied
then the said project would have been rejected since IRR of the project connotes inadequate
remuneration for its range of systematic risk.
There are various benefits offered by CAPM over the other methods of computing the rate of
return which clarifies why it is still accepted universally after four decades. CAPM takes into
consideration only systematic risk, which exhibits a truth in which most of the investors have
diversified portfolios which has ensured to eradicate the unsystematic risk. It produces a
theoretically derived linkage amongst the required return and the systematic risk which has
been questioned to continuous pragmatic study and trying. Further to this, the CAPM is most
of the time viewed as a much better way of computing the cost of equity rather than the
dividend growth model, wherein it unambiguously and clearly takes into account a
corporates’ level of systematic risk qualified to the stock market on the whole. Lastly, it is
also better than the WACC as discussed above in providing the discount rates for the purpose
of investment evaluation. Therefore, it is understood that studies have been conducted to
criticise the said model but CAPM has always been able to prove itself superior to all other
equations for computing the required rate of return (accaglobal.com. 2016).
RECOMMEDATIONS
On analysing the essay structure, it is understood that the Capital Asset Pricing Model is the
most widely used model for the computation of the required rate of return of an investment
portfolio. Various newer models have come up, but the accuracy provided by this model is
still not been broken by any of them. Although ideally every risk averse investor would be
inclined towards a MVP yet the computation of the same whether efficient or not would be
⊘ This is a preview!⊘
Do you want full access?
Subscribe today to unlock all pages.
Trusted by 1+ million students worldwide

best done under the CAPM as it considers all the relevant factors within certain constraint
assumptions.
assumptions.
Paraphrase This Document
Need a fresh take? Get an instant paraphrase of this document with our AI Paraphraser
REFERENCES:
Accaglobal.com., (2016), CAPM: Theory, Advantages and Disadvantages, Available at
http://www.accaglobal.com/in/en/student/exam-support-resources/fundamentals-exams-
study-resources/f9/technical-articles/CAPM-theory.html (Accessed on 16th May 2018)
Differencebetween.net., (2016), Difference Between CML and SML, Available at
http://www.differencebetween.net/business/difference-between-cml-and-sml/ (Accessed on
16th May 2018)
FTSE Russell, (2015), Low Volatility or Minimum Variance. Available at
http://www.ftse.com/products/downloads/Low-Vol-Whitepaper.pdf (Accessed on 16th May
2018)
Lee,M.C., & Su, L.E., (2014). Capital Market Line Based on Efficient Frontier of Portfolio
with Borrowing and Lending Rate. Universal Journal of Accounting and Finance. Vol.2.
no.4. pp. 69-76
Moneystock.net., (2009), Capital Asset Pricing Model, Available at
http://www.moneystock.net/wp_e/2009/09/08/capital-asset-pricing-modelcapm/ (Accessed
on 16th May 2018)
Market Business News., (2016), What is a minimum-variance portfolio? Available at
https://marketbusinessnews.com/financial-glossary/minimum-variance-portfolio/ (Accessed
on 16th May 2018)
Smirnov,Y., (2016), Capital Market Line – CML, Available at
http://financialmanagementpro.com/capital-market-line-cml/ (Accessed on 16th May 2018)
Thune,K., (2017), What is a Minimum Variance Portfolio (and How it Helps to Diversify)
Available at https://www.thebalance.com/minimum-variance-portfolio-overview-4155796
(Accessed on 16th May 2018)
1 out of 8
Related Documents


Your All-in-One AI-Powered Toolkit for Academic Success.
+13062052269
info@desklib.com
Available 24*7 on WhatsApp / Email
![[object Object]](/_next/static/media/star-bottom.7253800d.svg)
Unlock your academic potential
Copyright © 2020–2026 A2Z Services. All Rights Reserved. Developed and managed by ZUCOL.