Financial Management Analysis of Petronas and Adventa Bhd
VerifiedAdded on 2022/11/23
|16
|4272
|70
Report
AI Summary
This report provides a comprehensive financial analysis of two Malaysian companies: Petronas (Oil and Gas) and Adventa Bhd (Healthcare), focusing on their capital structures from 2013 to 2017. The analysis includes the calculation of capital structure ratios, specifically the debt-to-equity ratio, to evaluate the level of debt (gearing) in each company's capital structure. The report further delves into the calculation of the weighted average cost of capital (WACC) for both companies, incorporating the cost of equity (calculated using the CAPM model) and the cost of debt. The financial performance of the companies is evaluated through the analysis of their return on equity (ROE) over the five-year period. The report also explores the impact of capital structure on the companies' financial risk and profitability. The analysis includes an explanation of capital structure theories, such as the impact of debt and equity financing, and their implications for the companies' financial health. The findings highlight the differences in capital structure between Petronas, with a lower debt level, and Adventa Bhd, which has a higher proportion of debt. The report concludes with recommendations for optimizing the capital structure of both companies, taking into account industry standards and the specific financial characteristics of each business. The report is written in response to an assignment brief requiring analysis of financial management in the context of Malaysian companies.

Running head: FINANCIAL MANAGEMENT
Financial Management
Name of the Student:
Name of the University:
Author’s Note:
Financial Management
Name of the Student:
Name of the University:
Author’s Note:
Paraphrase This Document
Need a fresh take? Get an instant paraphrase of this document with our AI Paraphraser
1FINANCIAL MANAGEMENT
Table of Contents
Introduction......................................................................................................................................2
Discussion........................................................................................................................................3
Capital Structure Ratio................................................................................................................3
Explanation of Companies Capital Structure Ratio’s..................................................................6
Capital Structure Theories...........................................................................................................8
Financial Performance...............................................................................................................10
Recommendations..........................................................................................................................11
Conclusion.....................................................................................................................................12
References......................................................................................................................................13
2FINANCIAL MANAGEMENT
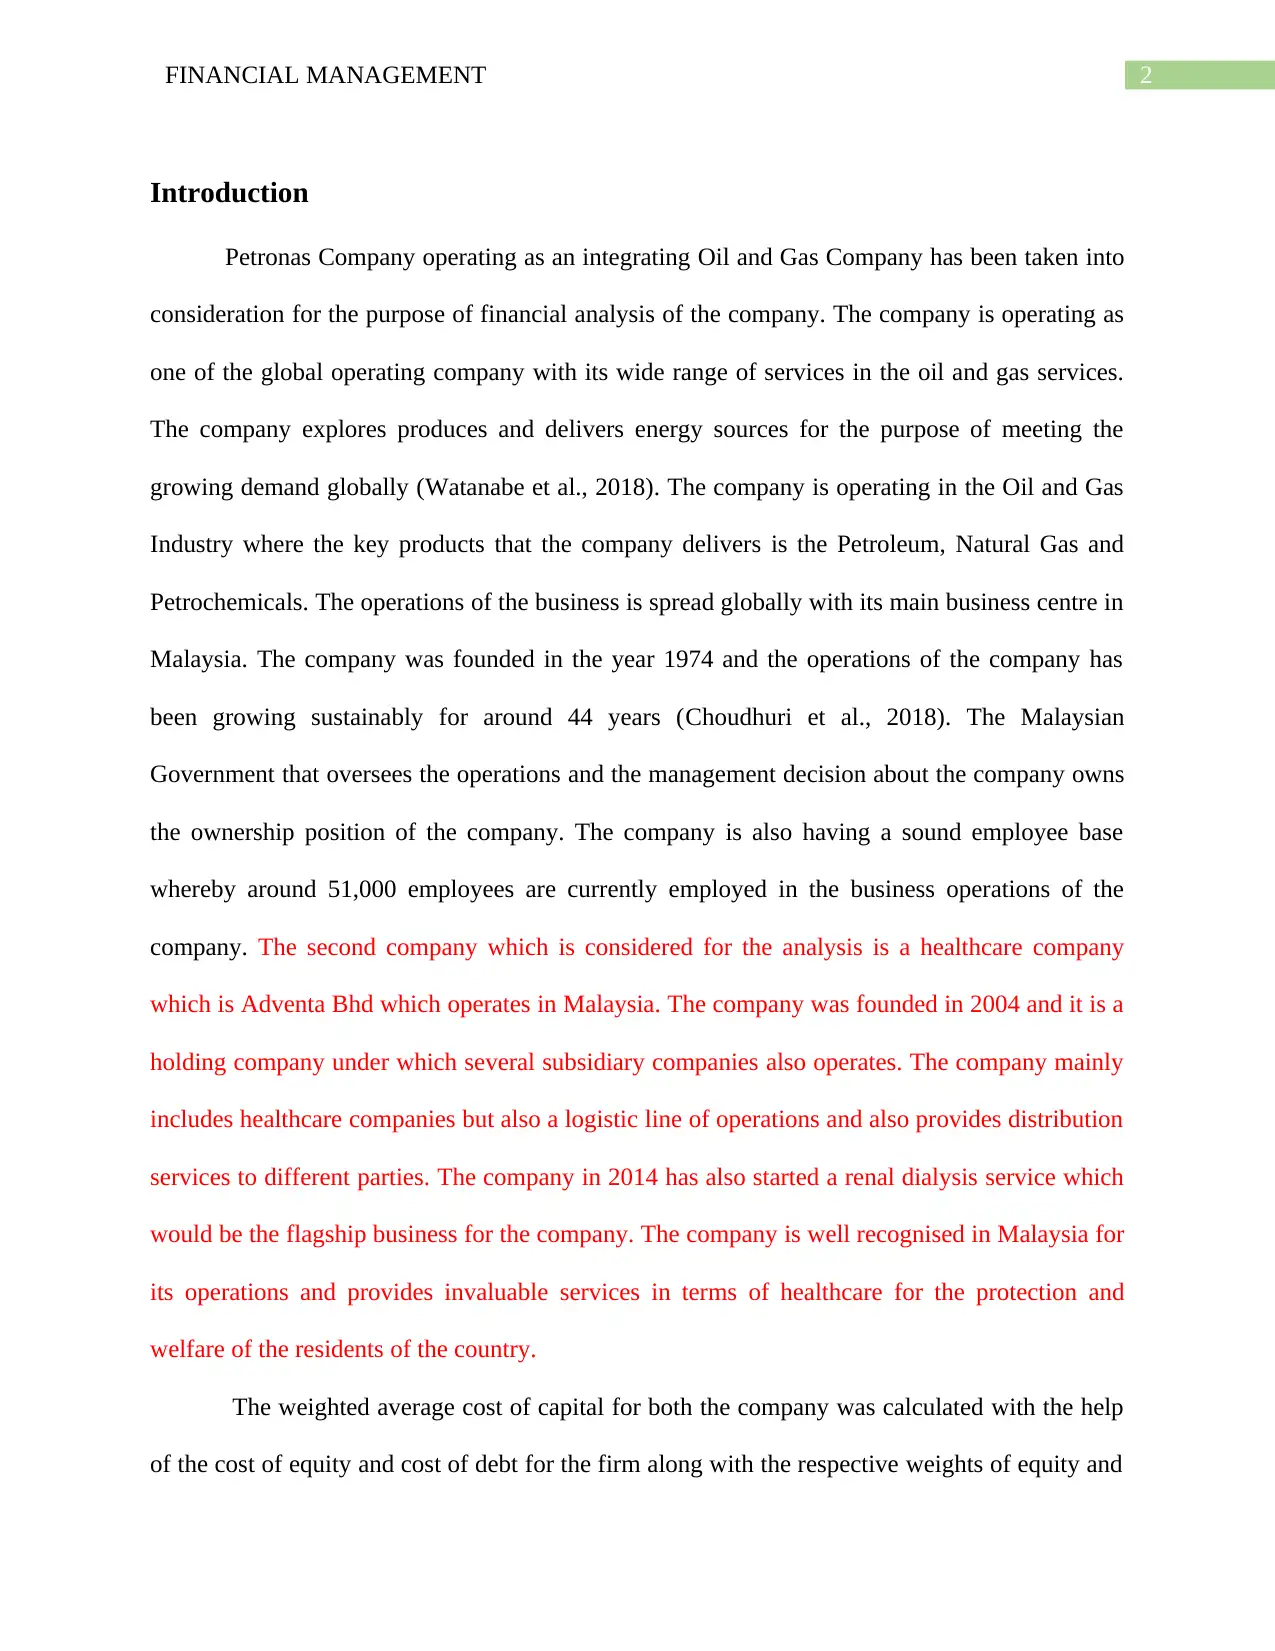
Introduction
Petronas Company operating as an integrating Oil and Gas Company has been taken into
consideration for the purpose of financial analysis of the company. The company is operating as
one of the global operating company with its wide range of services in the oil and gas services.
The company explores produces and delivers energy sources for the purpose of meeting the
growing demand globally (Watanabe et al., 2018). The company is operating in the Oil and Gas
Industry where the key products that the company delivers is the Petroleum, Natural Gas and
Petrochemicals. The operations of the business is spread globally with its main business centre in
Malaysia. The company was founded in the year 1974 and the operations of the company has
been growing sustainably for around 44 years (Choudhuri et al., 2018). The Malaysian
Government that oversees the operations and the management decision about the company owns
the ownership position of the company. The company is also having a sound employee base
whereby around 51,000 employees are currently employed in the business operations of the
company. The second company which is considered for the analysis is a healthcare company
which is Adventa Bhd which operates in Malaysia. The company was founded in 2004 and it is a
holding company under which several subsidiary companies also operates. The company mainly
includes healthcare companies but also a logistic line of operations and also provides distribution
services to different parties. The company in 2014 has also started a renal dialysis service which
would be the flagship business for the company. The company is well recognised in Malaysia for
its operations and provides invaluable services in terms of healthcare for the protection and
welfare of the residents of the country.
The weighted average cost of capital for both the company was calculated with the help
of the cost of equity and cost of debt for the firm along with the respective weights of equity and
⊘ This is a preview!⊘
Do you want full access?
Subscribe today to unlock all pages.
Trusted by 1+ million students worldwide
3FINANCIAL MANAGEMENT
debt in the financials of the company. Gearing level or the level of debt in the company has been
primarily stable in the financials of the company (Zaid, Kasuma & Gregory, 2018). The
weighted average cost of capital for the company was calculated with the help of the cost of
equity that was calculated with the CAPM Model. On the other hand, the cost of debt was
calculated with the help of the interest expenses paid and the weightage of debt in the financials
of the company. Return generated by the company on the shareholder’s equity of the company
for the two reported years by the company were taken into detailed analysis evaluating the
financial performance of the company. It is important to compare the level of profitability of the
company along with the undertaken capital structure of the company were taken into
consideration (Vătavu, 2015).
Discussion
Capital Structure Ratio
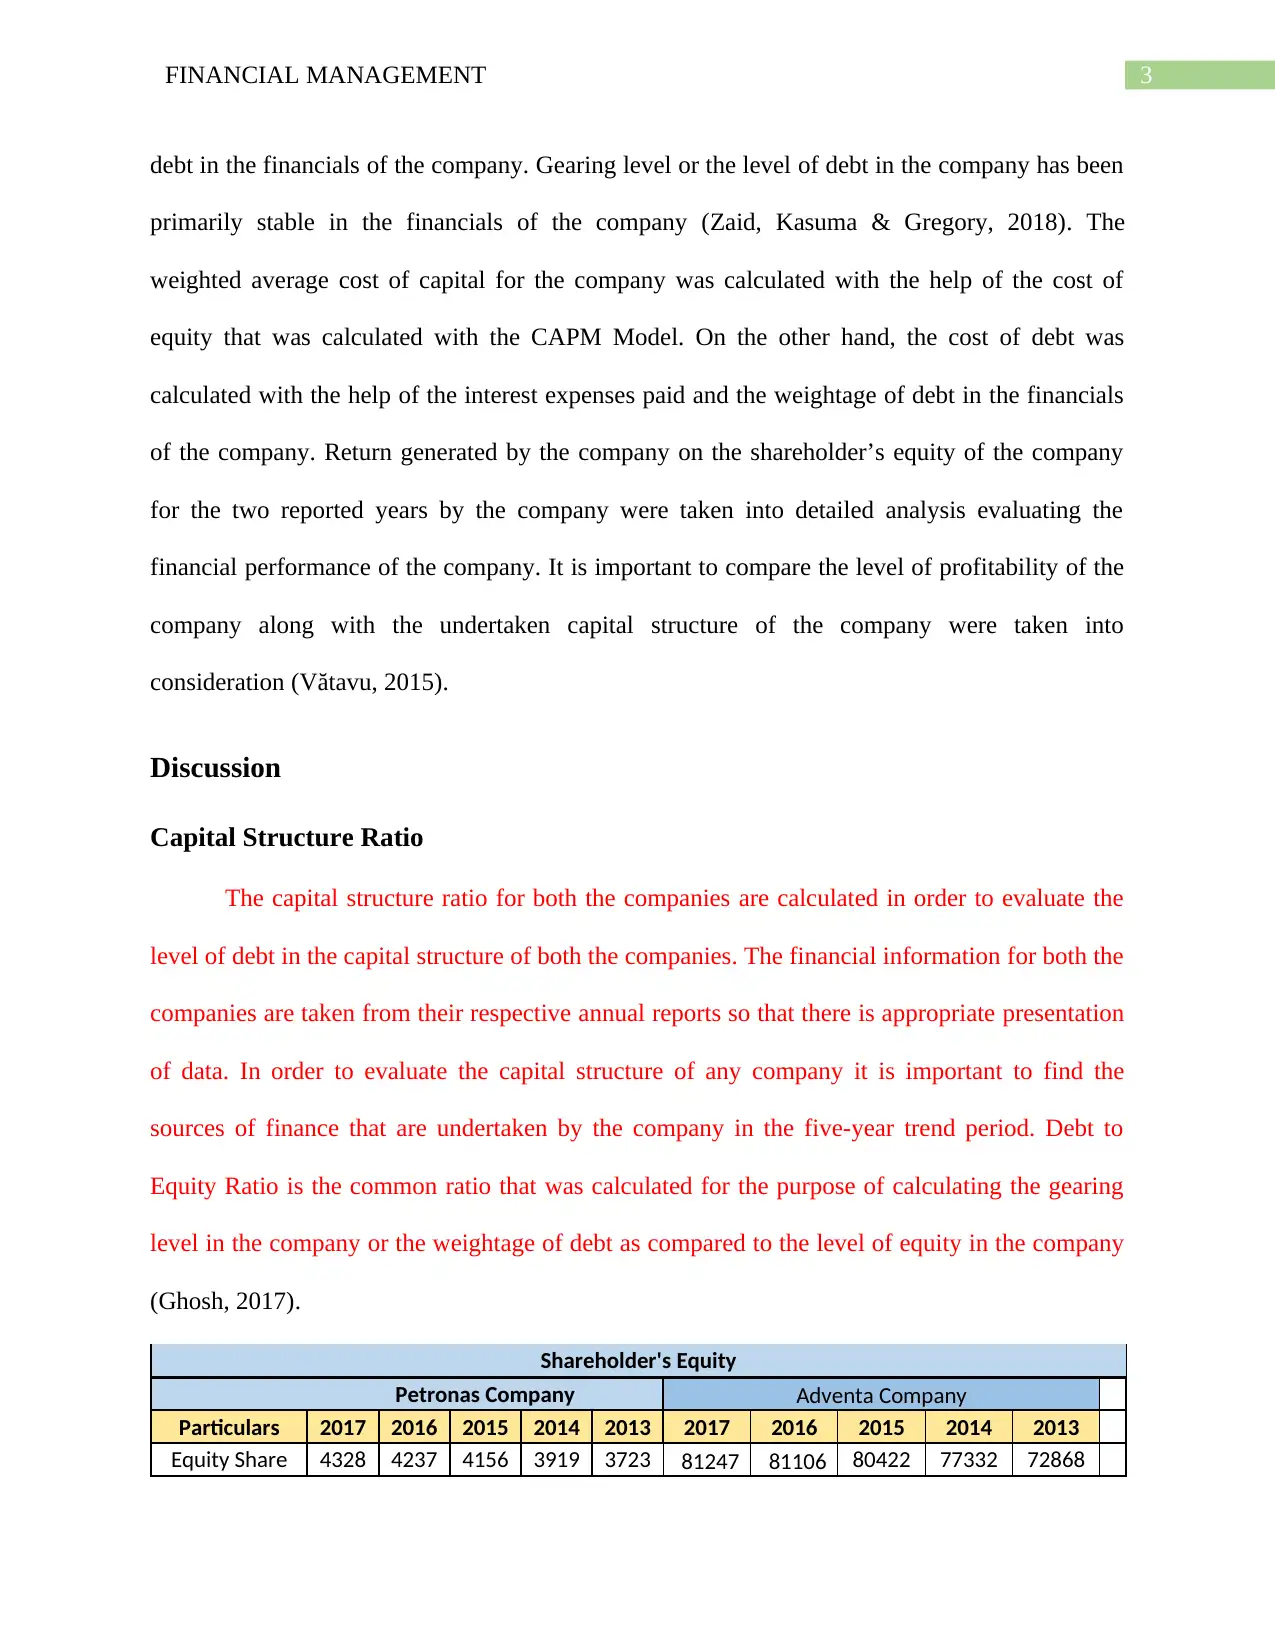
The capital structure ratio for both the companies are calculated in order to evaluate the
level of debt in the capital structure of both the companies. The financial information for both the
companies are taken from their respective annual reports so that there is appropriate presentation
of data. In order to evaluate the capital structure of any company it is important to find the
sources of finance that are undertaken by the company in the five-year trend period. Debt to
Equity Ratio is the common ratio that was calculated for the purpose of calculating the gearing
level in the company or the weightage of debt as compared to the level of equity in the company
(Ghosh, 2017).
Shareholder's Equity
Petronas Company Adventa Company
Particulars 2017 2016 2015 2014 2013 2017 2016 2015 2014 2013
Equity Share 4328 4237 4156 3919 3723 81247 81106 80422 77332 72868
debt in the financials of the company. Gearing level or the level of debt in the company has been
primarily stable in the financials of the company (Zaid, Kasuma & Gregory, 2018). The
weighted average cost of capital for the company was calculated with the help of the cost of
equity that was calculated with the CAPM Model. On the other hand, the cost of debt was
calculated with the help of the interest expenses paid and the weightage of debt in the financials
of the company. Return generated by the company on the shareholder’s equity of the company
for the two reported years by the company were taken into detailed analysis evaluating the
financial performance of the company. It is important to compare the level of profitability of the
company along with the undertaken capital structure of the company were taken into
consideration (Vătavu, 2015).
Discussion
Capital Structure Ratio
The capital structure ratio for both the companies are calculated in order to evaluate the
level of debt in the capital structure of both the companies. The financial information for both the
companies are taken from their respective annual reports so that there is appropriate presentation
of data. In order to evaluate the capital structure of any company it is important to find the
sources of finance that are undertaken by the company in the five-year trend period. Debt to
Equity Ratio is the common ratio that was calculated for the purpose of calculating the gearing
level in the company or the weightage of debt as compared to the level of equity in the company
(Ghosh, 2017).
Shareholder's Equity
Petronas Company Adventa Company
Particulars 2017 2016 2015 2014 2013 2017 2016 2015 2014 2013
Equity Share 4328 4237 4156 3919 3723 81247 81106 80422 77332 72868
Paraphrase This Document
Need a fresh take? Get an instant paraphrase of this document with our AI Paraphraser
4FINANCIAL MANAGEMENT
Capital 35 03 52 29 05 663 603 453 456 750
Long-Term Debt Long-Term Debt
Particulars 2017 2016 2015 2014 2013 2017 2016 2015 2014 2013
Interest
Expenses 2606 2428 3327 2656 2752
12821
50
15878
92
97777
5
43453
3
62747
7
Long-Term
Debt
3836
0
4236
7
5393
9
3007
2
2900
2
23398
901
31531
615
28086
825
40166
67
58655
79
Net Interest
Rate
6.79
%
5.73
%
6.17
%
8.83
%
9.49
% 5.48% 5.04% 3.48%
10.82
%
10.70
%
Past Performance Past Performance
Particulars 2017 2016 2015 2014 2013 2017 2016 2015 2014 2013
Net Profit
4551
8
2376
2
2086
2
4761
3
6558
6
14106
0
68415
0
30899
97
44637
06
82379
094
Shareholder's
Equity
4328
35
4237
03
4156
52
3919
29
3723
05
81247
663
81106
603
80422
453
77332
456
72868
750
Return on
Equity 11% 6% 5% 12% 18% 0% 1% 4% 6% 113%
Gearing Level Gearing Level
Particulars 2017 2016 2015 2014 2013 2017 2016 2015 2014 2013
Long-Term
Debt
3836
0
4236
7
5393
9
3007
2
2900
2
23398
901
31531
615
28086
825
40166
67
58655
79
Equity Share
Capital
4328
35
4237
03
4156
52
3919
29
3723
05
81247
663
81106
603
80422
453
77332
456
72868
750
Gearing Level 9% 10% 13% 8% 8% 29% 39% 35% 5% 8%
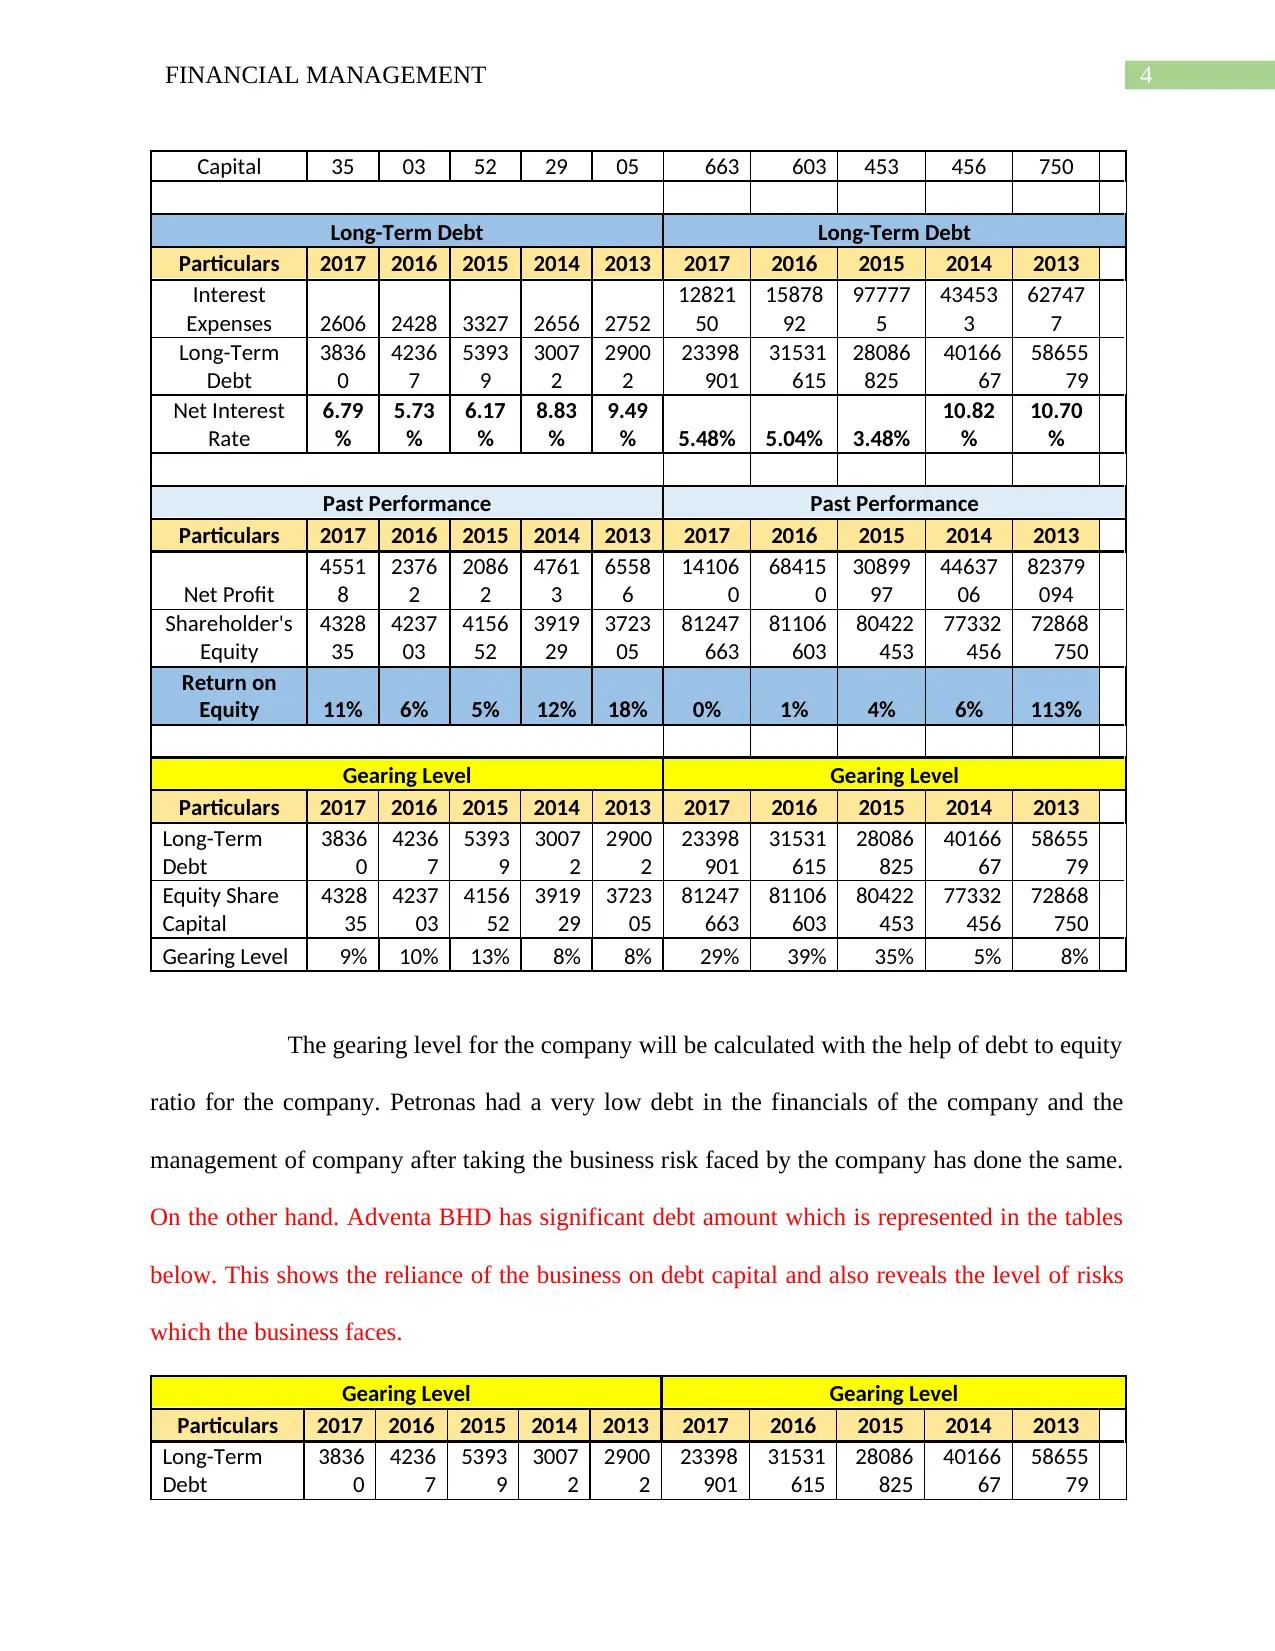
The gearing level for the company will be calculated with the help of debt to equity
ratio for the company. Petronas had a very low debt in the financials of the company and the
management of company after taking the business risk faced by the company has done the same.
On the other hand. Adventa BHD has significant debt amount which is represented in the tables
below. This shows the reliance of the business on debt capital and also reveals the level of risks
which the business faces.
Gearing Level Gearing Level
Particulars 2017 2016 2015 2014 2013 2017 2016 2015 2014 2013
Long-Term
Debt
3836
0
4236
7
5393
9
3007
2
2900
2
23398
901
31531
615
28086
825
40166
67
58655
79
Capital 35 03 52 29 05 663 603 453 456 750
Long-Term Debt Long-Term Debt
Particulars 2017 2016 2015 2014 2013 2017 2016 2015 2014 2013
Interest
Expenses 2606 2428 3327 2656 2752
12821
50
15878
92
97777
5
43453
3
62747
7
Long-Term
Debt
3836
0
4236
7
5393
9
3007
2
2900
2
23398
901
31531
615
28086
825
40166
67
58655
79
Net Interest
Rate
6.79
%
5.73
%
6.17
%
8.83
%
9.49
% 5.48% 5.04% 3.48%
10.82
%
10.70
%
Past Performance Past Performance
Particulars 2017 2016 2015 2014 2013 2017 2016 2015 2014 2013
Net Profit
4551
8
2376
2
2086
2
4761
3
6558
6
14106
0
68415
0
30899
97
44637
06
82379
094
Shareholder's
Equity
4328
35
4237
03
4156
52
3919
29
3723
05
81247
663
81106
603
80422
453
77332
456
72868
750
Return on
Equity 11% 6% 5% 12% 18% 0% 1% 4% 6% 113%
Gearing Level Gearing Level
Particulars 2017 2016 2015 2014 2013 2017 2016 2015 2014 2013
Long-Term
Debt
3836
0
4236
7
5393
9
3007
2
2900
2
23398
901
31531
615
28086
825
40166
67
58655
79
Equity Share
Capital
4328
35
4237
03
4156
52
3919
29
3723
05
81247
663
81106
603
80422
453
77332
456
72868
750
Gearing Level 9% 10% 13% 8% 8% 29% 39% 35% 5% 8%
The gearing level for the company will be calculated with the help of debt to equity
ratio for the company. Petronas had a very low debt in the financials of the company and the
management of company after taking the business risk faced by the company has done the same.
On the other hand. Adventa BHD has significant debt amount which is represented in the tables
below. This shows the reliance of the business on debt capital and also reveals the level of risks
which the business faces.
Gearing Level Gearing Level
Particulars 2017 2016 2015 2014 2013 2017 2016 2015 2014 2013
Long-Term
Debt
3836
0
4236
7
5393
9
3007
2
2900
2
23398
901
31531
615
28086
825
40166
67
58655
79
5FINANCIAL MANAGEMENT
Equity Share
Capital
4328
35
4237
03
4156
52
3919
29
3723
05
81247
663
81106
603
80422
453
77332
456
72868
750
Gearing Level 9% 10% 13% 8% 8% 29% 39% 35% 5% 8%
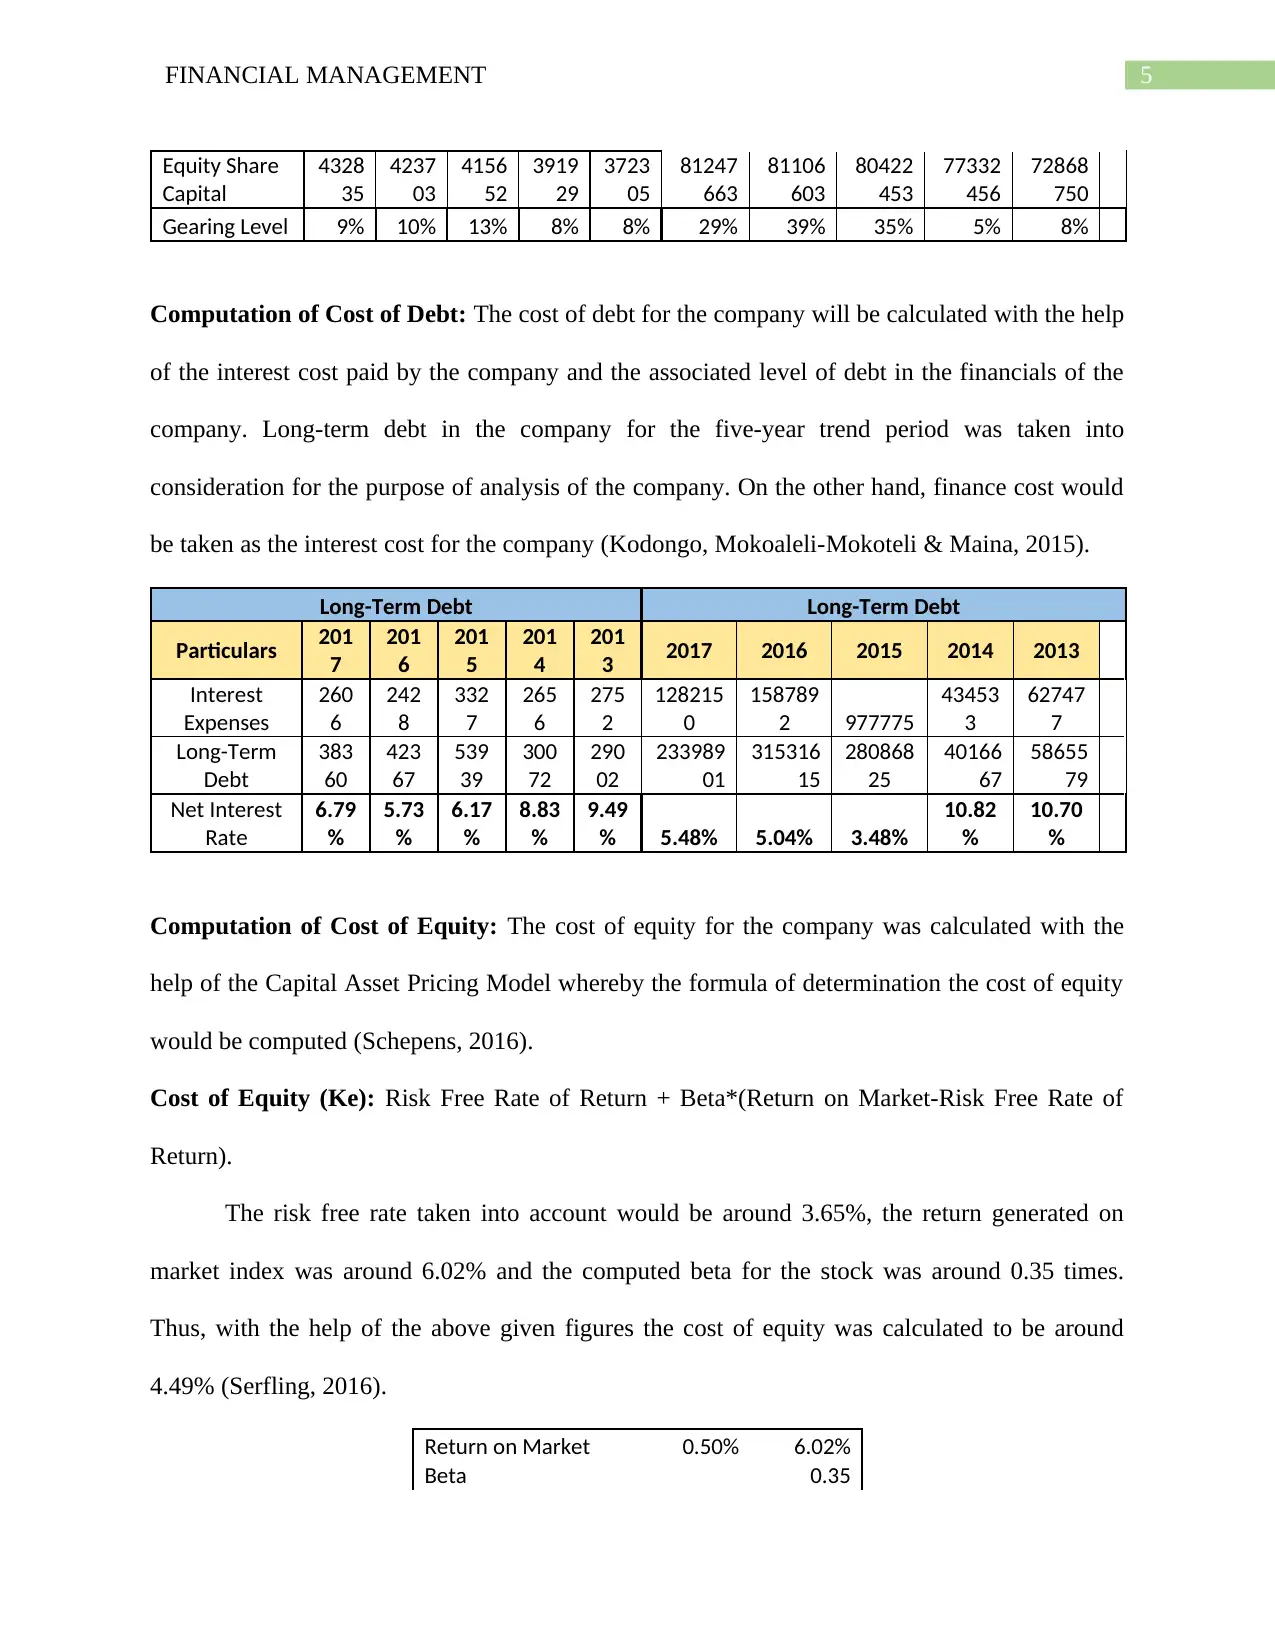
Computation of Cost of Debt: The cost of debt for the company will be calculated with the help
of the interest cost paid by the company and the associated level of debt in the financials of the
company. Long-term debt in the company for the five-year trend period was taken into
consideration for the purpose of analysis of the company. On the other hand, finance cost would
be taken as the interest cost for the company (Kodongo, Mokoaleli-Mokoteli & Maina, 2015).
Long-Term Debt Long-Term Debt
Particulars 201
7
201
6
201
5
201
4
201
3 2017 2016 2015 2014 2013
Interest
Expenses
260
6
242
8
332
7
265
6
275
2
128215
0
158789
2 977775
43453
3
62747
7
Long-Term
Debt
383
60
423
67
539
39
300
72
290
02
233989
01
315316
15
280868
25
40166
67
58655
79
Net Interest
Rate
6.79
%
5.73
%
6.17
%
8.83
%
9.49
% 5.48% 5.04% 3.48%
10.82
%
10.70
%
Computation of Cost of Equity: The cost of equity for the company was calculated with the
help of the Capital Asset Pricing Model whereby the formula of determination the cost of equity
would be computed (Schepens, 2016).
Cost of Equity (Ke): Risk Free Rate of Return + Beta*(Return on Market-Risk Free Rate of
Return).
The risk free rate taken into account would be around 3.65%, the return generated on
market index was around 6.02% and the computed beta for the stock was around 0.35 times.
Thus, with the help of the above given figures the cost of equity was calculated to be around
4.49% (Serfling, 2016).
Return on Market 0.50% 6.02%
Beta 0.35
Equity Share
Capital
4328
35
4237
03
4156
52
3919
29
3723
05
81247
663
81106
603
80422
453
77332
456
72868
750
Gearing Level 9% 10% 13% 8% 8% 29% 39% 35% 5% 8%
Computation of Cost of Debt: The cost of debt for the company will be calculated with the help
of the interest cost paid by the company and the associated level of debt in the financials of the
company. Long-term debt in the company for the five-year trend period was taken into
consideration for the purpose of analysis of the company. On the other hand, finance cost would
be taken as the interest cost for the company (Kodongo, Mokoaleli-Mokoteli & Maina, 2015).
Long-Term Debt Long-Term Debt
Particulars 201
7
201
6
201
5
201
4
201
3 2017 2016 2015 2014 2013
Interest
Expenses
260
6
242
8
332
7
265
6
275
2
128215
0
158789
2 977775
43453
3
62747
7
Long-Term
Debt
383
60
423
67
539
39
300
72
290
02
233989
01
315316
15
280868
25
40166
67
58655
79
Net Interest
Rate
6.79
%
5.73
%
6.17
%
8.83
%
9.49
% 5.48% 5.04% 3.48%
10.82
%
10.70
%
Computation of Cost of Equity: The cost of equity for the company was calculated with the
help of the Capital Asset Pricing Model whereby the formula of determination the cost of equity
would be computed (Schepens, 2016).
Cost of Equity (Ke): Risk Free Rate of Return + Beta*(Return on Market-Risk Free Rate of
Return).
The risk free rate taken into account would be around 3.65%, the return generated on
market index was around 6.02% and the computed beta for the stock was around 0.35 times.
Thus, with the help of the above given figures the cost of equity was calculated to be around
4.49% (Serfling, 2016).
Return on Market 0.50% 6.02%
Beta 0.35
⊘ This is a preview!⊘
Do you want full access?
Subscribe today to unlock all pages.
Trusted by 1+ million students worldwide
6FINANCIAL MANAGEMENT
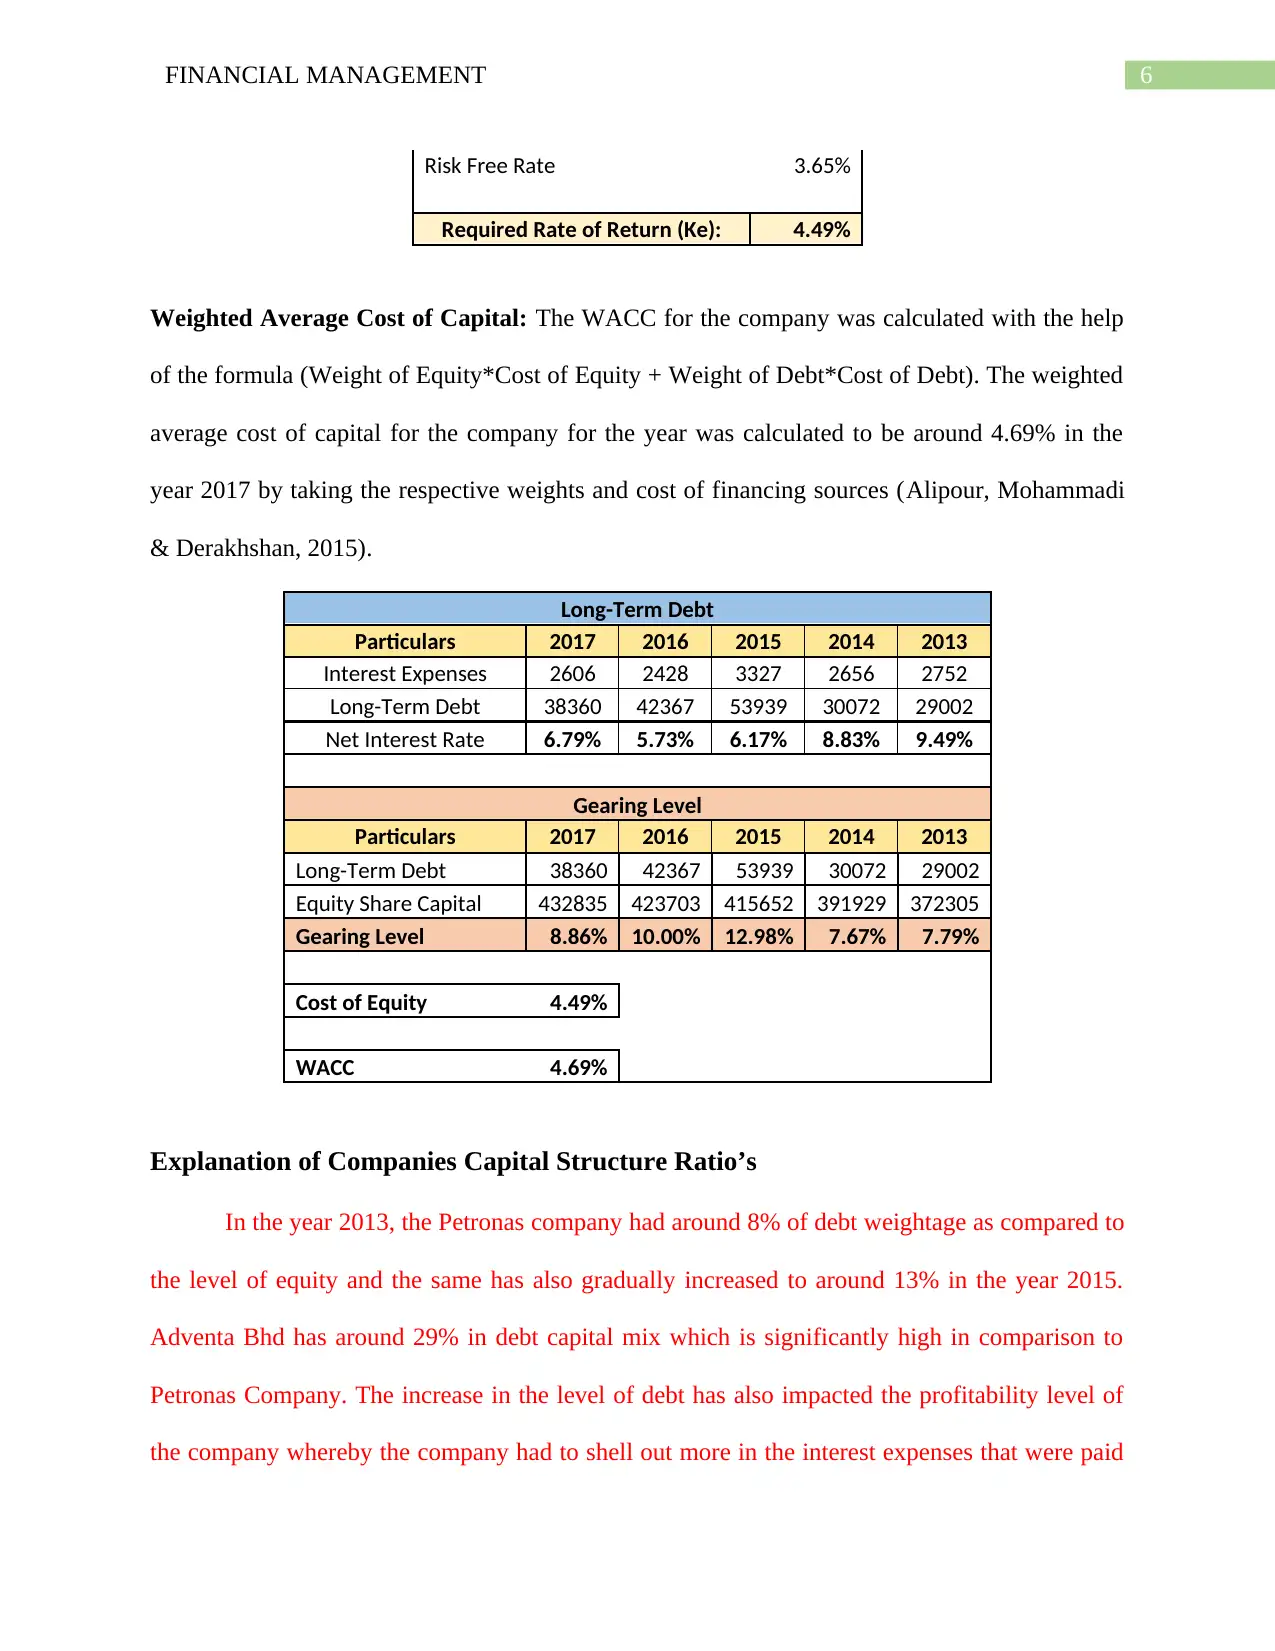
Risk Free Rate 3.65%
Required Rate of Return (Ke): 4.49%
Weighted Average Cost of Capital: The WACC for the company was calculated with the help
of the formula (Weight of Equity*Cost of Equity + Weight of Debt*Cost of Debt). The weighted
average cost of capital for the company for the year was calculated to be around 4.69% in the
year 2017 by taking the respective weights and cost of financing sources (Alipour, Mohammadi
& Derakhshan, 2015).
Long-Term Debt
Particulars 2017 2016 2015 2014 2013
Interest Expenses 2606 2428 3327 2656 2752
Long-Term Debt 38360 42367 53939 30072 29002
Net Interest Rate 6.79% 5.73% 6.17% 8.83% 9.49%
Gearing Level
Particulars 2017 2016 2015 2014 2013
Long-Term Debt 38360 42367 53939 30072 29002
Equity Share Capital 432835 423703 415652 391929 372305
Gearing Level 8.86% 10.00% 12.98% 7.67% 7.79%
Cost of Equity 4.49%
WACC 4.69%
Explanation of Companies Capital Structure Ratio’s
In the year 2013, the Petronas company had around 8% of debt weightage as compared to
the level of equity and the same has also gradually increased to around 13% in the year 2015.
Adventa Bhd has around 29% in debt capital mix which is significantly high in comparison to
Petronas Company. The increase in the level of debt has also impacted the profitability level of
the company whereby the company had to shell out more in the interest expenses that were paid
Paraphrase This Document
Need a fresh take? Get an instant paraphrase of this document with our AI Paraphraser
7FINANCIAL MANAGEMENT
by the company. Financial risk of the company also had increased in the year 2015 that would be
limiting the ability of the company in taking business risk associated with the operations of the
company (Liang et al., 2016). However, keeping the same intact and into account the
management of the company has undertaken actions to reduce the level of debt in the financials
of the company in the financial year 2016-2017. Equity financing is comparatively better than
debt financing but it comes along with the high cost associated of equity financing. On the other
hand, the company can also get advantage of debt financing when it comes to calculation of the
effective tax rate evaluation. Both advantages and as well as disadvantages of debt financing is
associated with the company but it is important that the companies have an optimal capital
structure in the financials of the company. The capital structure of the company should also be in
the view of industry standards i.e., the level of debt in the financials of the company (Demirguc-
Kunt, Martinez-Peria & Tressel, 2015). The level of equity financing is the other important thing
that the company should consider while evaluating the capital structure of the company as the
same is not only safe financing option but also gives the liberty to the management of the
company to undertake various operational and business risk for the operations of the company.
Capital structure of the company should be reviewed on a periodic basis and the same should be
well compatible with the various level of operations of the company (Elsas & Florysiak, 2015).
The capital structure of the Petronas Company has been comparatively stable where the
associated level of debt has been comparatively lower but at the same time it is important that the
company should consider their effective tax rate when analysing the benefit and costs associated
with the same. On the other hand, the capital structure of Adventa Bhd is not stable as there is a
quite high proportion of debt capital which is used by the business which suggest that the
business faces tremendous amount of risks and also faces capital or liquidity shortages.
8FINANCIAL MANAGEMENT
The key factor that influences the capital structure of the company is the applicability of
the equity or debt financing that is available to the company. Petronas as a Government
Company has also On the other hand the cost of each source of financing is the other key factor
that influences significantly while calculating the optimal capital structure of the company. The
level of debt financing in the company is also a crucial part while calculating the associated
capital structure of the company. The cost of debt for the company can be calculated with the
help of the interest and debt levels in the financial statements of the company (Brusov et al.,
2018).
Capital Structure Theories
Capital Structure applies all relevant combination and various sources of finance that the
company can apply in the capital structure of the company. Capital Structure Theories include
Equity financing, Reserves, Preference Share Capital, Loan and Debentures. It is dependent on
the company to apply various sources of finance and the same should be compatible with the
operations and financials of the company (Onatca Engin, Unver Erbas & Sokmen, 2019). The
theories that can explain the capital structure prevailing are as follows:
Net Income Approach: The net income approach is approached by Duxoisrand and is
much favour of the financial decision of taking leverage. Any change in the leverage can
lead to the difference in the cost of capital for the company. The theory states that
addition in debt in the financial position of the company would ultimately be decreasing
the weighted average cost of capital for the company, which further would increase the
value of the firm (Serrasqueiro & Caetano, 2015).
Net Operating Income Approach: The theory was introduced by Durand and is
completely different from the Net Income Approach when the applicable taxation rate
⊘ This is a preview!⊘
Do you want full access?
Subscribe today to unlock all pages.
Trusted by 1+ million students worldwide
9FINANCIAL MANAGEMENT
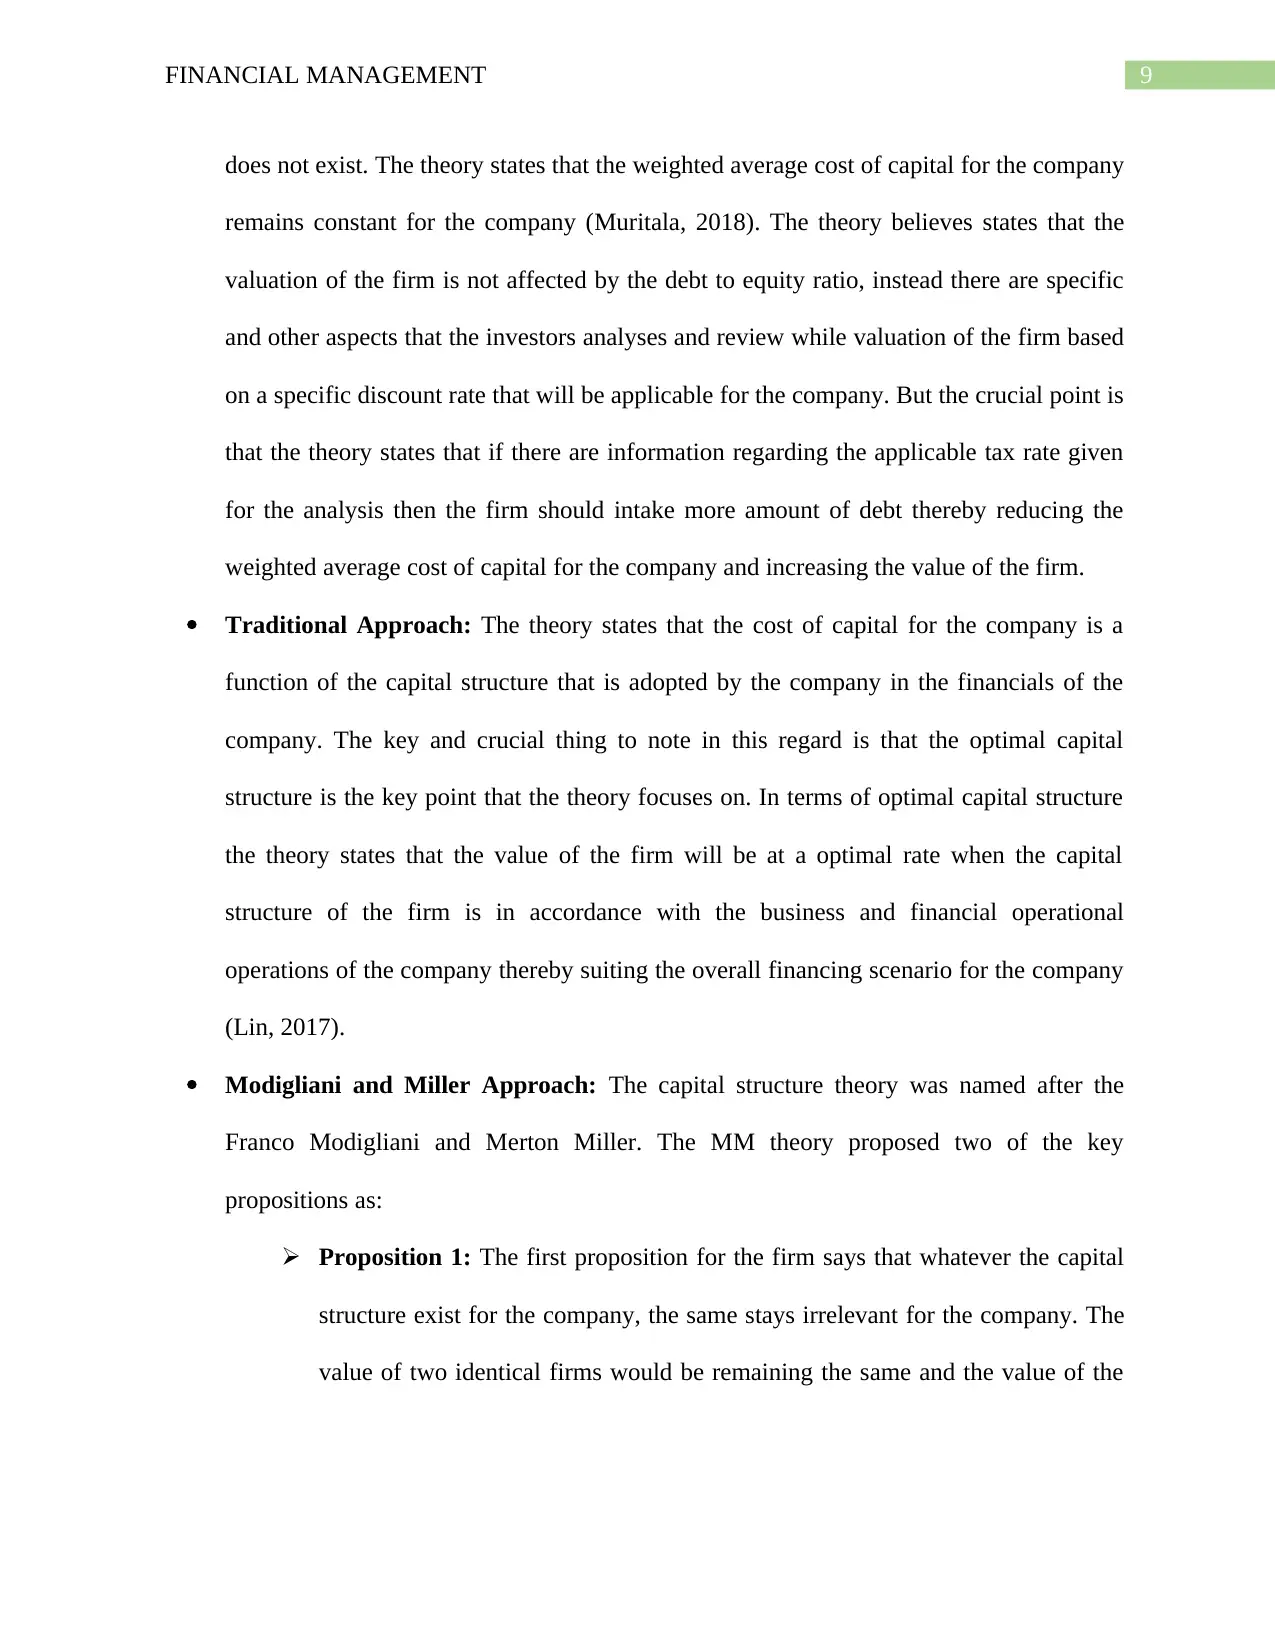
does not exist. The theory states that the weighted average cost of capital for the company
remains constant for the company (Muritala, 2018). The theory believes states that the
valuation of the firm is not affected by the debt to equity ratio, instead there are specific
and other aspects that the investors analyses and review while valuation of the firm based
on a specific discount rate that will be applicable for the company. But the crucial point is
that the theory states that if there are information regarding the applicable tax rate given
for the analysis then the firm should intake more amount of debt thereby reducing the
weighted average cost of capital for the company and increasing the value of the firm.
Traditional Approach: The theory states that the cost of capital for the company is a
function of the capital structure that is adopted by the company in the financials of the
company. The key and crucial thing to note in this regard is that the optimal capital
structure is the key point that the theory focuses on. In terms of optimal capital structure
the theory states that the value of the firm will be at a optimal rate when the capital
structure of the firm is in accordance with the business and financial operational
operations of the company thereby suiting the overall financing scenario for the company
(Lin, 2017).
Modigliani and Miller Approach: The capital structure theory was named after the
Franco Modigliani and Merton Miller. The MM theory proposed two of the key
propositions as:
Proposition 1: The first proposition for the firm says that whatever the capital
structure exist for the company, the same stays irrelevant for the company. The
value of two identical firms would be remaining the same and the value of the
Paraphrase This Document
Need a fresh take? Get an instant paraphrase of this document with our AI Paraphraser
10FINANCIAL MANAGEMENT
firm would not be affected by the choice of financing sources that would be
adopted by the company for the purpose of financing.
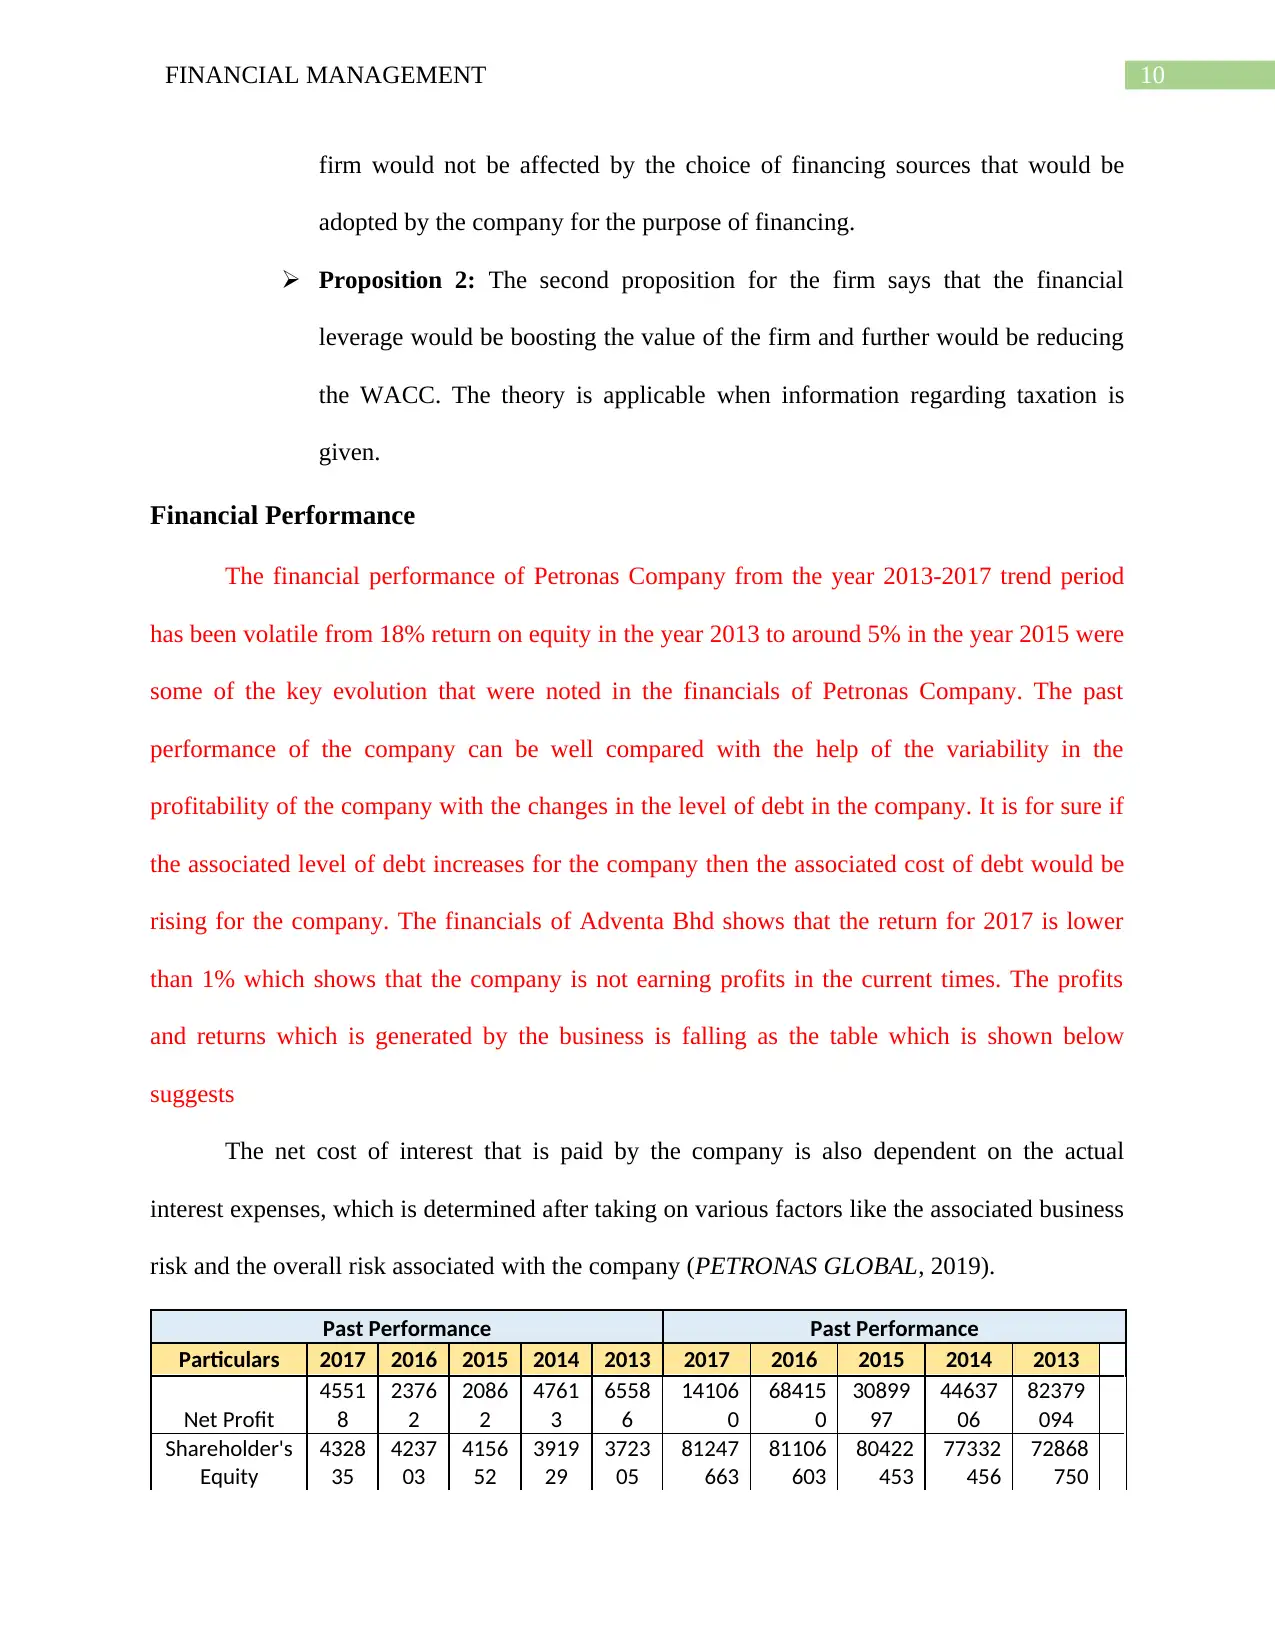
Proposition 2: The second proposition for the firm says that the financial
leverage would be boosting the value of the firm and further would be reducing
the WACC. The theory is applicable when information regarding taxation is
given.
Financial Performance
The financial performance of Petronas Company from the year 2013-2017 trend period
has been volatile from 18% return on equity in the year 2013 to around 5% in the year 2015 were
some of the key evolution that were noted in the financials of Petronas Company. The past
performance of the company can be well compared with the help of the variability in the
profitability of the company with the changes in the level of debt in the company. It is for sure if
the associated level of debt increases for the company then the associated cost of debt would be
rising for the company. The financials of Adventa Bhd shows that the return for 2017 is lower
than 1% which shows that the company is not earning profits in the current times. The profits
and returns which is generated by the business is falling as the table which is shown below
suggests
The net cost of interest that is paid by the company is also dependent on the actual
interest expenses, which is determined after taking on various factors like the associated business
risk and the overall risk associated with the company (PETRONAS GLOBAL, 2019).
Past Performance Past Performance
Particulars 2017 2016 2015 2014 2013 2017 2016 2015 2014 2013
Net Profit
4551
8
2376
2
2086
2
4761
3
6558
6
14106
0
68415
0
30899
97
44637
06
82379
094
Shareholder's
Equity
4328
35
4237
03
4156
52
3919
29
3723
05
81247
663
81106
603
80422
453
77332
456
72868
750
firm would not be affected by the choice of financing sources that would be
adopted by the company for the purpose of financing.
Proposition 2: The second proposition for the firm says that the financial
leverage would be boosting the value of the firm and further would be reducing
the WACC. The theory is applicable when information regarding taxation is
given.
Financial Performance
The financial performance of Petronas Company from the year 2013-2017 trend period
has been volatile from 18% return on equity in the year 2013 to around 5% in the year 2015 were
some of the key evolution that were noted in the financials of Petronas Company. The past
performance of the company can be well compared with the help of the variability in the
profitability of the company with the changes in the level of debt in the company. It is for sure if
the associated level of debt increases for the company then the associated cost of debt would be
rising for the company. The financials of Adventa Bhd shows that the return for 2017 is lower
than 1% which shows that the company is not earning profits in the current times. The profits
and returns which is generated by the business is falling as the table which is shown below
suggests
The net cost of interest that is paid by the company is also dependent on the actual
interest expenses, which is determined after taking on various factors like the associated business
risk and the overall risk associated with the company (PETRONAS GLOBAL, 2019).
Past Performance Past Performance
Particulars 2017 2016 2015 2014 2013 2017 2016 2015 2014 2013
Net Profit
4551
8
2376
2
2086
2
4761
3
6558
6
14106
0
68415
0
30899
97
44637
06
82379
094
Shareholder's
Equity
4328
35
4237
03
4156
52
3919
29
3723
05
81247
663
81106
603
80422
453
77332
456
72868
750
11FINANCIAL MANAGEMENT
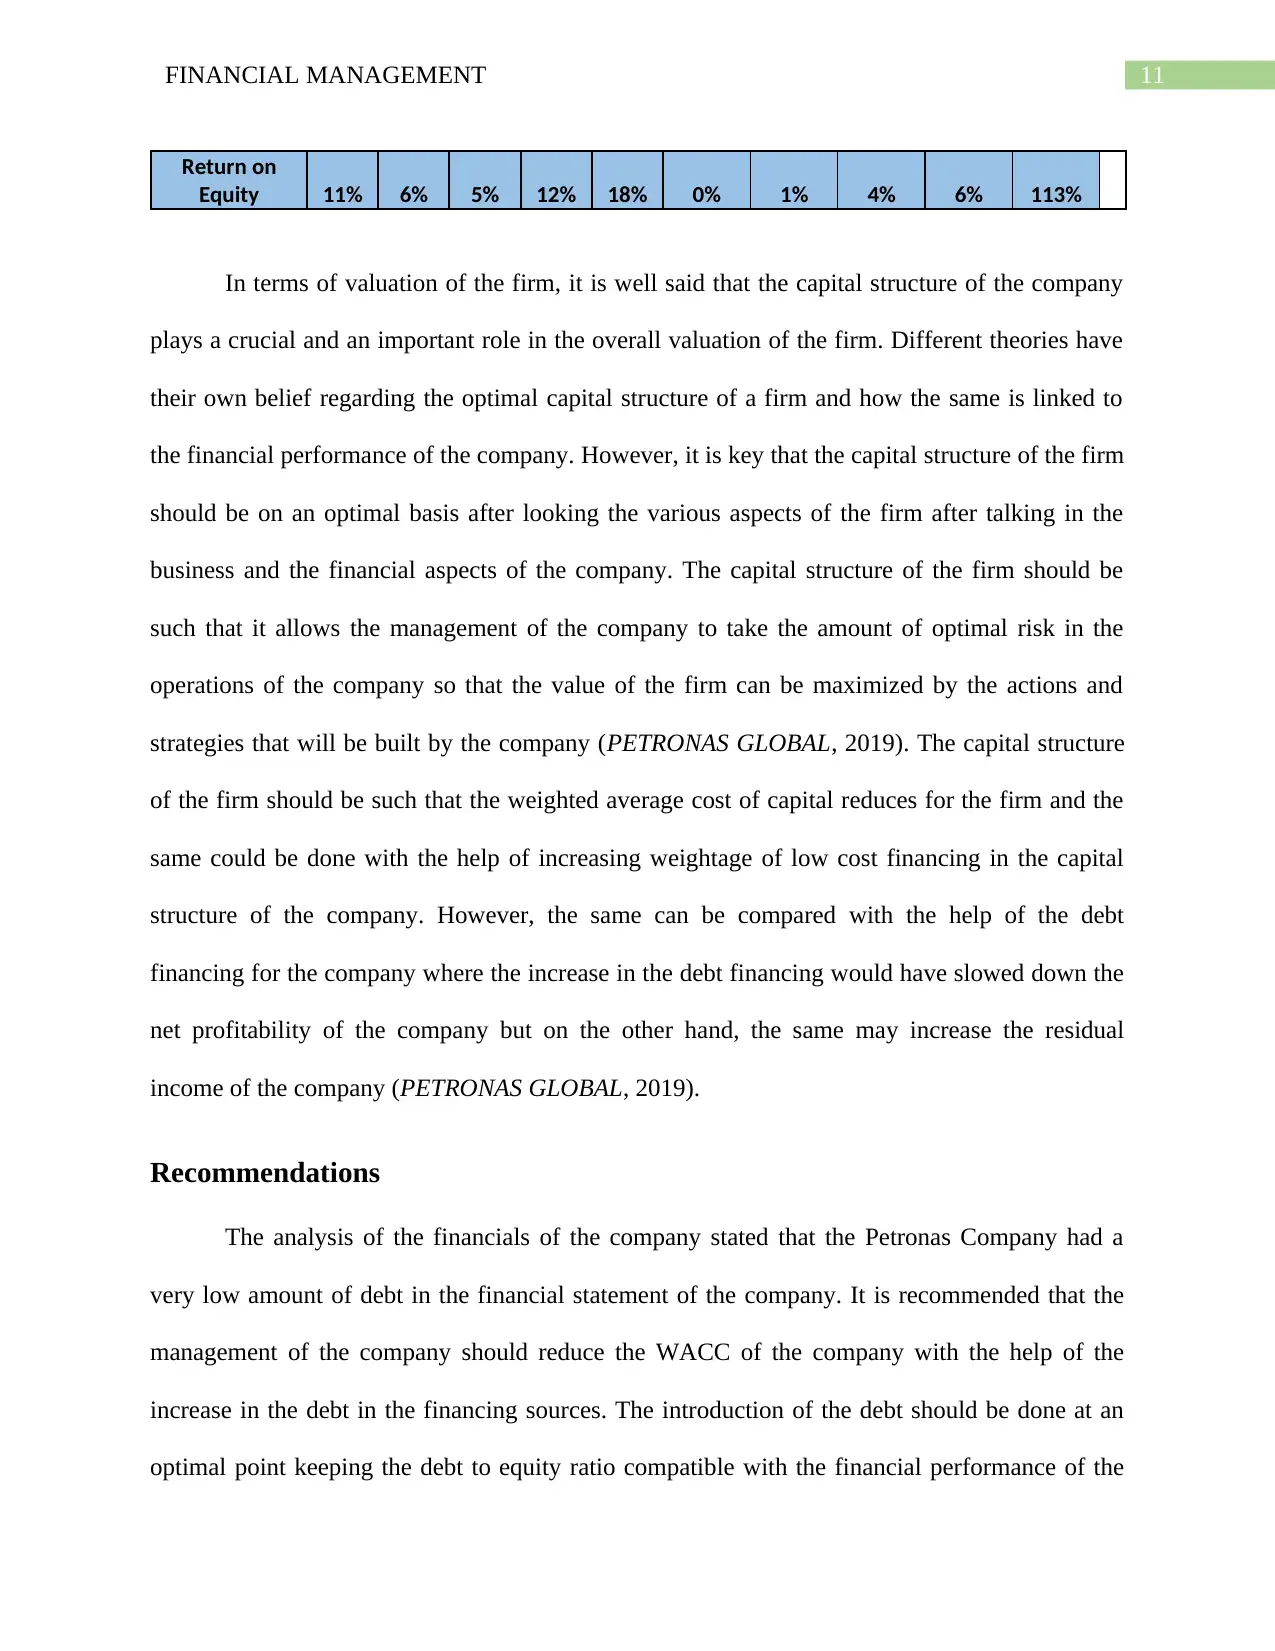
Return on
Equity 11% 6% 5% 12% 18% 0% 1% 4% 6% 113%
In terms of valuation of the firm, it is well said that the capital structure of the company
plays a crucial and an important role in the overall valuation of the firm. Different theories have
their own belief regarding the optimal capital structure of a firm and how the same is linked to
the financial performance of the company. However, it is key that the capital structure of the firm
should be on an optimal basis after looking the various aspects of the firm after talking in the
business and the financial aspects of the company. The capital structure of the firm should be
such that it allows the management of the company to take the amount of optimal risk in the
operations of the company so that the value of the firm can be maximized by the actions and
strategies that will be built by the company (PETRONAS GLOBAL, 2019). The capital structure
of the firm should be such that the weighted average cost of capital reduces for the firm and the
same could be done with the help of increasing weightage of low cost financing in the capital
structure of the company. However, the same can be compared with the help of the debt
financing for the company where the increase in the debt financing would have slowed down the
net profitability of the company but on the other hand, the same may increase the residual
income of the company (PETRONAS GLOBAL, 2019).
Recommendations
The analysis of the financials of the company stated that the Petronas Company had a
very low amount of debt in the financial statement of the company. It is recommended that the
management of the company should reduce the WACC of the company with the help of the
increase in the debt in the financing sources. The introduction of the debt should be done at an
optimal point keeping the debt to equity ratio compatible with the financial performance of the
⊘ This is a preview!⊘
Do you want full access?
Subscribe today to unlock all pages.
Trusted by 1+ million students worldwide
1 out of 16
Related Documents


Your All-in-One AI-Powered Toolkit for Academic Success.
+13062052269
info@desklib.com
Available 24*7 on WhatsApp / Email
![[object Object]](/_next/static/media/star-bottom.7253800d.svg)
Unlock your academic potential
Copyright © 2020–2026 A2Z Services. All Rights Reserved. Developed and managed by ZUCOL.