Analysis of APN Outdoor Group's Capital Structure and Finance Report
VerifiedAdded on 2020/03/23
|10
|1416
|45
Report
AI Summary
This report provides a comprehensive analysis of APN Outdoor Group's capital structure, focusing on key financial metrics and investment strategies. It begins with an overview of capital budgeting techniques, specifically net present value, and profitability index. The report then delves into APN's capital structure, calculating the weighted average cost of capital (WACC) and examining the company's debt and equity composition. A comparative analysis of financial ratios, including earnings per share, price-earnings ratio, current ratio, and interest coverage ratio, is conducted to assess APN's financial performance. The report also compares APN with a competitor, Ooh Media, to highlight similarities and differences in their capital structures. Finally, the report concludes with a summary of findings, emphasizing the importance of capital structure in influencing the market value of the organization and making recommendations for optimizing the cost of capital. The references cited support the analysis with relevant academic literature.
Running head: ACCOUNTING & FINANCE
Accounting & Finance
Name of the Student:
Name of the University:
Author’s Note:
Accounting & Finance
Name of the Student:
Name of the University:
Author’s Note:
Paraphrase This Document
Need a fresh take? Get an instant paraphrase of this document with our AI Paraphraser
1ACCOUNTING & FINANCE
Table of Contents
Answer to Part A:............................................................................................................................2
Requirement 1:.............................................................................................................................2
Requirement 2:.............................................................................................................................4
Requirement 3:.............................................................................................................................4
Answer to PART B:.........................................................................................................................5
Introduction:................................................................................................................................5
Analysis of APN’s capital structure:...........................................................................................5
Computation of After-Tax WACC:.............................................................................................6
Analysis of financial ratio of APN:.............................................................................................6
APN outdoor group and its competitor performance:.................................................................6
Capital structure of APN Outdoor group:....................................................................................7
Conclusion:..................................................................................................................................8
References:......................................................................................................................................9

2ACCOUNTING & FINANCE
Answer to Part A:
Requirement 1:
Particulars 0 1 2 3 4 5 6 7 8
Initial Investment ($1,650,000)
Annual Cash Flow:
Incremental Revene $1,445,000 $1,589,500 $1,748,450 $1,923,295 $2,115,625 $2,327,187 $2,559,906 $2,815,896
Staff Cost ($900,000) ($954,000) ($1,011,240) ($1,071,914) ($1,136,229) ($1,204,403) ($1,276,667) ($1,353,267)
Material Costs ($210,000) ($222,600) ($235,956) ($250,113) ($265,120) ($281,027) ($297,889) ($315,762)
Marketing Costs ($46,000) ($48,760) ($51,686) ($54,787) ($58,074) ($61,558) ($65,252) ($69,167)
Other Costs ($25,000) ($26,500) ($28,090) ($29,775) ($31,562) ($33,456) ($35,463) ($37,591)
Depreciation of Lab ($206,250) ($206,250) ($206,250) ($206,250) ($206,250) ($206,250) ($206,250) ($206,250)
Net Profit before Tax $57,750 $131,390 $215,228 $310,455 $418,389 $540,493 $678,385 $833,859
Less: Tax on Profit ($17,325) ($39,417) ($64,569) ($93,137) ($125,517) ($162,148) ($203,515) ($250,158)
Net Profit after Tax $40,425 $91,973 $150,660 $217,319 $292,872 $378,345 $474,869 $583,701
Add: Depreciation $206,250 $206,250 $206,250 $206,250 $206,250 $206,250 $206,250 $206,250
Annual After-Tax Cash Flow $246,675 $298,223 $356,910 $423,569 $499,122 $584,595 $681,119 $789,951
Salvage Value $100,000
Net Annual Cash Flow ($1,650,000) $246,675 $298,223 $356,910 $423,569 $499,122 $584,595 $681,119 $889,951
Cumulative Cash Flow ($1,650,000) ($1,403,325) ($1,105,102) ($748,192) ($324,624) $174,499 $759,094 $1,440,213 $2,330,164
Payback Period
Required Rate of Return 16% 16% 16% 16% 16% 16% 16% 16% 16%
Discounted Cash Flow ($1,650,000) $212,651 $221,628 $228,657 $233,933 $237,639 $239,942 $241,000 $271,458
Cumulative Discounted Cash Flow ($1,650,000) ($1,437,349) ($1,215,721) ($987,064) ($753,131) ($515,492) ($275,550) ($34,549) $236,908
Discounted Payback period
Net Present Value
Profitability Index
4.65
7.13
$236,908
114.36%
Period
Capital Budgeting for Base-Case:
⊘ This is a preview!⊘
Do you want full access?
Subscribe today to unlock all pages.
Trusted by 1+ million students worldwide

3ACCOUNTING & FINANCE
Particulars 0 1 2 3 4 5 6 7 8
Initial Investment ($1,650,000)
Annual Cash Flow:
Incremental Revene $1,445,000 $1,531,700 $1,623,602 $1,721,018 $1,824,279 $1,933,736 $2,049,760 $2,172,746
Staff Cost ($900,000) ($990,000) ($1,089,000) ($1,197,900) ($1,317,690) ($1,449,459) ($1,594,405) ($1,753,845)
Material Costs ($210,000) ($231,000) ($254,100) ($279,510) ($307,461) ($338,207) ($372,028) ($409,231)
Marketing Costs ($46,000) ($50,600) ($55,660) ($61,226) ($67,349) ($74,083) ($81,492) ($89,641)
Other Costs ($25,000) ($27,500) ($30,250) ($33,275) ($36,603) ($40,263) ($44,289) ($48,718)
Depreciation of Lab ($206,250) ($206,250) ($206,250) ($206,250) ($206,250) ($206,250) ($206,250) ($206,250)
Net Profit before Tax $57,750 $26,350 ($11,658) ($57,143) ($111,073) ($174,526) ($248,703) ($334,939)
Less: Tax on Profit ($17,325) ($7,905) $3,497 $17,143 $33,322 $52,358 $74,611 $100,482
Net Profit after Tax $40,425 $18,445 ($8,161) ($40,000) ($77,751) ($122,168) ($174,092) ($234,457)
Add: Depreciation $206,250 $206,250 $206,250 $206,250 $206,250 $206,250 $206,250 $206,250
Annual After-Tax Cash Flow $246,675 $224,695 $198,089 $166,250 $128,499 $84,082 $32,158 ($28,207)
Salvage Value $100,000
Net Annual Cash Flow ($1,650,000) $246,675 $224,695 $198,089 $166,250 $128,499 $84,082 $32,158 $71,793
Cumulative Cash Flow ($1,650,000) ($1,403,325) ($1,178,630) ($980,541) ($814,291) ($685,792) ($601,710) ($569,552) ($497,760)
Payback Period
Required Rate of Return 16% 16% 16% 16% 16% 16% 16% 16% 16%
Discounted Cash Flow ($1,650,000) $212,651 $166,985 $126,907 $91,818 $61,180 $34,511 $11,378 $21,899
Cumulative Discounted Cash Flow ($1,650,000) ($1,437,349) ($1,270,364) ($1,143,457) ($1,051,638) ($990,458) ($955,948) ($944,569) ($922,671)
Discounted Payback period
Net Present Value
Profitability Index
Capital Budgeting for Worst-Case:
Period
10.34
50.13
($922,671)
44.08%
Paraphrase This Document
Need a fresh take? Get an instant paraphrase of this document with our AI Paraphraser
4ACCOUNTING & FINANCE
Particulars 0 1 2 3 4 5 6 7 8
Initial Investment ($1,650,000)
Annual Cash Flow:
Incremental Revene $1,445,000 $1,661,750 $1,911,013 $2,197,664 $2,527,314 $2,906,411 $3,342,373 $3,843,729
Staff Cost ($900,000) ($927,000) ($954,810) ($983,454) ($1,012,958) ($1,043,347) ($1,074,647) ($1,106,886)
Material Costs ($210,000) ($216,300) ($222,789) ($229,473) ($236,357) ($243,448) ($250,751) ($258,274)
Marketing Costs ($46,000) ($47,380) ($48,801) ($50,265) ($51,773) ($53,327) ($54,926) ($56,574)
Other Costs ($25,000) ($25,750) ($26,523) ($27,318) ($28,138) ($28,982) ($29,851) ($30,747)
Depreciation of Lab ($206,250) ($206,250) ($206,250) ($206,250) ($206,250) ($206,250) ($206,250) ($206,250)
Net Profit before Tax $57,750 $239,070 $451,840 $700,904 $991,838 $1,331,058 $1,725,947 $2,184,998
Less: Tax on Profit ($17,325) ($71,721) ($135,552) ($210,271) ($297,551) ($399,318) ($517,784) ($655,499)
Net Profit after Tax $40,425 $167,349 $316,288 $490,633 $694,287 $931,741 $1,208,163 $1,529,498
Add: Depreciation $206,250 $206,250 $206,250 $206,250 $206,250 $206,250 $206,250 $206,250
Annual After-Tax Cash Flow $246,675 $373,599 $522,538 $696,883 $900,537 $1,137,991 $1,414,413 $1,735,748
Salvage Value $100,000
Net Annual Cash Flow ($1,650,000) $246,675 $373,599 $522,538 $696,883 $900,537 $1,137,991 $1,414,413 $1,835,748
Cumulative Cash Flow ($1,650,000) ($1,403,325) ($1,029,726) ($507,188) $189,694 $1,090,231 $2,228,222 $3,642,635 $5,478,383
Payback Period
Required Rate of Return 16% 16% 16% 16% 16% 16% 16% 16% 16%
Discounted Cash Flow ($1,650,000) $212,651 $277,645 $334,768 $384,882 $428,757 $467,080 $500,461 $559,950
Cumulative Discounted Cash Flow ($1,650,000) ($1,437,349) ($1,159,704) ($824,936) ($440,054) ($11,297) $455,782 $956,244 $1,516,194
Discounted Payback period
Net Present Value
Profitability Index
Capital Budgeting for Best-Case:
Period
3.79
5.29
$1,516,194
191.89%
Requirement 2:
Capital budgeting approaches involves many techniques for the projections of cases. In
above table, net present value technique has been used for estimating the future cash flow of
project. Other technique involves payback period and average rate of return that can be used for
estimating the riskiness of projects.
Requirement 3:
From the above table, it can be seen that the net present value is positive and the
profitability index of project is at 191.89%. A positive net present value of project is indicative
5ACCOUNTING & FINANCE
of the fact that project is viable and organization should undertake investments. Cost benefit ratio
of project is measured with the help of profitability index and here the value of 191.89%
indicates that present value of future cash flow is more than the initial amount of investment
made by organization (Andor et al., 2015). Some of further information for acceptance and
rejection of project can be made by application of other capital budgeting techniques such as
payback period and average rate of return.
Answer to PART B:
Introduction:
The report is prepared to understating the capital structure of APN Outdoor group that is
listed on Australian stock exchange. Report demonstrates the calculation of weighted average
cost of capital and analysis of key financial ratios of organization.
Analysis of APN’s capital structure:
Weighted average cost of capital of APO is calculated to at 8.32%. An additional amount
of $181.8 equity was raised by APN in year 2016 for establishing new capital structures. Group
intends to reduce cost of capital by maintainingoptimal capital structure. The cost of capital of
APN can be reduced further by increasing the proportion of debt value in their capital structure.
From the analysis of annual report, it can be analyzed that during financial year 2016, the
proportion of debt in capital structure has reduced. The reason is attributable to the fact that there
issued equity capital has increased and interest-bearing liabilities has reduced in recent year. To
total value of equity has increased significantly from $ 461525 in year 2015 to $ 836465 in year
2016. Value of total debt to total equity stood at 38.1 in current financial year and total debt to
total capital stood at 27.61.
⊘ This is a preview!⊘
Do you want full access?
Subscribe today to unlock all pages.
Trusted by 1+ million students worldwide
6ACCOUNTING & FINANCE
Computation of After-Tax WACC:
Particulars Amount Weightage Return Rate
Weighted
Return
Total Equity Capital $836,465 83.83% 8.38% 7.03%
Total Debt Capital $161,309 16.17% 11.42% 1.85%
Tax Rate 30%
After-Tax Weighted Average Cost
of Capital 8.32%
Computation of After-Tax Weighted Avergae Cost of Capital:
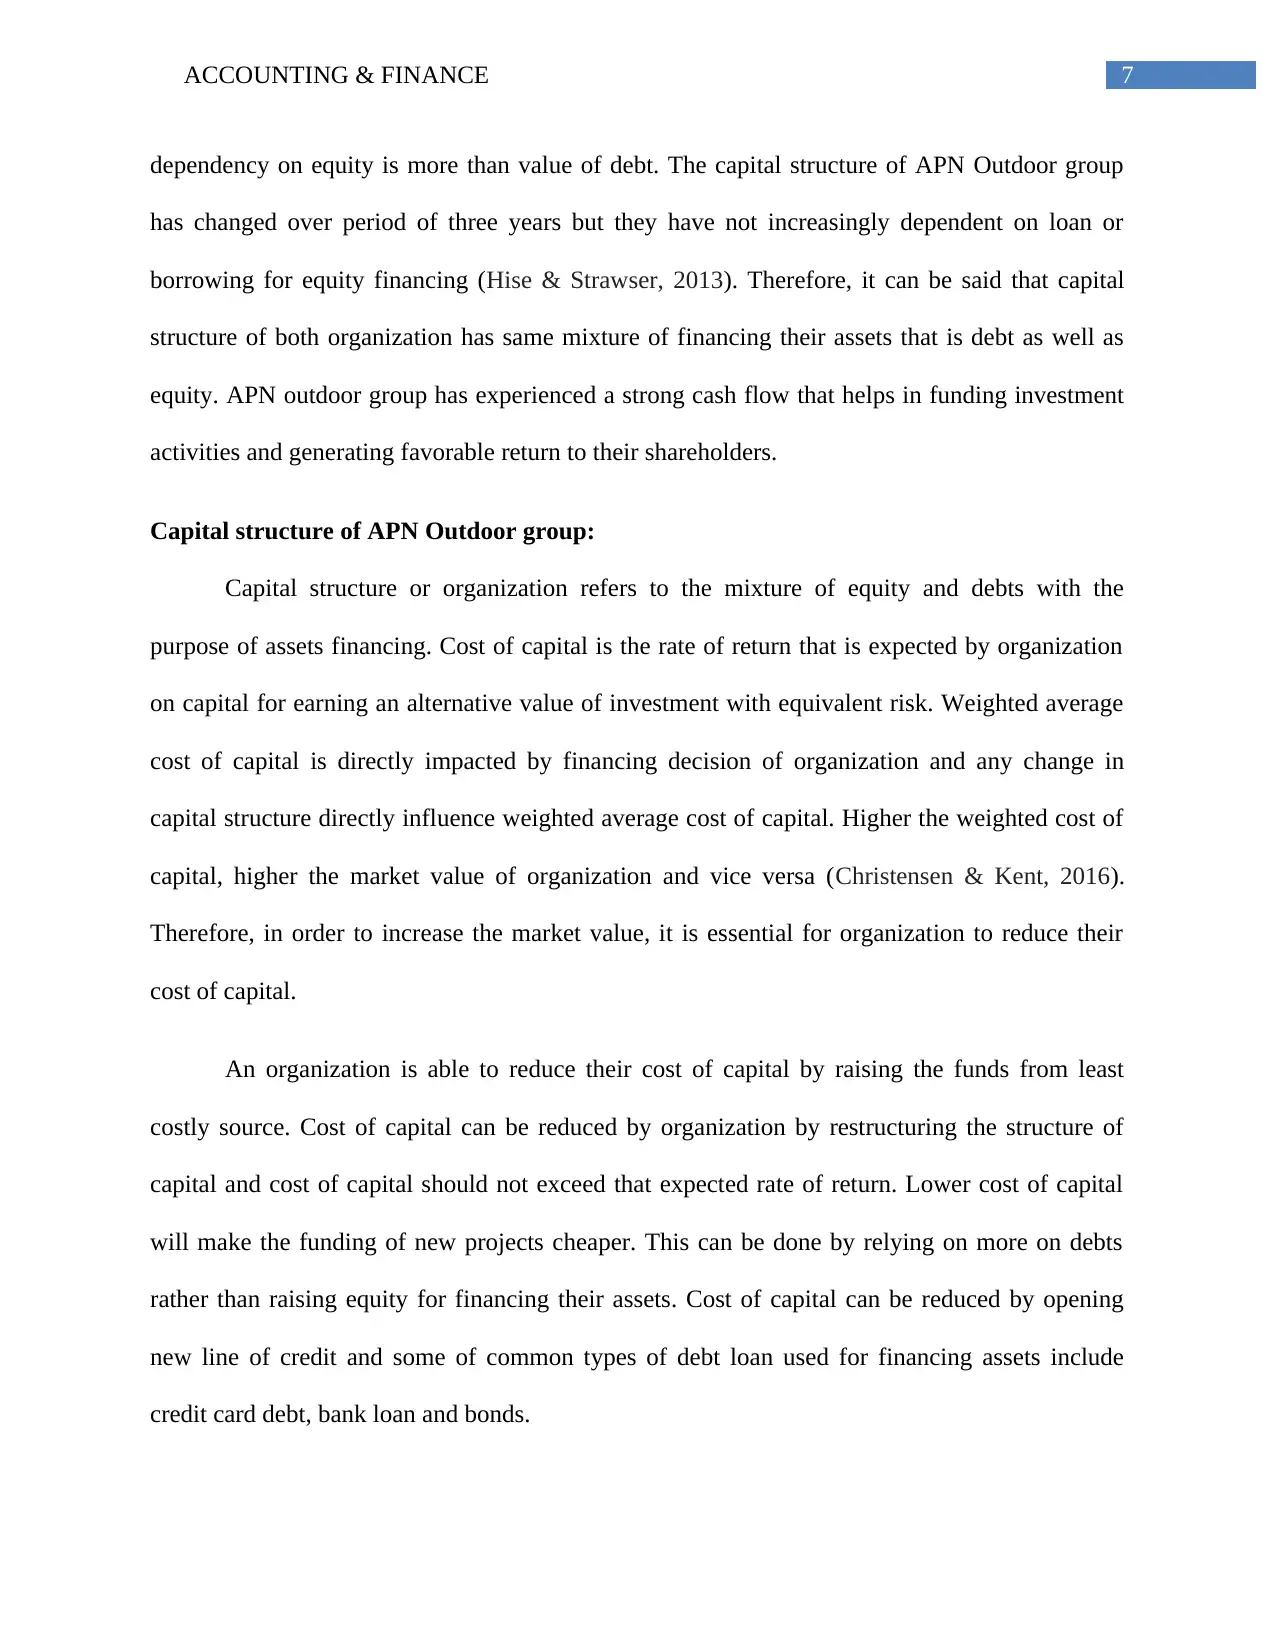
Analysis of financial ratio of APN:
Net operating cash flow of organization has reduced significantly during last three
financial year. Over three years, earning per share of group was 19% below target due to
strategic activities and in the current year, the value stood at 0.29. There has been considerable
decline in earnings per share declined from 44.4 in year 2015 to 31.4 in year 2016. Price earnings
ratio for year 2017 stood at 16.92.
Analysis of liquidity position of organization is performed by looking at figure of current
ratio, quick ratio and cash ratio. Cash ratio of APN is at 0.38, current ratio is at 1.90 and quick
ratio at 1.89. Interest coverage ratio of organization is recorded at 25.96 and long-term debt to
total assets is at 0.23.
APN outdoor group and its competitor performance:
Ooh Media is one of the competitors of APN Outdoor group. The capital structure of
organization involves mixture of both equity and borrowings. Value of equity capital increased
along with borrowings by organization. Therefore, it can be seen that capital structure of APN
Outdoor group has mixture of both debt and equity in their capital structure. However, their
Computation of After-Tax WACC:
Particulars Amount Weightage Return Rate
Weighted
Return
Total Equity Capital $836,465 83.83% 8.38% 7.03%
Total Debt Capital $161,309 16.17% 11.42% 1.85%
Tax Rate 30%
After-Tax Weighted Average Cost
of Capital 8.32%
Computation of After-Tax Weighted Avergae Cost of Capital:
Analysis of financial ratio of APN:
Net operating cash flow of organization has reduced significantly during last three
financial year. Over three years, earning per share of group was 19% below target due to
strategic activities and in the current year, the value stood at 0.29. There has been considerable
decline in earnings per share declined from 44.4 in year 2015 to 31.4 in year 2016. Price earnings
ratio for year 2017 stood at 16.92.
Analysis of liquidity position of organization is performed by looking at figure of current
ratio, quick ratio and cash ratio. Cash ratio of APN is at 0.38, current ratio is at 1.90 and quick
ratio at 1.89. Interest coverage ratio of organization is recorded at 25.96 and long-term debt to
total assets is at 0.23.
APN outdoor group and its competitor performance:
Ooh Media is one of the competitors of APN Outdoor group. The capital structure of
organization involves mixture of both equity and borrowings. Value of equity capital increased
along with borrowings by organization. Therefore, it can be seen that capital structure of APN
Outdoor group has mixture of both debt and equity in their capital structure. However, their
Paraphrase This Document
Need a fresh take? Get an instant paraphrase of this document with our AI Paraphraser
7ACCOUNTING & FINANCE
dependency on equity is more than value of debt. The capital structure of APN Outdoor group
has changed over period of three years but they have not increasingly dependent on loan or
borrowing for equity financing (Hise & Strawser, 2013). Therefore, it can be said that capital
structure of both organization has same mixture of financing their assets that is debt as well as
equity. APN outdoor group has experienced a strong cash flow that helps in funding investment
activities and generating favorable return to their shareholders.
Capital structure of APN Outdoor group:
Capital structure or organization refers to the mixture of equity and debts with the
purpose of assets financing. Cost of capital is the rate of return that is expected by organization
on capital for earning an alternative value of investment with equivalent risk. Weighted average
cost of capital is directly impacted by financing decision of organization and any change in
capital structure directly influence weighted average cost of capital. Higher the weighted cost of
capital, higher the market value of organization and vice versa (Christensen & Kent, 2016).
Therefore, in order to increase the market value, it is essential for organization to reduce their
cost of capital.
An organization is able to reduce their cost of capital by raising the funds from least
costly source. Cost of capital can be reduced by organization by restructuring the structure of
capital and cost of capital should not exceed that expected rate of return. Lower cost of capital
will make the funding of new projects cheaper. This can be done by relying on more on debts
rather than raising equity for financing their assets. Cost of capital can be reduced by opening
new line of credit and some of common types of debt loan used for financing assets include
credit card debt, bank loan and bonds.
8ACCOUNTING & FINANCE
Conclusion:
From the above analysis, it can be said that the capital structure of APN group comprise
of both equity and debentures. They have been providing satisfactory return to shareholders and
been paying increased dividends to their shareholders. Revenue and earnings before interest and
taxes of organization has experienced an upward trend that helps in generating satisfactory return
to shareholders (Rossi, 2014).
⊘ This is a preview!⊘
Do you want full access?
Subscribe today to unlock all pages.
Trusted by 1+ million students worldwide
9ACCOUNTING & FINANCE
References:
Andor, G., Mohanty, S. K., & Toth, T. (2015). Capital budgeting practices: A survey of Central
and Eastern European firms. Emerging Markets Review, 23, 148-172.
Brief, R. P., & Peasnell, K. V. (Eds.). (2013). Clean surplus: A link between accounting and
finance. Routledge.
Christensen, J., & Kent, P. (2016). The decision to outsource risk management
services. Accounting & Finance, 56(4), 985-1015.
Gerrans, P., Faff, R., & Hartnett, N. (2015). Individual financial risk tolerance and the global
financial crisis. Accounting & Finance, 55(1), 165-185.
Hasan, M. (2013). Capital budgeting techniques used by small manufacturing
companies. Journal of Service Science and Management, 6(01), 38.
Hise, R. T., & Strawser, R. H. (2013). Application of Capital Budgeting Techniques to
Marketing Operations. Readings in Managerial Economics: Pergamon International
Library of Science, Technology, Engineering and Social Studies, 419.
Loughran, T., & McDonald, B. (2016). Textual analysis in accounting and finance: A
survey. Journal of Accounting Research, 54(4), 1187-1230.
Rossi, M. (2014). Capital budgeting in Europe: confronting theory with practice. International
Journal of Managerial and Financial Accounting, 6(4), 341-356.
1 out of 10
Related Documents


Your All-in-One AI-Powered Toolkit for Academic Success.
+13062052269
info@desklib.com
Available 24*7 on WhatsApp / Email
![[object Object]](/_next/static/media/star-bottom.7253800d.svg)
Unlock your academic potential
Copyright © 2020–2026 A2Z Services. All Rights Reserved. Developed and managed by ZUCOL.