Finance Report: Westpac Bank Capital Structure and Dividend Policy
VerifiedAdded on 2020/04/13
|7
|891
|39
Report
AI Summary
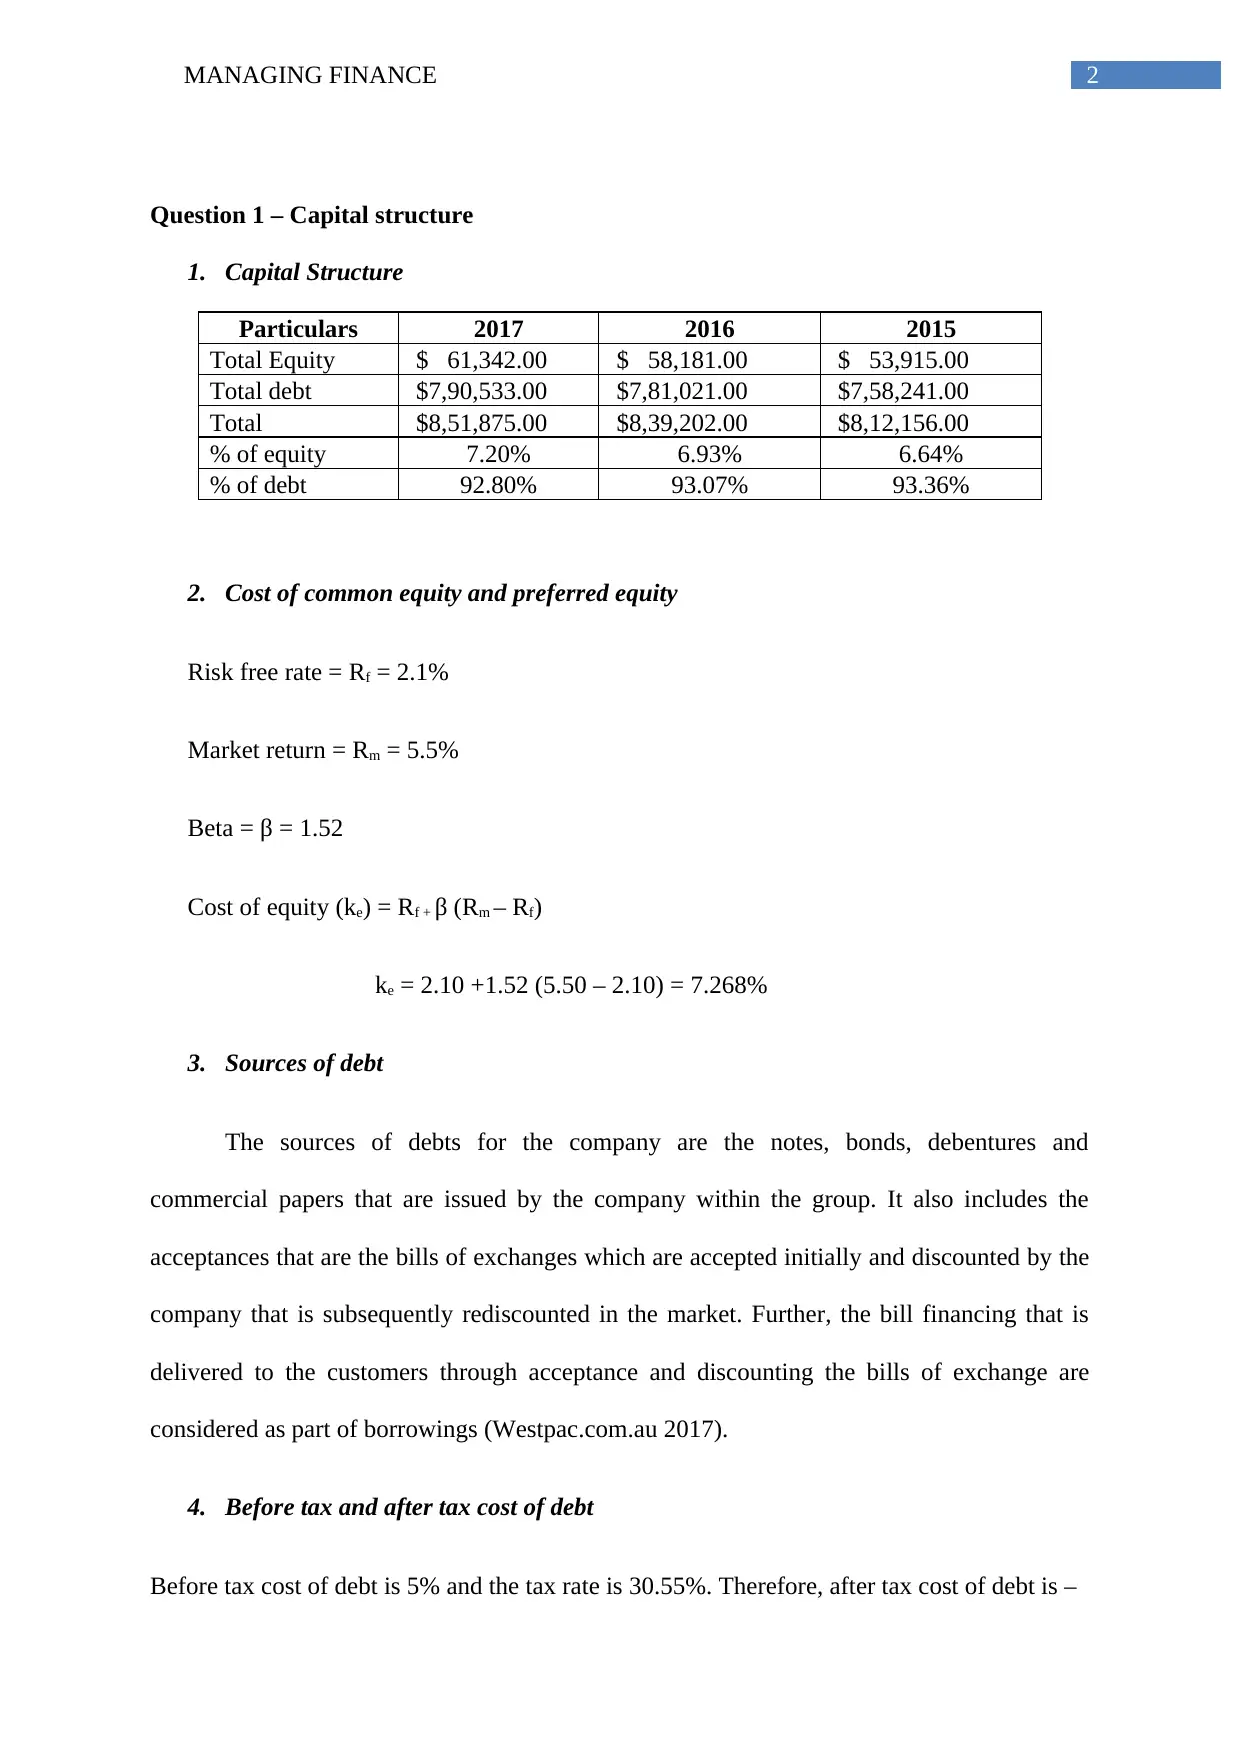
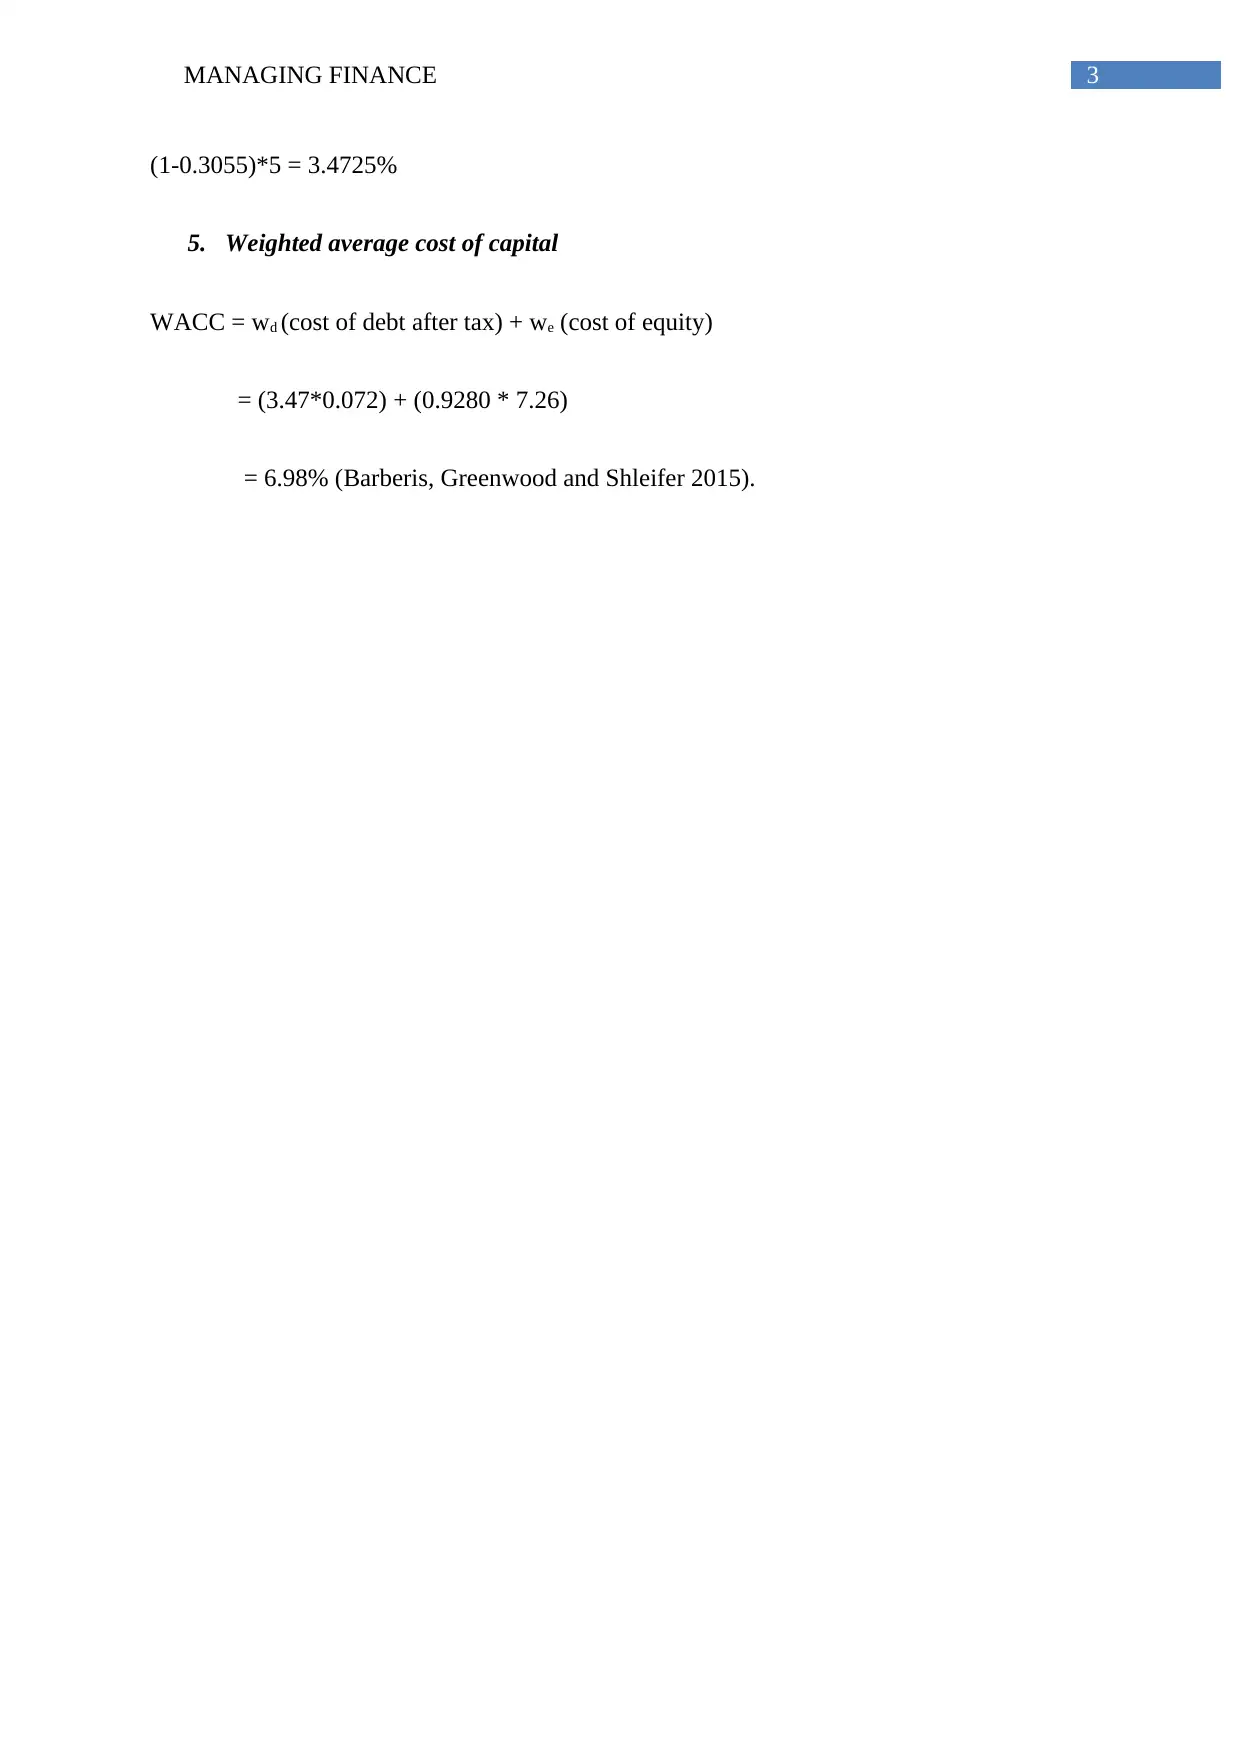
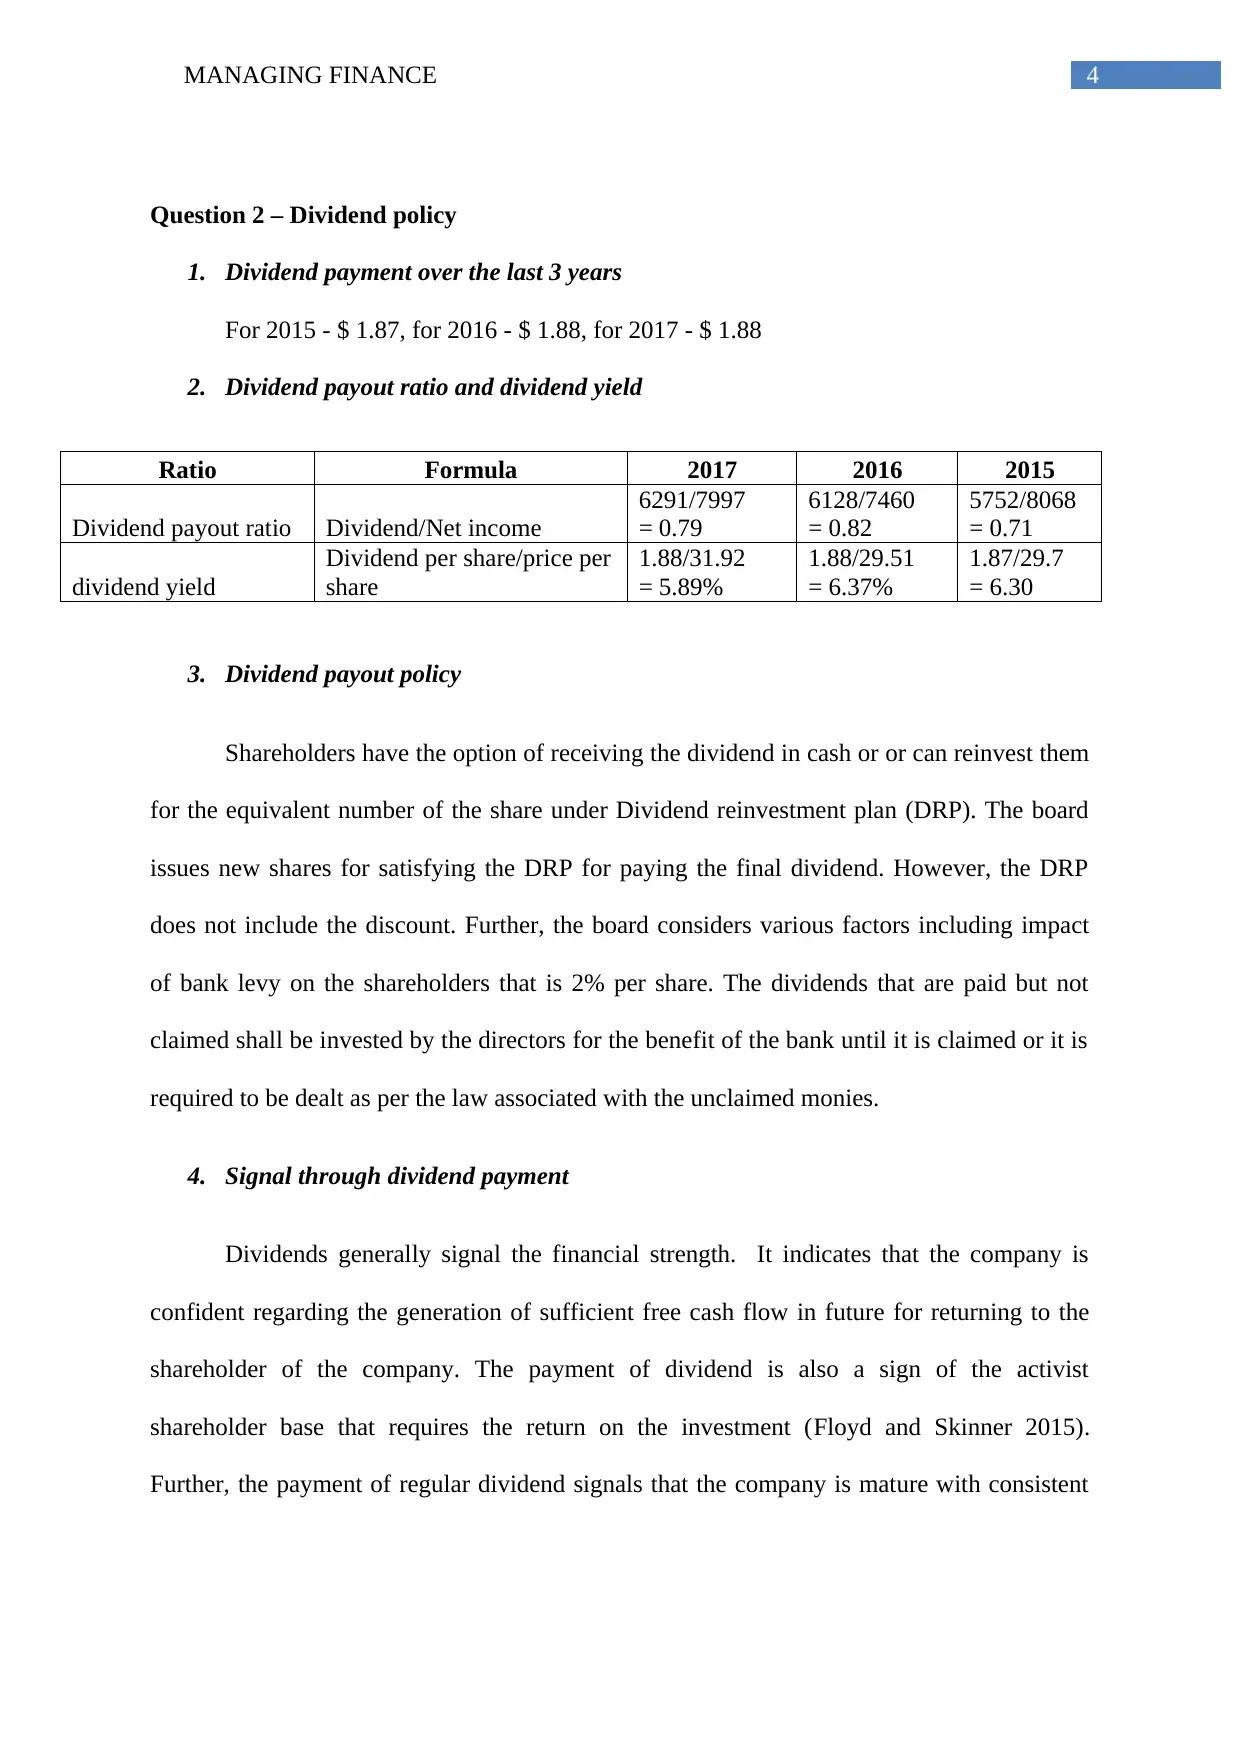
This finance report analyzes the capital structure and dividend policy of Westpac Bank. It begins by examining the capital structure, presenting data on total equity and debt from 2015 to 2017, calculating the percentage of equity and debt, and determining the cost of equity and debt. The report then ...

Running head: MANAGING FINANCE
Managing finance
Name of the student
Name of the university
Author note
Managing finance
Name of the student
Name of the university
Author note
Paraphrase This Document
Need a fresh take? Get an instant paraphrase of this document with our AI Paraphraser

1MANAGING FINANCE
Table of Contents
Question 1 – Capital structure....................................................................................................2
Question 2 – Dividend policy....................................................................................................4
Reference....................................................................................................................................6

2MANAGING FINANCE
Question 1 – Capital structure
1. Capital Structure
Particulars 2017 2016 2015
Total Equity $ 61,342.00 $ 58,181.00 $ 53,915.00
Total debt $7,90,533.00 $7,81,021.00 $7,58,241.00
Total $8,51,875.00 $8,39,202.00 $8,12,156.00
% of equity 7.20% 6.93% 6.64%
% of debt 92.80% 93.07% 93.36%
2. Cost of common equity and preferred equity
Risk free rate = Rf = 2.1%
Market return = Rm = 5.5%
Beta = β = 1.52
Cost of equity (ke) = Rf + β (Rm – Rf)
ke = 2.10 +1.52 (5.50 – 2.10) = 7.268%
3. Sources of debt
The sources of debts for the company are the notes, bonds, debentures and
commercial papers that are issued by the company within the group. It also includes the
acceptances that are the bills of exchanges which are accepted initially and discounted by the
company that is subsequently rediscounted in the market. Further, the bill financing that is
delivered to the customers through acceptance and discounting the bills of exchange are
considered as part of borrowings (Westpac.com.au 2017).
4. Before tax and after tax cost of debt
Before tax cost of debt is 5% and the tax rate is 30.55%. Therefore, after tax cost of debt is –
⊘ This is a preview!⊘
Do you want full access?
Subscribe today to unlock all pages.

Trusted by 1+ million students worldwide

3MANAGING FINANCE
(1-0.3055)*5 = 3.4725%
5. Weighted average cost of capital
WACC = wd (cost of debt after tax) + we (cost of equity)
= (3.47*0.072) + (0.9280 * 7.26)
= 6.98% (Barberis, Greenwood and Shleifer 2015).
(1-0.3055)*5 = 3.4725%
5. Weighted average cost of capital
WACC = wd (cost of debt after tax) + we (cost of equity)
= (3.47*0.072) + (0.9280 * 7.26)
= 6.98% (Barberis, Greenwood and Shleifer 2015).
Paraphrase This Document
Need a fresh take? Get an instant paraphrase of this document with our AI Paraphraser

4MANAGING FINANCE
Question 2 – Dividend policy
1. Dividend payment over the last 3 years
For 2015 - $ 1.87, for 2016 - $ 1.88, for 2017 - $ 1.88
2. Dividend payout ratio and dividend yield
Ratio Formula 2017 2016 2015
Dividend payout ratio Dividend/Net income
6291/7997
= 0.79
6128/7460
= 0.82
5752/8068
= 0.71
dividend yield
Dividend per share/price per
share
1.88/31.92
= 5.89%
1.88/29.51
= 6.37%
1.87/29.7
= 6.30
3. Dividend payout policy
Shareholders have the option of receiving the dividend in cash or or can reinvest them
for the equivalent number of the share under Dividend reinvestment plan (DRP). The board
issues new shares for satisfying the DRP for paying the final dividend. However, the DRP
does not include the discount. Further, the board considers various factors including impact
of bank levy on the shareholders that is 2% per share. The dividends that are paid but not
claimed shall be invested by the directors for the benefit of the bank until it is claimed or it is
required to be dealt as per the law associated with the unclaimed monies.
4. Signal through dividend payment
Dividends generally signal the financial strength. It indicates that the company is
confident regarding the generation of sufficient free cash flow in future for returning to the
shareholder of the company. The payment of dividend is also a sign of the activist
shareholder base that requires the return on the investment (Floyd and Skinner 2015).
Further, the payment of regular dividend signals that the company is mature with consistent

5MANAGING FINANCE
profits and sales. Suspension or reduction in payment of regular dividend is the signal for
financial decline and issues in cash flows.
5. Dividend policy with regard to the industry
Dividend payout ratio in Australian banking industry is higher as compared to other
country’s banking industries. Banks are generally owned by the shareholders and the
shareholders get benefitted from profits that remain after the tax payment. Banks distributes a
large portion of the profits as dividends. The dividend payout ratio of Australian banking
industry is 69% to 83% whereas the dividend payout ratio of Westpac bank for the year 2015,
2016 and 2017 is 71%, 82% and 79% respectively (Attiget al. 2016). Therefore, the dividend
policy of Westpac Bank is in accordance with the industry practice of Australian banking
sector.
⊘ This is a preview!⊘
Do you want full access?
Subscribe today to unlock all pages.

Trusted by 1+ million students worldwide

6MANAGING FINANCE
Reference
Attig, N., Boubakri, N., El Ghoul, S. and Guedhami, O., 2016. The global financial crisis,
family control, and dividend policy. Financial Management, 45(2), pp.291-313.
Barberis, N., Greenwood, R., Jin, L. and Shleifer, A., 2015. X-CAPM: An extrapolative
capital asset pricing model. Journal of Financial Economics, 115(1), pp.1-24.
Floyd, E., Li, N. and Skinner, D.J., 2015. Payout policy through the financial crisis: The
growth of repurchases and the resilience of dividends. Journal of Financial
Economics, 118(2), pp.299-316.
Westpac.com.au. (2017). Westpac - Personal, Business and Corporate Banking. [online]
Available at: https://www.westpac.com.au/ [Accessed 30 Nov. 2017].
1 out of 7
Related Documents

Your All-in-One AI-Powered Toolkit for Academic Success.
+13062052269
info@desklib.com
Available 24*7 on WhatsApp / Email
Unlock your academic potential
© 2024 | Zucol Services PVT LTD | All rights reserved.