Determinants of Leverage and Capital Structure: A Financial Project

Verified

Added on  2022/12/14

|5
|632
|72
Project
AI Summary
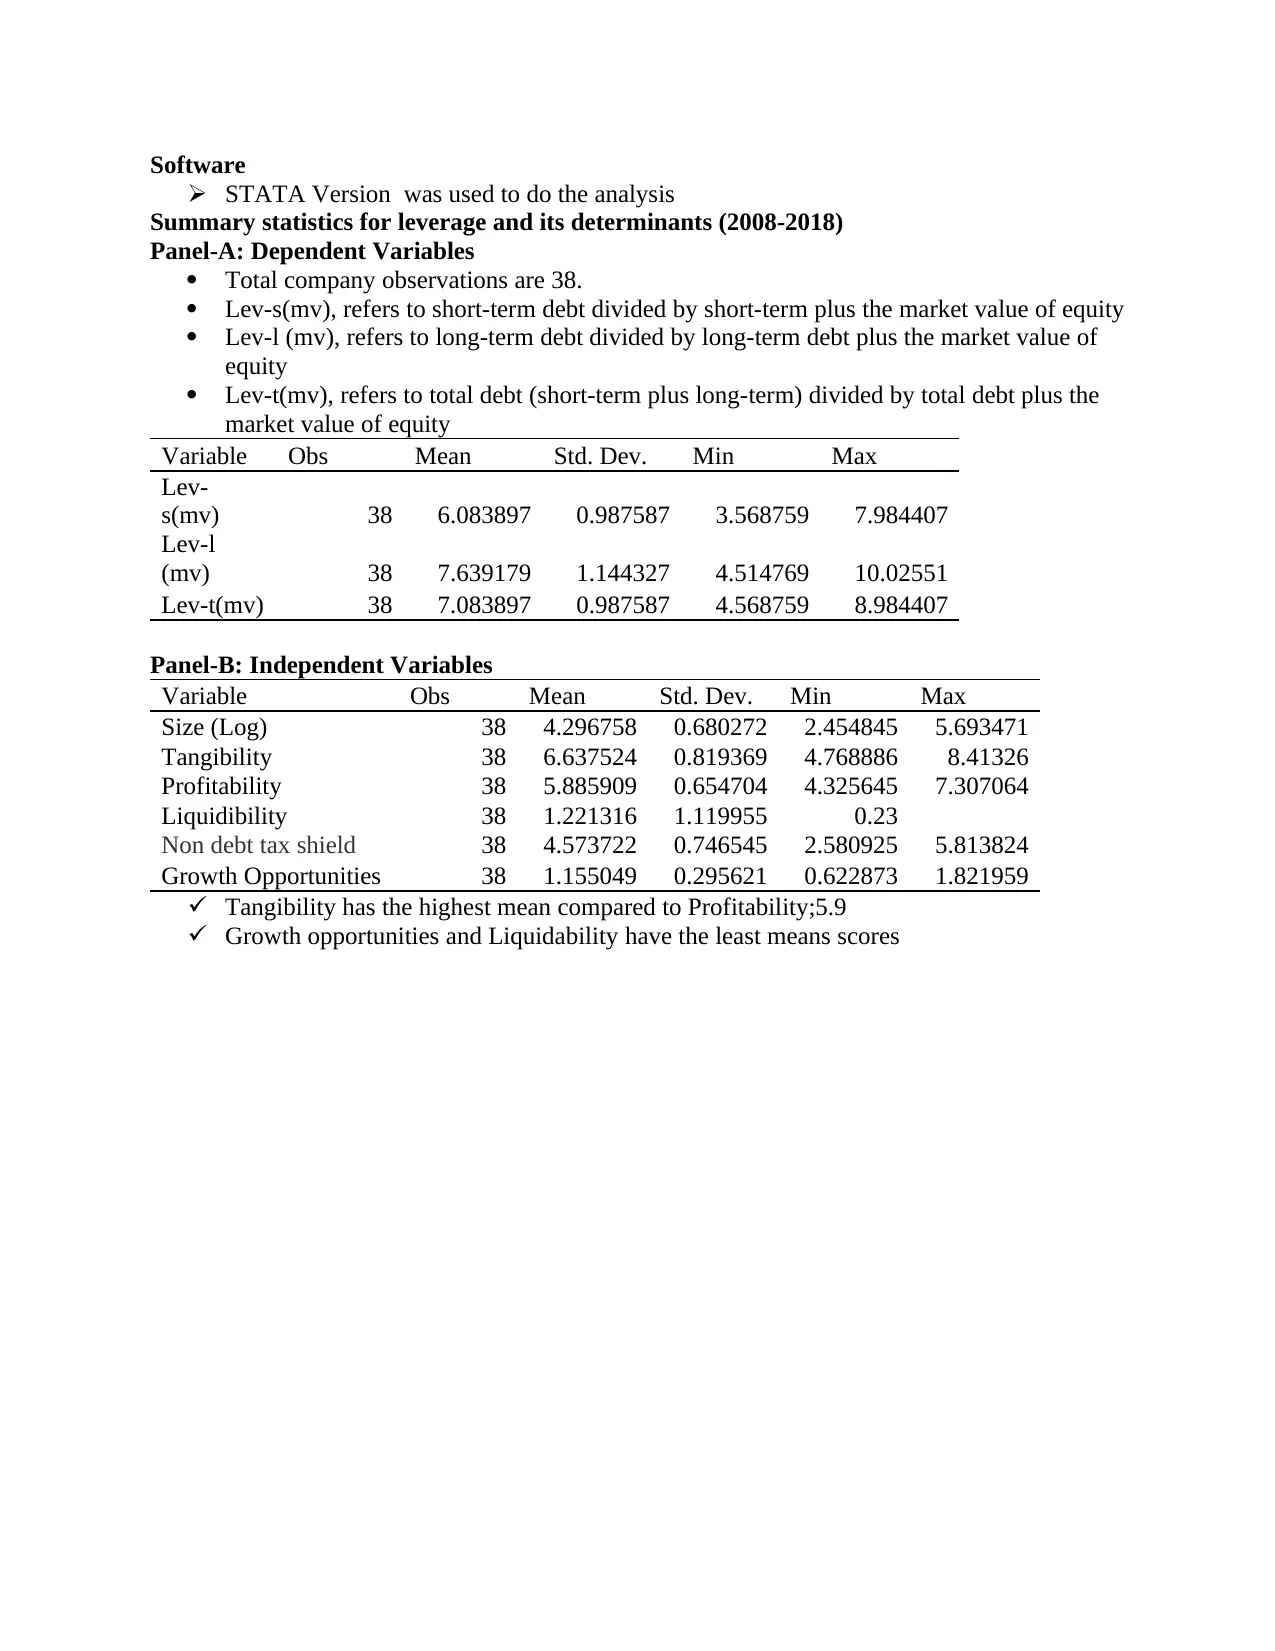
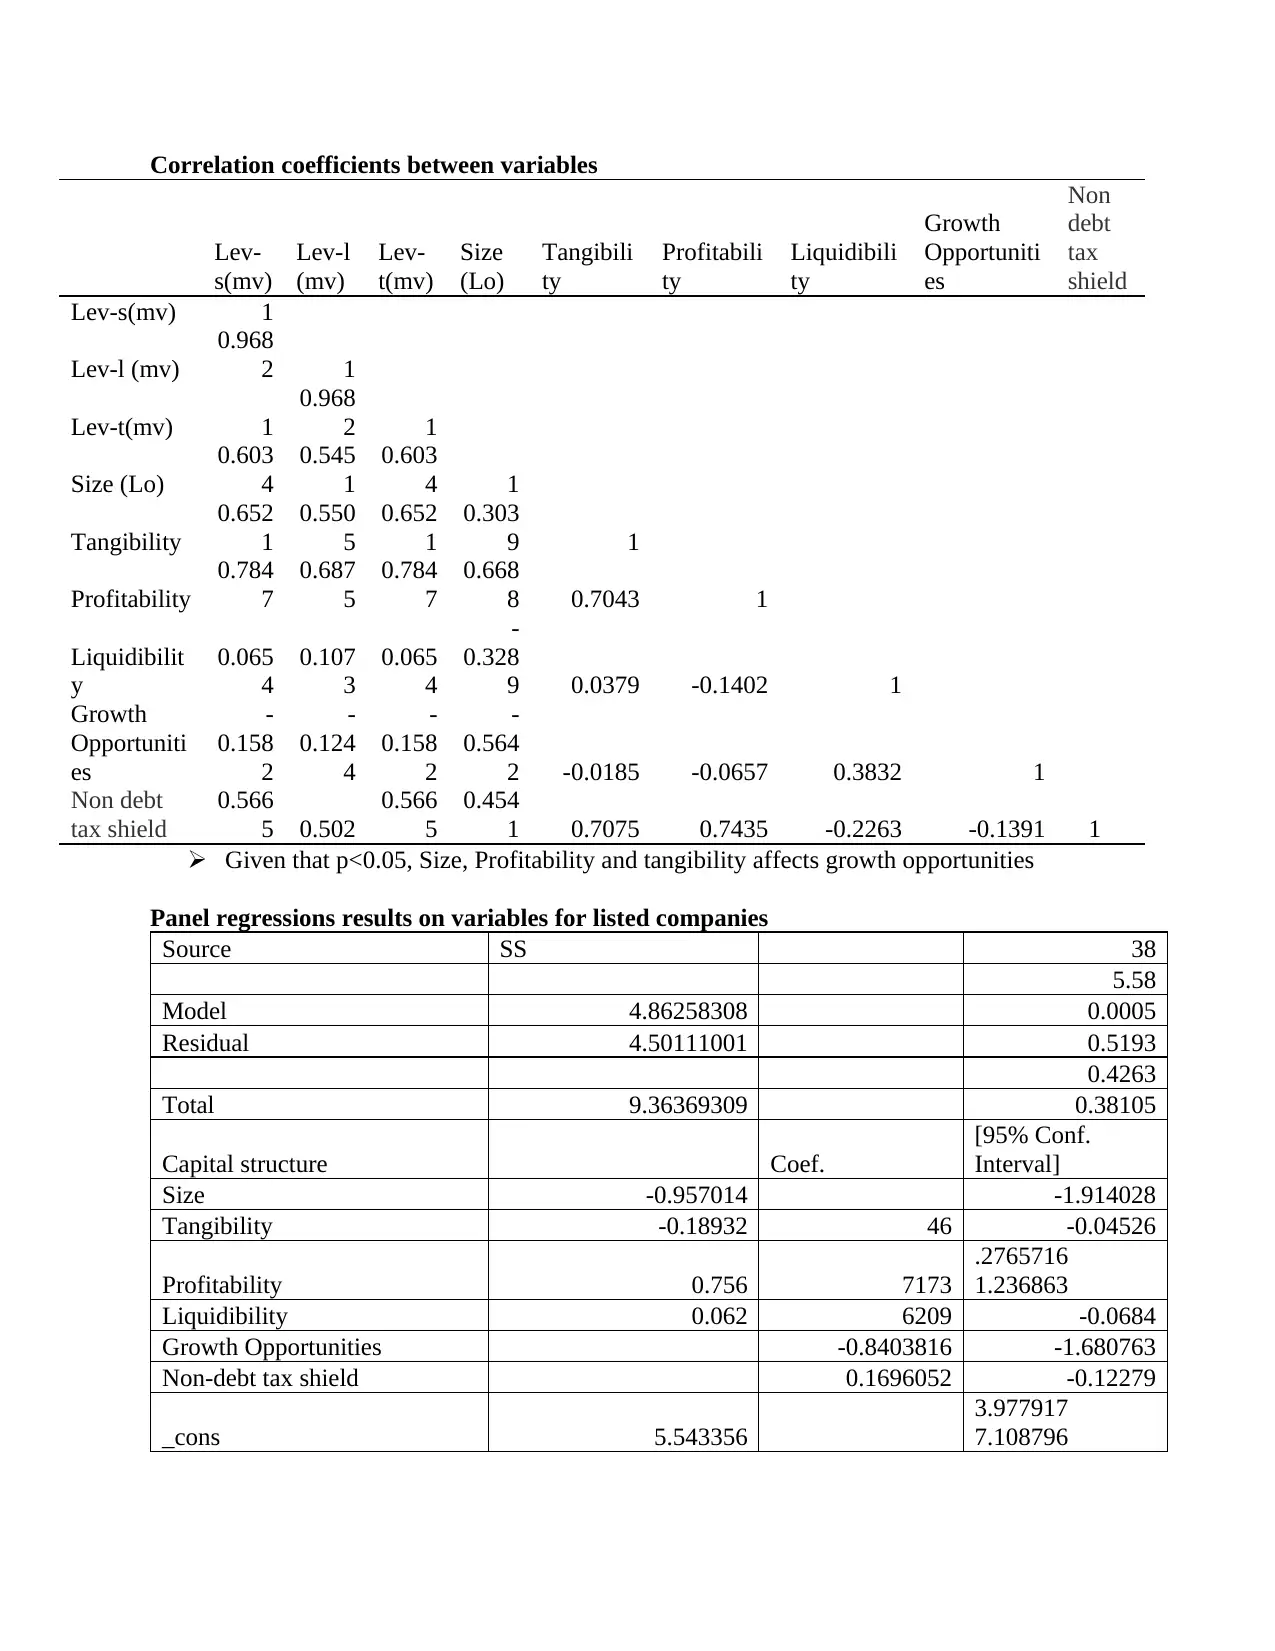
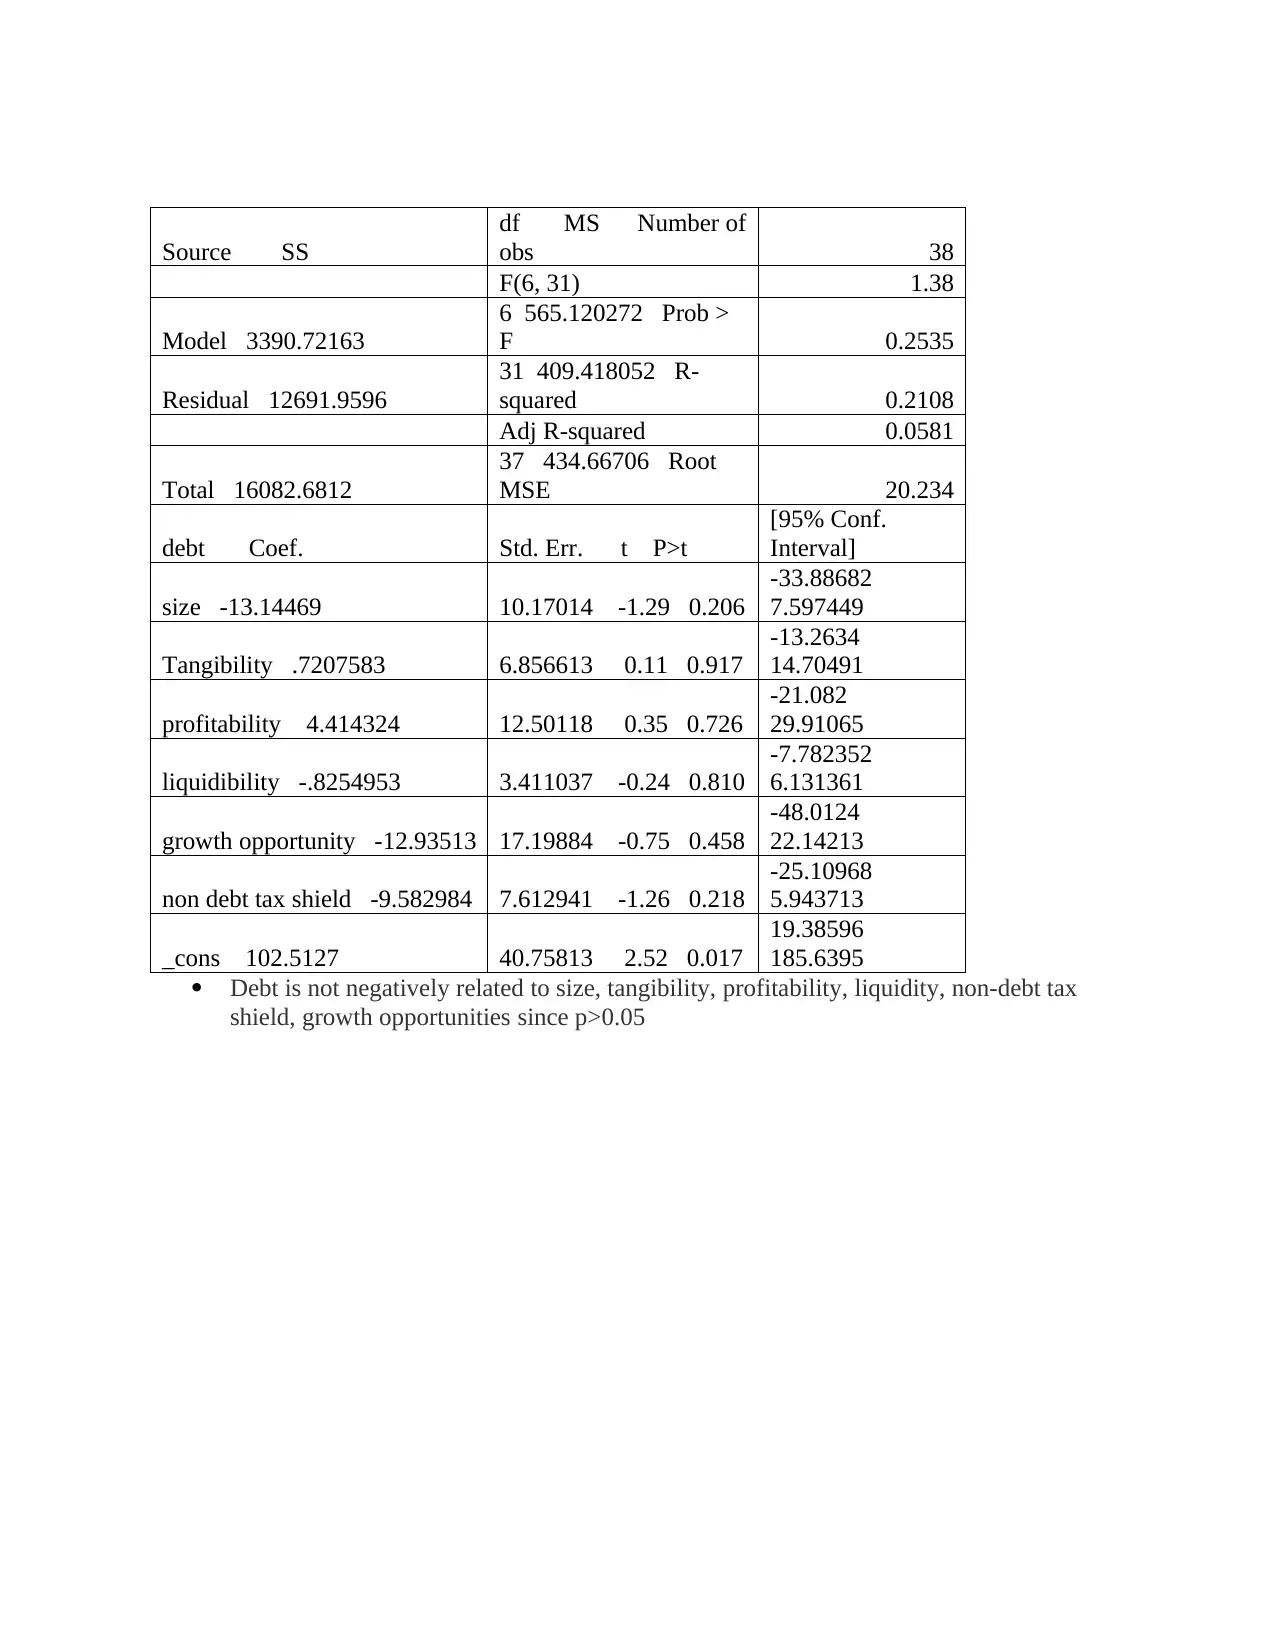
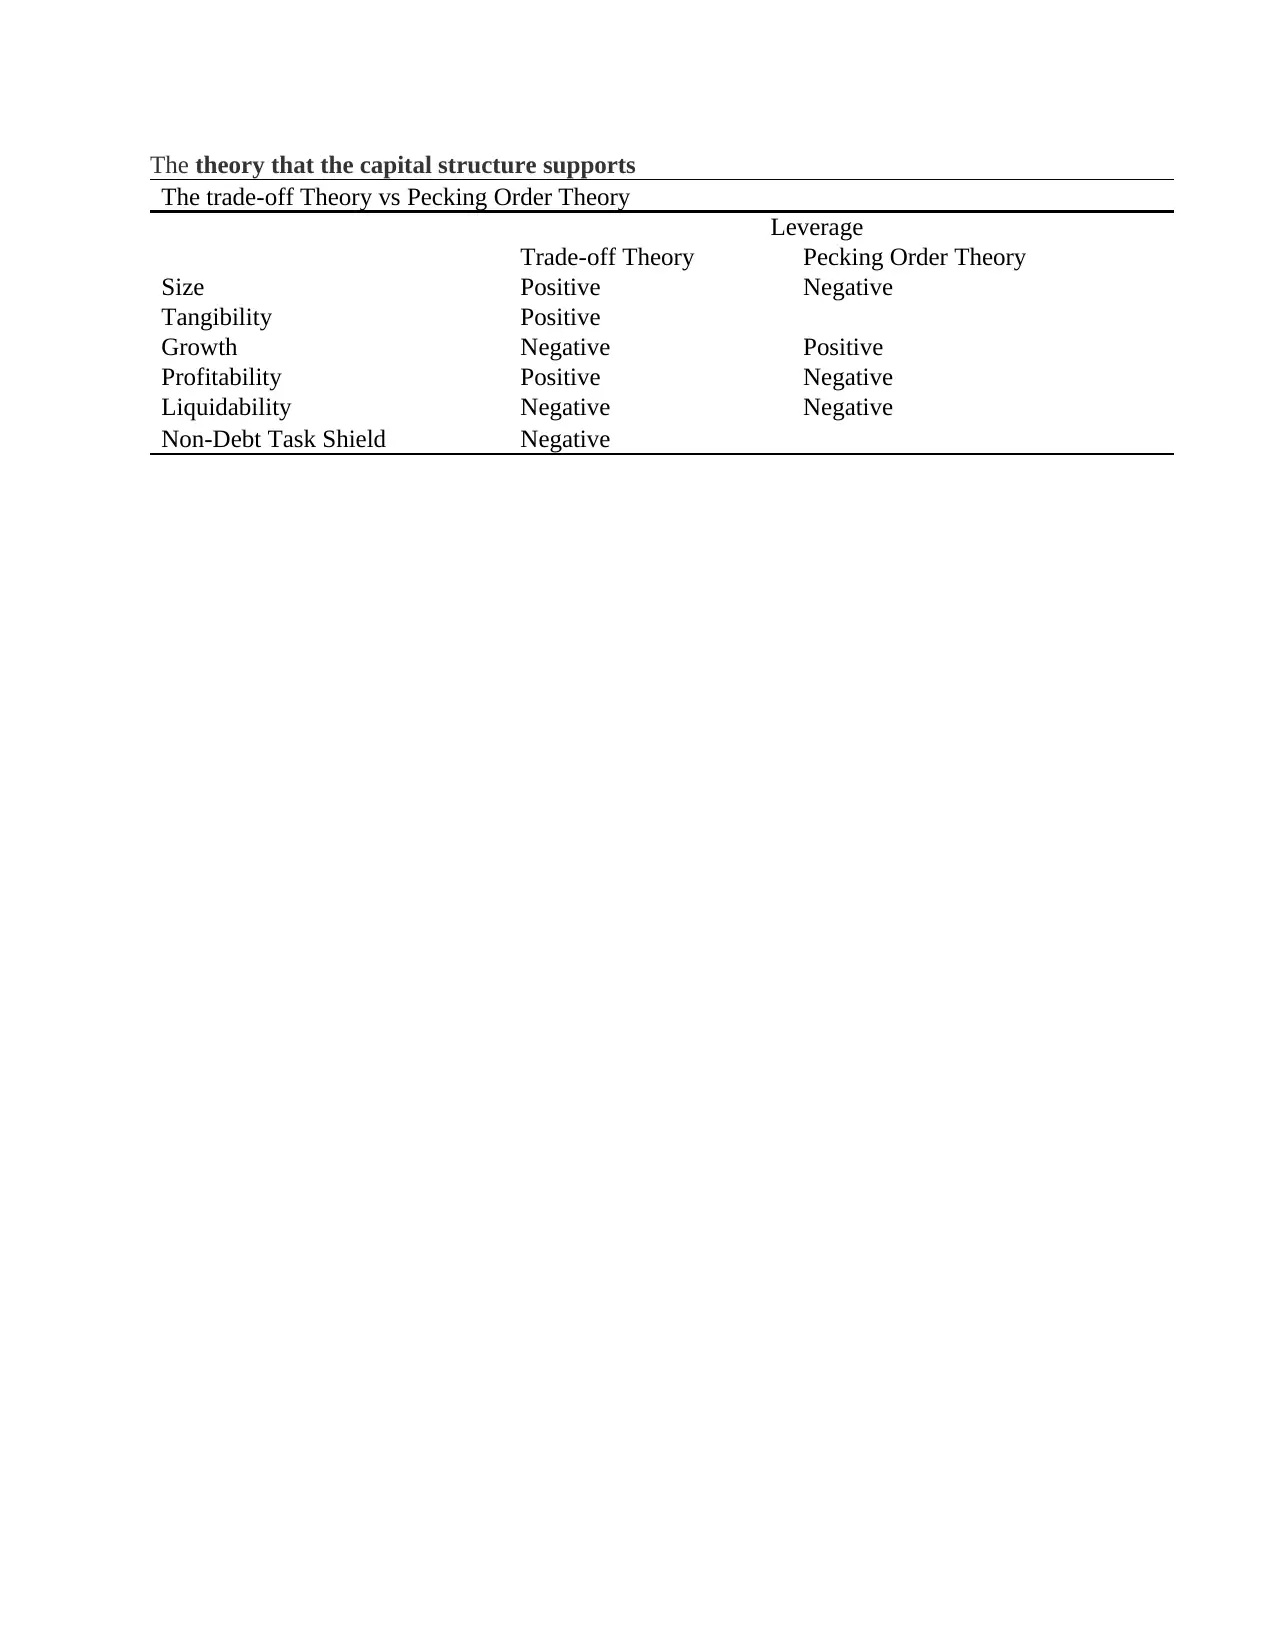
This project analyzes the determinants of leverage and capital structure using STATA. The analysis includes summary statistics for leverage and its determinants, examining short-term, long-term, and total debt relative to market value of equity. Independent variables such as size, tangibility, profitability, liquidity, non-debt tax shield, and growth opportunities are considered. Correlation coefficients and panel regression results are presented to determine the relationships between these variables and leverage. The findings suggest that size and profitability influence growth opportunities. The study tests hypotheses related to the impact of various factors on debt levels, comparing the results with the trade-off theory and pecking order theory. The project utilizes data from 38 companies over a period from 2008-2018, providing insights into the factors that influence capital structure decisions.
Document Page
Software
STATA Version was used to do the analysis
Summary statistics for leverage and its determinants (2008-2018)
Panel-A: Dependent Variables
Total company observations are 38.
Lev-s(mv), refers to short-term debt divided by short-term plus the market value of equity
Lev-l (mv), refers to long-term debt divided by long-term debt plus the market value of
equity
Lev-t(mv), refers to total debt (short-term plus long-term) divided by total debt plus the
market value of equity
Variable Obs Mean Std. Dev. Min Max
Lev-
s(mv) 38 6.083897 0.987587 3.568759 7.984407
Lev-l
(mv) 38 7.639179 1.144327 4.514769 10.02551
Lev-t(mv) 38 7.083897 0.987587 4.568759 8.984407
Panel-B: Independent Variables
Variable Obs Mean Std. Dev. Min Max
Size (Log) 38 4.296758 0.680272 2.454845 5.693471
Tangibility 38 6.637524 0.819369 4.768886 8.41326
Profitability 38 5.885909 0.654704 4.325645 7.307064
Liquidibility 38 1.221316 1.119955 0.23
Non debt tax shield 38 4.573722 0.746545 2.580925 5.813824
Growth Opportunities 38 1.155049 0.295621 0.622873 1.821959
Tangibility has the highest mean compared to Profitability;5.9
Growth opportunities and Liquidability have the least means scores
tabler-icon-diamond-filled.svg

Paraphrase This Document

Need a fresh take? Get an instant paraphrase of this document with our AI Paraphraser
Document Page
Correlation coefficients between variables
Lev-
s(mv)
Lev-l
(mv)
Lev-
t(mv)
Size
(Lo)
Tangibili
ty
Profitabili
ty
Liquidibili
ty
Growth
Opportuniti
es
Non
debt
tax
shield
Lev-s(mv) 1
Lev-l (mv)
0.968
2 1
Lev-t(mv) 1
0.968
2 1
Size (Lo)
0.603
4
0.545
1
0.603
4 1
Tangibility
0.652
1
0.550
5
0.652
1
0.303
9 1
Profitability
0.784
7
0.687
5
0.784
7
0.668
8 0.7043 1
Liquidibilit
y
0.065
4
0.107
3
0.065
4
-
0.328
9 0.0379 -0.1402 1
Growth
Opportuniti
es
-
0.158
2
-
0.124
4
-
0.158
2
-
0.564
2 -0.0185 -0.0657 0.3832 1
Non debt
tax shield
0.566
5 0.502
0.566
5
0.454
1 0.7075 0.7435 -0.2263 -0.1391 1
Given that p<0.05, Size, Profitability and tangibility affects growth opportunities
Panel regressions results on variables for listed companies
Source SS 38
5.58
Model 4.86258308 0.0005
Residual 4.50111001 0.5193
0.4263
Total 9.36369309 0.38105
Capital structure Coef.
[95% Conf.
Interval]
Size -0.957014 -1.914028
Tangibility -0.18932 46 -0.04526
Profitability 0.756 7173
.2765716
1.236863
Liquidibility 0.062 6209 -0.0684
Growth Opportunities -0.8403816 -1.680763
Non-debt tax shield 0.1696052 -0.12279
_cons 5.543356
3.977917
7.108796
Document Page
Only Size and Profitability affects growth opportunities in the panel regression now that
p<0.05
The hypothesis is that debt is negatively related to size, tangibility, profitability,
liquidity, non-debt tax shield, growth opportunities are not true
Document Page
Source SS
df MS Number of
obs 38
F(6, 31) 1.38
Model 3390.72163
6 565.120272 Prob >
F 0.2535
Residual 12691.9596
31 409.418052 R-
squared 0.2108
Adj R-squared 0.0581
Total 16082.6812
37 434.66706 Root
MSE 20.234
debt Coef. Std. Err. t P>t
[95% Conf.
Interval]
size -13.14469 10.17014 -1.29 0.206
-33.88682
7.597449
Tangibility .7207583 6.856613 0.11 0.917
-13.2634
14.70491
profitability 4.414324 12.50118 0.35 0.726
-21.082
29.91065
liquidibility -.8254953 3.411037 -0.24 0.810
-7.782352
6.131361
growth opportunity -12.93513 17.19884 -0.75 0.458
-48.0124
22.14213
non debt tax shield -9.582984 7.612941 -1.26 0.218
-25.10968
5.943713
_cons 102.5127 40.75813 2.52 0.017
19.38596
185.6395
Debt is not negatively related to size, tangibility, profitability, liquidity, non-debt tax
shield, growth opportunities since p>0.05
tabler-icon-diamond-filled.svg

Paraphrase This Document

Need a fresh take? Get an instant paraphrase of this document with our AI Paraphraser
Document Page
The theory that the capital structure supports
The trade-off Theory vs Pecking Order Theory
Leverage
Trade-off Theory Pecking Order Theory
Size Positive Negative
Tangibility Positive
Growth Negative Positive
Profitability Positive Negative
Liquidability Negative Negative
Non-Debt Task Shield Negative
chevron_up_icon
1 out of 5
circle_padding
hide_on_mobile
zoom_out_icon
[object Object]