Analysis of Capital Structure for Retail Firms in Saudi Arabia
VerifiedAdded on 2023/06/10
|35
|8868
|145
Report
AI Summary
This report provides an analysis of capital structure, focusing on its importance, associated risks, and the cost of capital for publicly-traded companies, particularly within the Saudi Arabian retail industry. It explores the concept of capital structure, defining it as the way an organization finances its assets through a mix of debt and equity. The report reviews literature suggesting the impact of capital structure on profitability, the different types of capital available, and the pursuit of an optimal capital structure that balances risk and cost. It also examines the risks associated with different capital structures, advantages and disadvantages of capital financing, and the overall cost risks involved. The study analyzes the capital structures of four Saudi Arabian retail companies, highlighting the variations driven by internal, external, and industry-specific factors. The ultimate goal is to provide insights into achieving an optimal balance between debt and equity to enhance a company's financial position.
Running Head: Capital structure
1
Capital Structure
Al Yamamah University
Supervised By: Mario Reyes
Submitted By:
Mahammad K. Al Rashed 201611067
Abdulaziz A. Raey 201611177
Khalid H. Al Shammeri 201611176
Abdullah E. Al Dhafyan 201611202
June 2018
1
Capital Structure
Al Yamamah University
Supervised By: Mario Reyes
Submitted By:
Mahammad K. Al Rashed 201611067
Abdulaziz A. Raey 201611177
Khalid H. Al Shammeri 201611176
Abdullah E. Al Dhafyan 201611202
June 2018
Paraphrase This Document
Need a fresh take? Get an instant paraphrase of this document with our AI Paraphraser

Running Head: Capital structure
2
Executive summary:
In this research paper, we focus on the analysing the cost of capital of publicly-traded
companies. We review the literature on capital structure, its importance, the risk associated
with different capital structure and the total cost of capital of an organization. The report
explains that the main concept of the capital structure is to identify that how an organization
finances its assets through the equity and debt. We also studied in the report that the capital
structure concept and the importance of the capital structure is higher and it impacts on the
overall capital structure of the organization at huge level.
Or brief synthesis of the literature, we review the concept of the capital structure,
different types of capital, the concept of an optimal level of the capital. The capital structure
level of the company adds that the main aim of the financial managers and the organization to
set a proper link among the debt and equity to enhance the overall position of the company.
We have studied on the four companies of retail industry of Saudi Arabia. We find
that the capital structure of each organization is different which is derived from the various
internal and external sources and the factors of the company and the industry.
Running Head: Capital structure
3
Contents
Introduction:.....................................................................................................................4
Objective of the research project:.....................................................................................4
Importance of the research project:..................................................................................4
Research project methodology and hypothesis:...............................................................5
Literature review:..............................................................................................................6
Introduction...................................................................................................................6
The concept of capital structure....................................................................................6
Explanation of the four commonly types of fund, the interest paid and the associated
cost for each...........................................................................................................................7
The various risks involved in the different capital structure and its aversion..............8
The advantages and disadvantages of capital financing...............................................9
The total cost risks involved in the different capital structure:..................................11
Capital structure analysis:...............................................................................................13
Conclusion, implementation and recommendation:.......................................................15
References:.....................................................................................................................17
Appendix.........................................................................................................................20
⊘ This is a preview!⊘
Do you want full access?
Subscribe today to unlock all pages.
Trusted by 1+ million students worldwide
Running Head: Capital structure
4
Introduction:
The report has been prepared to evaluate the capital structure of an organization.
Various methods and the techniques of an organization have been evaluated to measure the
capital budgeting importance and the implementation process of the company. The capital
structure of an organization depends on the various internal factors, industry factors and the
economical factors of the business. The optimal capital structure of the company has been
measured to identify the overall performance.
Objective of the research project:
The main objectives of the capital structure research paper are as follows:
To determine the concept of capital structure
To evaluate the optimal capital structure
To measure the impact of optimal capital structure in an organization
To forecast the impact of capital structure basis
To appraise the impact of worst proportion of capital on the overall operations of the
company.
Importance of the research project:
The research proposal of capital structure has been conducted to make it easier to
understand the main reasons behind the optimal capital structure of an organization. The
optimal capital structure is a combination of debts and the equity of the business which
effectively balances the risk and cost of the company. The optimal capital structure is the mix
of debt and equity of the company which is set in such a proportion that the associated risk
with the capital and the cost of the company could be reduced.
Paraphrase This Document
Need a fresh take? Get an instant paraphrase of this document with our AI Paraphraser
Running Head: Capital structure
5
The main objective of the research proposal is to identify the optimal capital structure
level of an organization and enhance the debt % in a point where the benefit from the next
dollar of debt financing becomes equal to the bankruptcy rate of the company. Any
percentage of debt amount directly impacts on the associated risk of the company positively.
The research proposal makes it simpler for the financial managers and the management of the
business to evaluate the optimal level of the capital.
Research project methodology:
The research questions of this report are as follows:
What are the types of capital?
Why the optimal capital structure level is so significant for the company?
What are the important consequences of capital structure in an organization?
How the management and the financial department of an organization affect the
capital structure of an organization?
Further, for conducting the study, quantitative and qualitative data has been collected to
measure the overall result and a better conclusion. The literature review has been done on
newspaper, journal, articles, books etc. to identify the meaning and the performance of capital
structure in an organization. The data of Saudi Arabia has been calculated to identify the
optimal structure of the companies in the country. The secondary study has been done in the
report.
Literature review:
Introduction:
The main concept of the capital structure is to identify how an organization finances
its assets through the equity and the debt combination. Capital structure plays a crucial role in
an organization as well as it affects the profitability of an organization at great level. Some of
the researcher has explained that capital structure and the profitability level of an
Running Head: Capital structure
6
organization has the positive relations. On the other hand, the Zimmerman and Yahya-Zadeh,
(2011) has argued that the capital structure is not linked with the profitability level of an
organization. We have studied in the report that the capital structure concept and the
importance of the capital structure are huge and it impacts on the overall capital structure of
the organization.
In the part of the literature review, concept of the capital structure, different types of
capital, optimal level of the capital etc has been studied and a report has been prepared on the
basis of that. The capital structure level of the company adds that the main aim of the
financial managers and the organization to set a proper link among the debt and equity to
enhance the overall position of the company.
The concept of capital structure
Capital structure deals with the amount of the equity or debts that is used by the firm to
fund for its operations and to finance its assets. This is generally expressed as the debt to
equity or debt capital ratio. The capital structure of debt and equity are utilized in the
business for acquisitions, expenditures and to make other investments. The objective of the
manager of the firm is to balance between the two capital structure by deciding whether to
raise equity or debt in order to obtain the optimum structure of capital (Zabarankin, Pavlikov
& Uryasev, 2014).
The main study is to examine the impact of the capital structure and the contact of the
capital structure on the profitability level of the company. The capital structure level of an
organization explains that the debt and equity must be raised by the company in such a ratio
that the overall position of the company could be better as well as the overall position of the
company could also be improved. The main intend of the report is to evaluate the optimal
capital structure point of an organization.
The optimal capital structure is a group of debts and the equity of the company which
manages the risk and cost of the company in better way (Weston and Brigham, 2015). The
optimal capital structure is the mix of debt and equity of the company which is set in such a
proportion that the associated risk with the capital and the cost of the company could be
reduced.
⊘ This is a preview!⊘
Do you want full access?
Subscribe today to unlock all pages.
Trusted by 1+ million students worldwide
Running Head: Capital structure
7
Explanation of the four commonly types of fund, the interest paid and the
associated cost for each
Mainly, the capital of an organization includes the debt and the equity of an
organization. Equity financing helps an organization to improve the capital without changing
the liability of the company whereas the debt amount raises the liability of the company as
well. The description of the equity and the debt financing of the company is as follows:
Equity Financing
Equity financing assists to enhance the funds by issuing the shares of equity, preference
stocks, on securities exchanges. A person who is holding the share is also known as the
stockholder who receives standard payments of dividend and generates profits when there is a
rise in the share. Equity financing basically explains about the ownership of the shareholder
in the organization (Ward, 2012). The increment in the equity position of an organization
enhances the cost of equity position and the overall cost position of the company (Gapenski,
2008).
Debt Financing
In the case of program of debt financing, the firm issues a convertible bond or regular
bonds in the financial markets. The bonds buyer, who is known as a bondholder, gets interest
payments on a periodic during the bond term. The principal amount is refunded at maturity.
Debt financing basically explains about the raiding the capital amount to manage the capital
expenditure through issuing the bonds in the market (Weaver, Weston and Weaver, 2001).
The increment in the debt position of an organization enhances the cost of debt position and
the overall cost position of the company. The debt interest amount is paid by the company on
the principal amount of the company (Schlichting, 2013).
The various risks involved in the different capital structure and its aversion
Further Ross et al, (2018) has added into his study that there are various risks which
are associated in the capital structure of an organization. Some of them has been studied and
presented below to understand the capital structure and its risk briefly.
The potential financial risk:
Paraphrase This Document
Need a fresh take? Get an instant paraphrase of this document with our AI Paraphraser
Running Head: Capital structure
8
The degree of financial risk could be determined by on the control of capital structure
of the corporate organization. An organization at the time of using the debt in its capital,
needs to pay the fixed charges of interest and the requirement of ability to compensate fixed
interest increases the liquidation risk. The risk related to finance also suggests that the
variability of earnings available to their stakeholders (Reilly & Brown, 2011). The risk that is
related to finance that enhances on account of debt utilize of fixed interest bearing securities
among the total capital. The business that has debt financing does not have any financial risk.
Non employment of debt capital ratio:
In case a business does not use borrowings in its capital structure, the business has to
countenance the risk of non-employment of debt capital. The risk of NEDC has an adverse
relationship with the ratio of debt in its total capital. If there is high leverage or debt-equity
ratio, lower is the NEDC risk and vice-versa (Ross, Westerfield & Jaffe, 2007).
This risk explains that if an organization does not use the debt then they cannot make
the use of financial leverage to improve the earnings per share (EPS). Thus the risk explains
that an organization has to reach at a trade off balance between the risk of non employment
and financial risk of debt capital to improve the market value of the business.
Therefore, the business has a reach a point of balance between the non-employment of
debt capital risk and financial risk to enhance its value in market.In order to achieve the
capital structure that is optimal there has to be determination of the generally total risk and
minimum along with exploit the probable return to accomplish the objective of firm’s higher
market value.
Financial flexibility:
It is essential for an organization to raise the capital and the funds in bad time. It must
be presented in the organization as no surprise that it is easier for the organization to raise the
funds in case if increased revenues and higher profitability. However, no one gives the funds
to the bad growing companies and thus it becomes important for the company to disclose all
the good things and the investment to raise the capital (Radebaugh Gray and Black, 2006).
The increment in the bad debts in such a case enhances the flexibility in the finance.
Tax exposure:
Running Head: Capital structure
9
Debt payment of the company is tax deductible and the equity dividends could not be
deducted from the tax expenses. And thus it becomes important for the company to manage
the tax expenses (Peterson & Fabozzi, 2002). If the company raises the funds through debt
payment than the tax expenses and the risk of the company becomes lower and it
significantly enhances the overall operations of the company.
Business risk:
Business risk is amongst one of the basic risk of the business and its operations. The
greater the business risk of an organization would be, the lower the optimal debt ratio of the
business. Such as, if the overall business risk of an organization would be higher than it
would directly make an impact over the business risk of the company (Phillips and Stawarski,
2016).
Growth rate:
Growth rate of an organization explains about the increment rate in the sales and the
other operations of the company. The growth rate of the company mainly depends on the
capital structure of the company due to the fact that the cost of debt and the cost of equity
affect the profitability position of the company at a huge level (Higgins, 2012). And it also
makes an impact over the total growth of the company (Palicka, 2011).
Market conditions:
Market conditions are also a risk for the capital structure and an organization. The
capital structure level of the company could be changed with the changes into the market
position of the company which lead to the company towards the huge losses or the higher
profits (Elton et al, 2009).
The advantages and disadvantages of capital financing
The advantages are as follows:
Less burden is involved:
With the help of a sound capital financing there is no loan that is to be repaid.
The business does not have to make a loan payment on monthly basis. This also allows
to the company to get relief from the burden of channelling more money for developing
the organisations (Madhura, 2014).
⊘ This is a preview!⊘
Do you want full access?
Subscribe today to unlock all pages.
Trusted by 1+ million students worldwide
Running Head: Capital structure
10
There is no Credit issues:
In case the organisation lack solvency by having a poor credit history and a
lacking financial track record, the equity and the debt can be preferred for financing
(King and Santor, 2008).
To obtain knowledge and gain from partners:
With the help of capital financing, the organisation may form partnership
swith enhanced experienced or knowledgeable individuals. The business may benefit
from the knowledge and the network of the business (Moles, Parrino & Kidwekk,
2011).
The disadvantages of capital are as follows
The Share of profit:
The investors will have to be given their share of profits. However, this is a
trade-off which is worthwhile if the company is benefiting from the value they bring as
financial backers but in case the company does not earn it would be a drawback.
Loss of control:
The price which has to be paid for the capital financing all of its prospective
benefits is that there has been share the control of the business with the stakeholders
(Gropp and Heider, 2010).
Existence of Potential conflict:
The distribution of the ownership along with working with others can result in
conflict along with tension if there exists differences, management style in vision and
techniques of business process (Lord, 2007). It can be an issue that has to be
considered.
Further, it has also been measured that the organization’s capital structure is the main
key which set that what is the growth rate, what is the discount rate and whether the investor
should invest into the company or not. It also decides that whether the company should invest
into the particular project or not (Lumby & Jones, 2007). The measuring of the capital
Paraphrase This Document
Need a fresh take? Get an instant paraphrase of this document with our AI Paraphraser
Running Head: Capital structure
11
structure, the cost of the capital and the total risk involved into the capital structure is
important for the business.
The total cost risks involved in the different capital structure:
Kruth, (2013) explains that the main cost of capital of an organization is the cost of
equity and the cost of debt of the company. The cost of equity and the cost of debt add
together and make the weighted average cost of capital which is overall cost of capital that is
too paid by the corporation to the shareholders of the business. The discussion about the cost
of debt, cost of equity and the WACC of the company are as follows:
Cost of equity:
Cost of equity is the whole cost which is to be paid by the company to its shareholder
against the total equity capital of the organization (Lee & Lee, 2006). The cost of equity of a
business is decided on the basis of the risk free rate (Rf), market return (Rm) and the beta
amount of the company. Cost of equity formula of an organization is as follows:
Risk free rate of return + Premium expected for risk. Cost of equity = Risk free rate of
return + Beta × (market rate of return – risk free rate of return) (Antoniou, Guney and
Paudyal, 2008)
It explains that the cost of equity relates to the total amount of equity and the vaiorus
external and internal factors of the company.
Cost of debt:
Cost of debt is the total cost which is to be paid by the company to its debt holders
and the bond holders against the total equity capital of the organization. The cost of debt of
an organization is decided on the basis of the total interest rate and the tax rate of the
company. Cost of debt formula of an organization is as follows:
Cost of debt = interest rate * (1 – tax rate) (Kinsky, 2011)
It explains that the cost of debt relates to the total amount of debt and the interest rate
and the tax rate of the company (Kaplan and Atkinson, 2015).
Weighted average cost of capital:
Weighted average cost of capital is the total rate which is expected by the company to
pay on the overall resources and the capital which has been generated and enhanced on the
Running Head: Capital structure
12
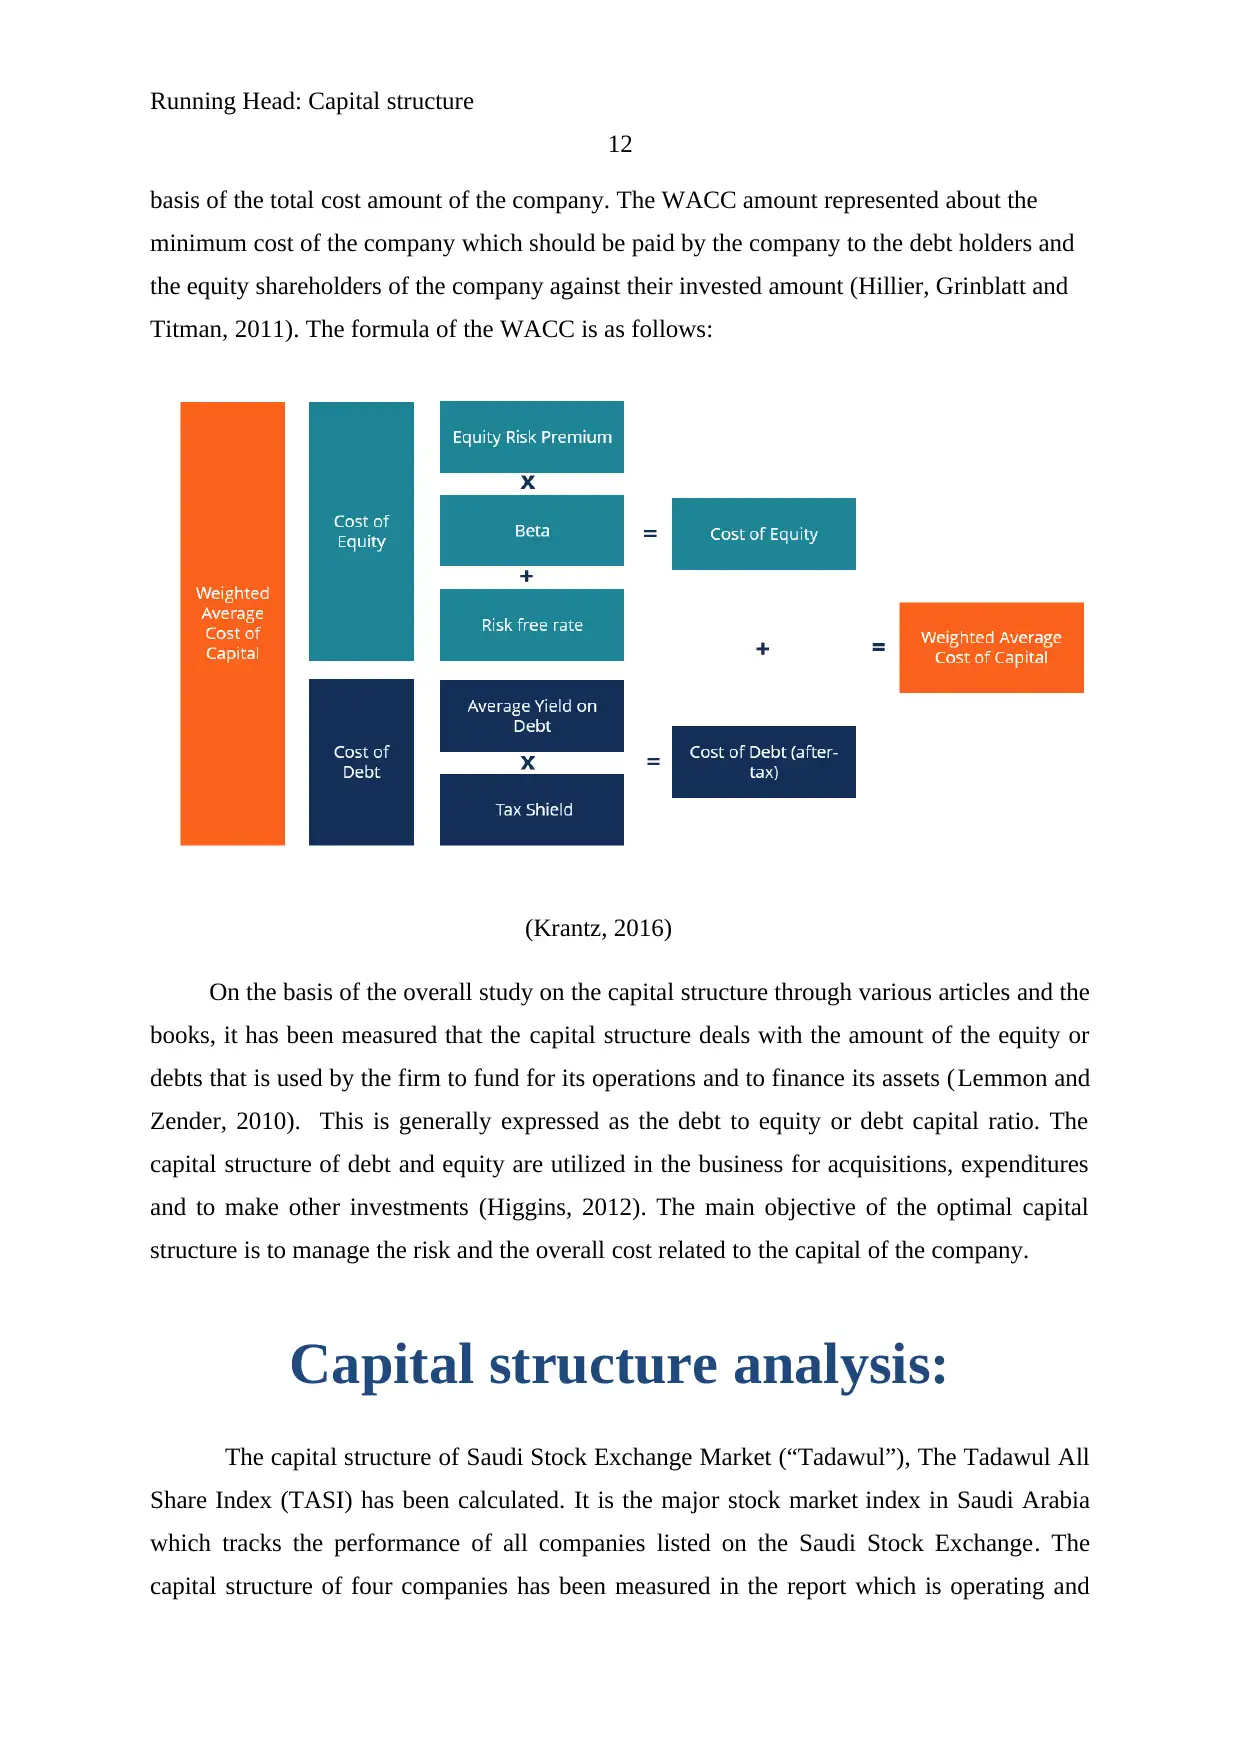
basis of the total cost amount of the company. The WACC amount represented about the
minimum cost of the company which should be paid by the company to the debt holders and
the equity shareholders of the company against their invested amount (Hillier, Grinblatt and
Titman, 2011). The formula of the WACC is as follows:
(Krantz, 2016)
On the basis of the overall study on the capital structure through various articles and the
books, it has been measured that the capital structure deals with the amount of the equity or
debts that is used by the firm to fund for its operations and to finance its assets (Lemmon and
Zender, 2010). This is generally expressed as the debt to equity or debt capital ratio. The
capital structure of debt and equity are utilized in the business for acquisitions, expenditures
and to make other investments (Higgins, 2012). The main objective of the optimal capital
structure is to manage the risk and the overall cost related to the capital of the company.
Capital structure analysis:
The capital structure of Saudi Stock Exchange Market (“Tadawul”), The Tadawul All
Share Index (TASI) has been calculated. It is the major stock market index in Saudi Arabia
which tracks the performance of all companies listed on the Saudi Stock Exchange. The
capital structure of four companies has been measured in the report which is operating and
12
basis of the total cost amount of the company. The WACC amount represented about the
minimum cost of the company which should be paid by the company to the debt holders and
the equity shareholders of the company against their invested amount (Hillier, Grinblatt and
Titman, 2011). The formula of the WACC is as follows:
(Krantz, 2016)
On the basis of the overall study on the capital structure through various articles and the
books, it has been measured that the capital structure deals with the amount of the equity or
debts that is used by the firm to fund for its operations and to finance its assets (Lemmon and
Zender, 2010). This is generally expressed as the debt to equity or debt capital ratio. The
capital structure of debt and equity are utilized in the business for acquisitions, expenditures
and to make other investments (Higgins, 2012). The main objective of the optimal capital
structure is to manage the risk and the overall cost related to the capital of the company.
Capital structure analysis:
The capital structure of Saudi Stock Exchange Market (“Tadawul”), The Tadawul All
Share Index (TASI) has been calculated. It is the major stock market index in Saudi Arabia
which tracks the performance of all companies listed on the Saudi Stock Exchange. The
capital structure of four companies has been measured in the report which is operating and
⊘ This is a preview!⊘
Do you want full access?
Subscribe today to unlock all pages.
Trusted by 1+ million students worldwide
1 out of 35
Related Documents


Your All-in-One AI-Powered Toolkit for Academic Success.
+13062052269
info@desklib.com
Available 24*7 on WhatsApp / Email
![[object Object]](/_next/static/media/star-bottom.7253800d.svg)
Unlock your academic potential
Copyright © 2020–2026 A2Z Services. All Rights Reserved. Developed and managed by ZUCOL.