Case Study: Valuation of Telstra and Wesfarmers for FINA6000 Module
VerifiedAdded on 2023/05/29
|20
|3173
|322
Case Study
AI Summary
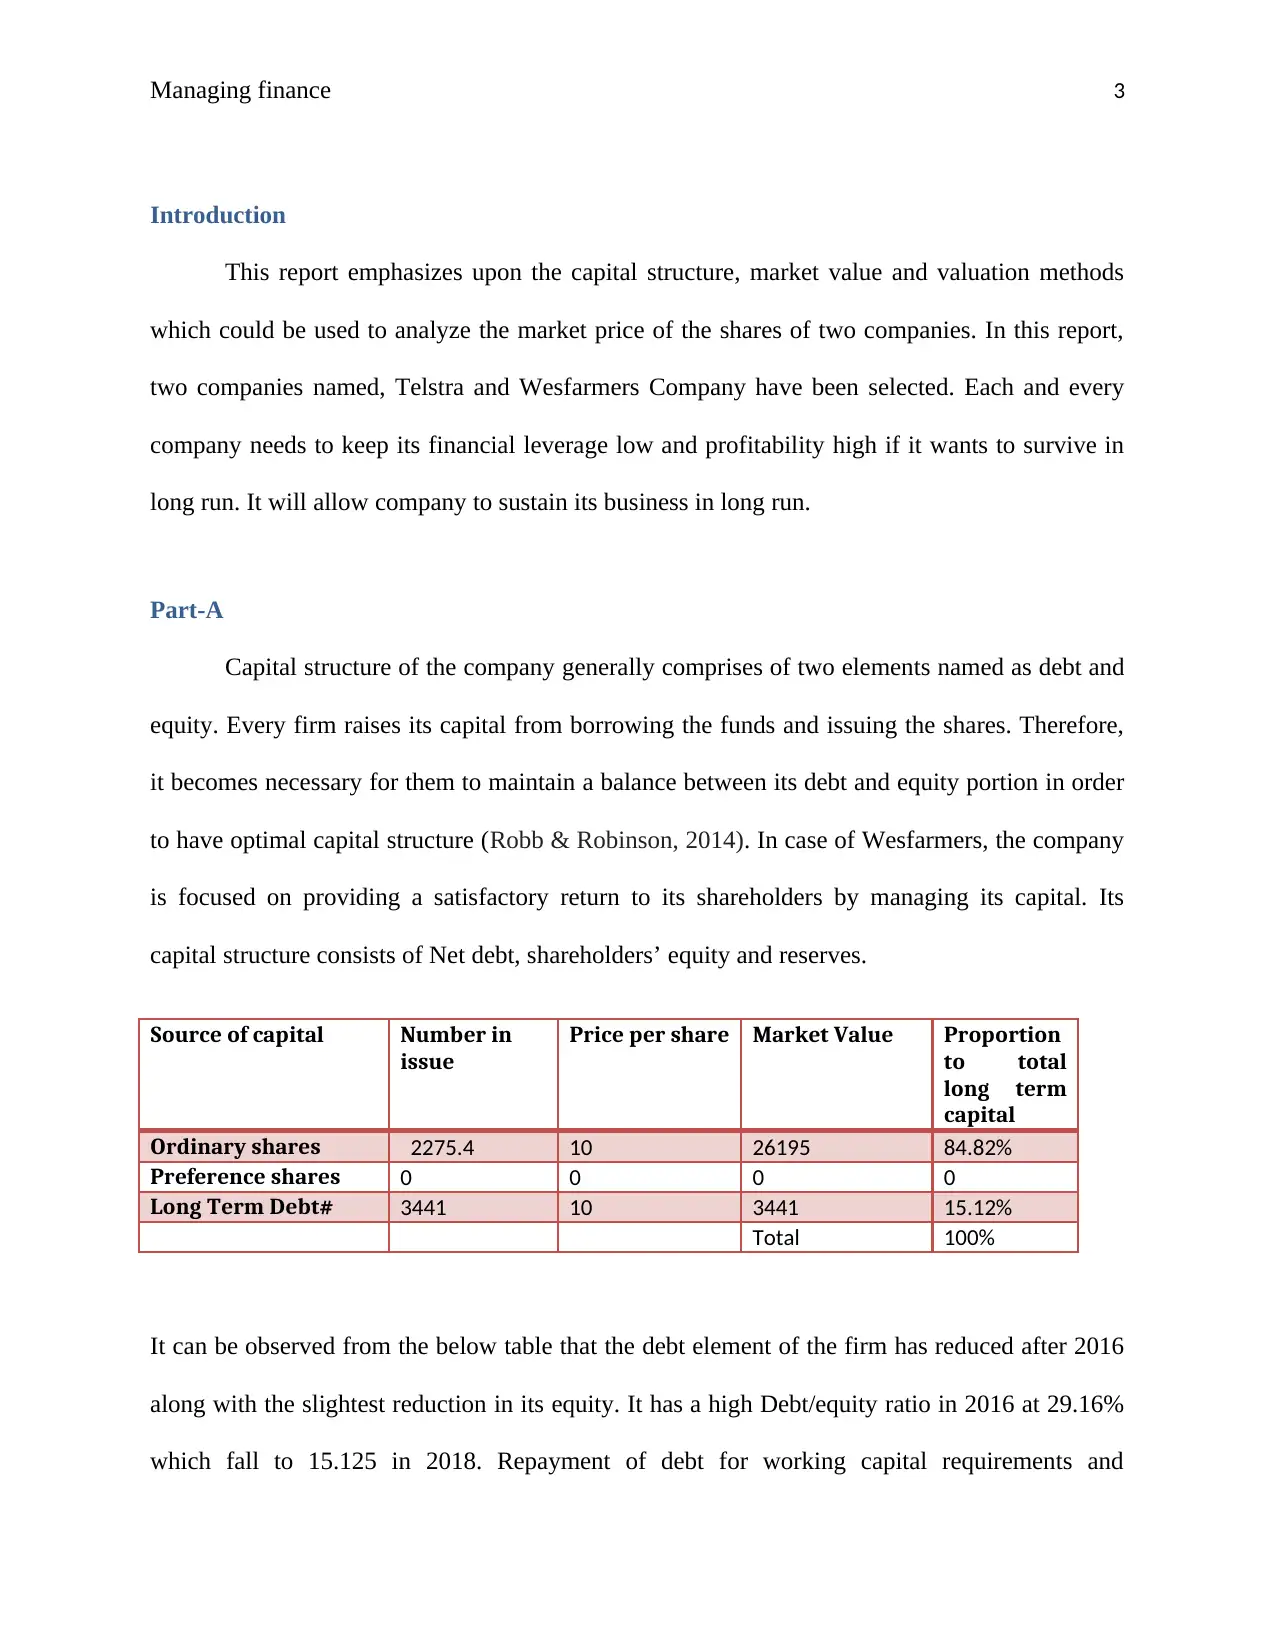
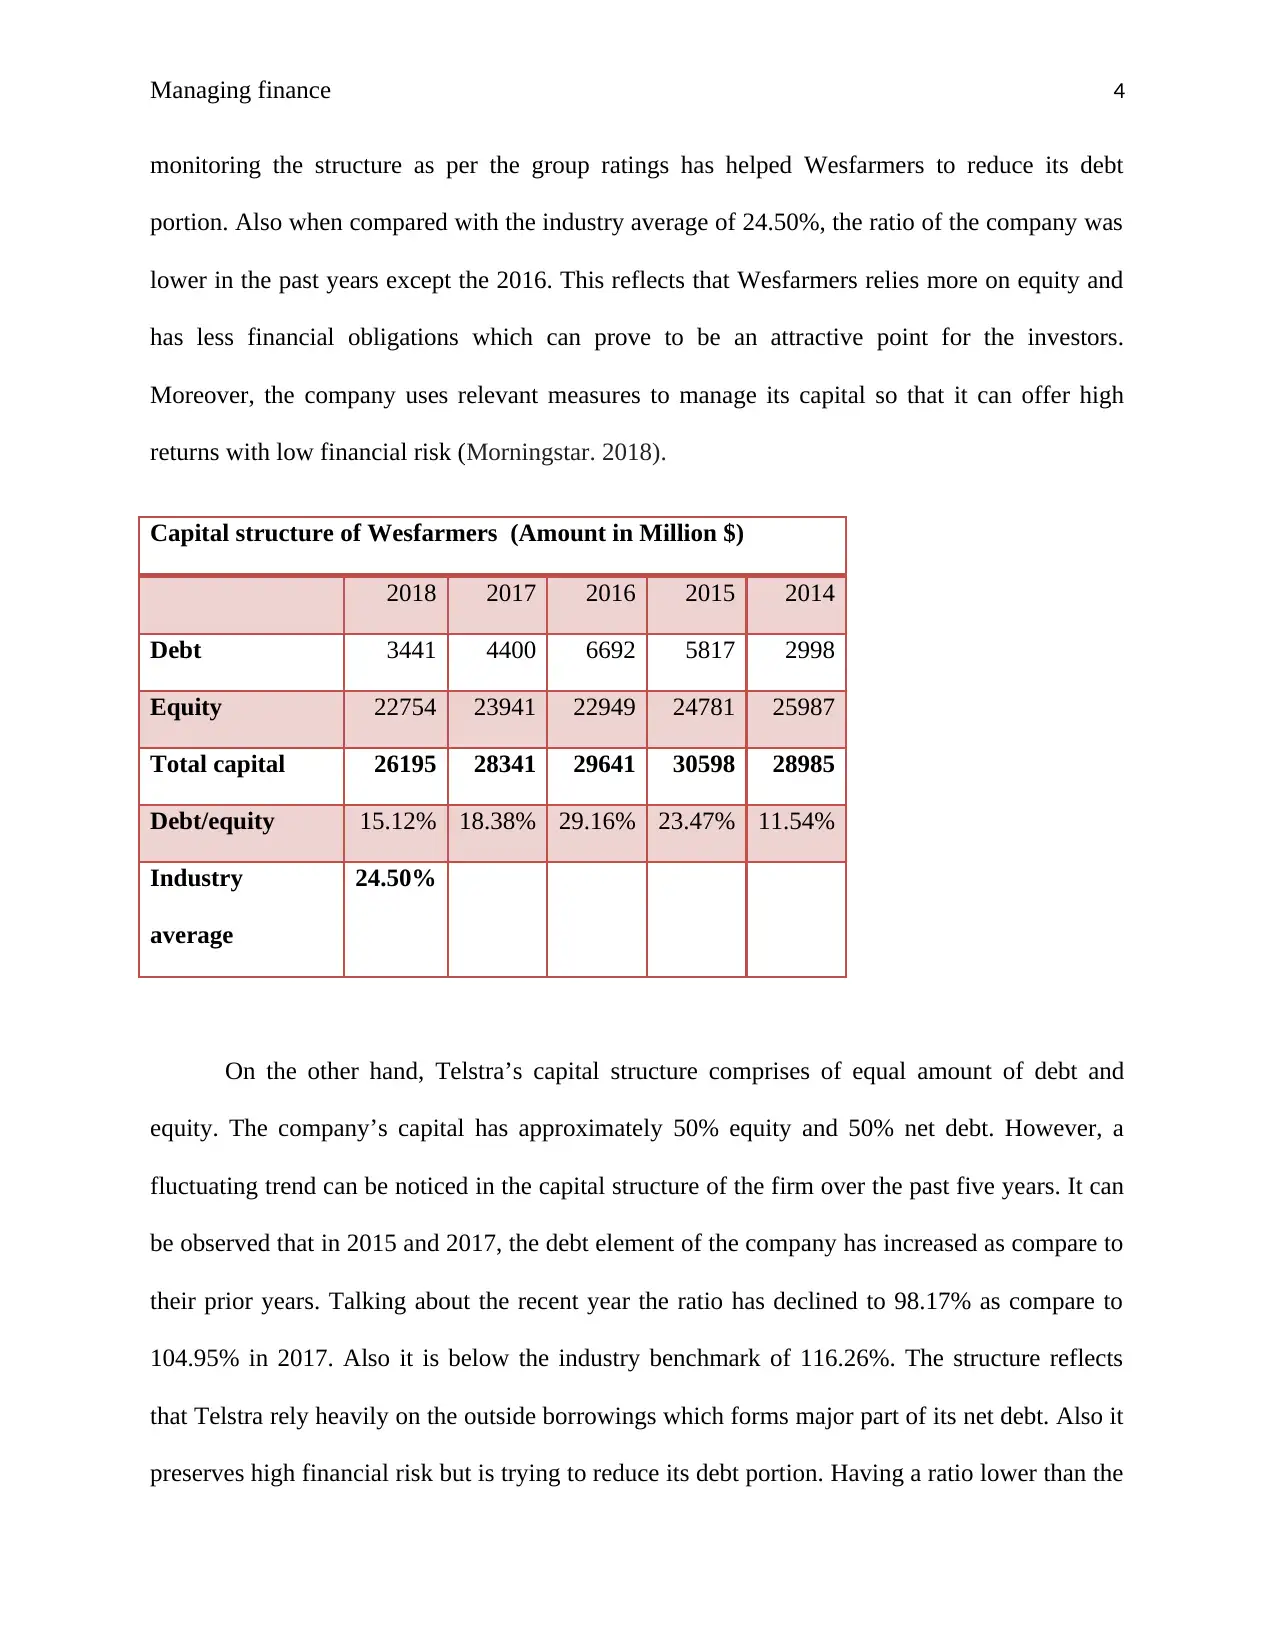
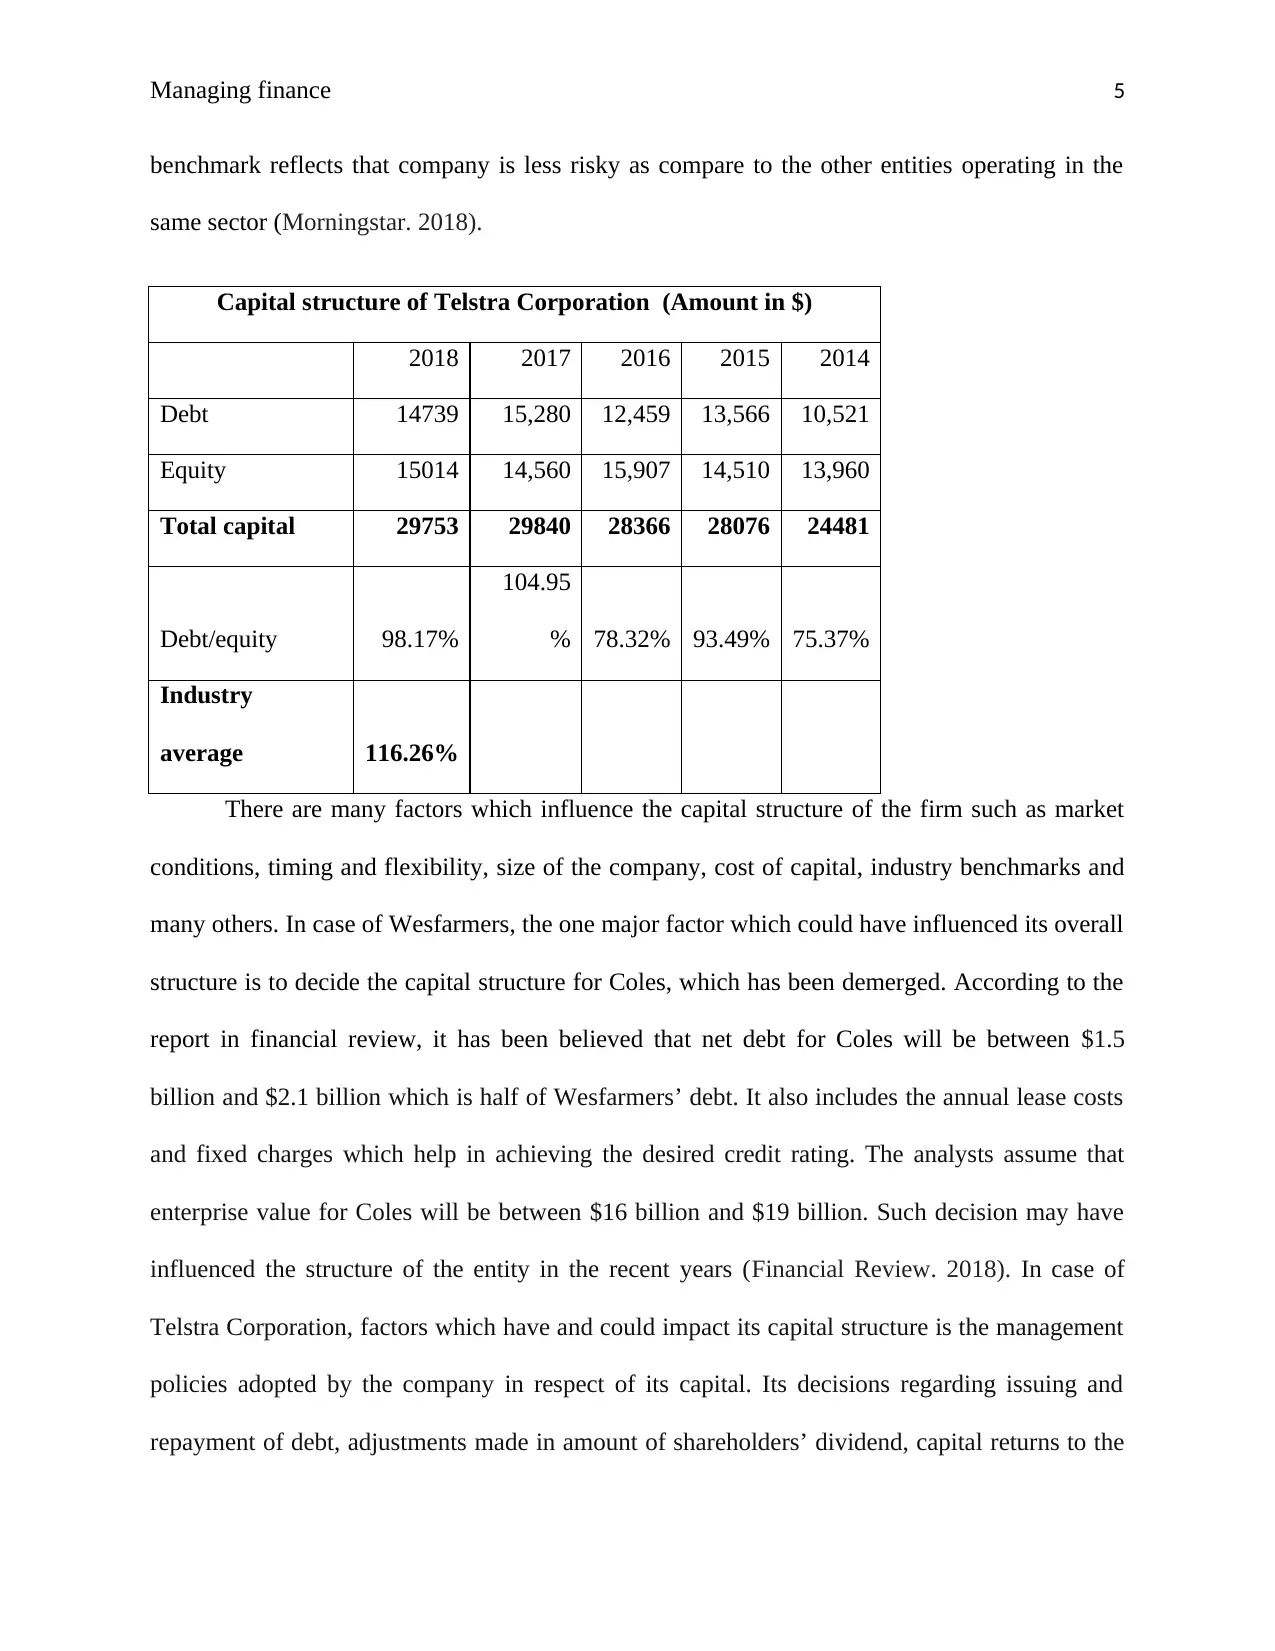
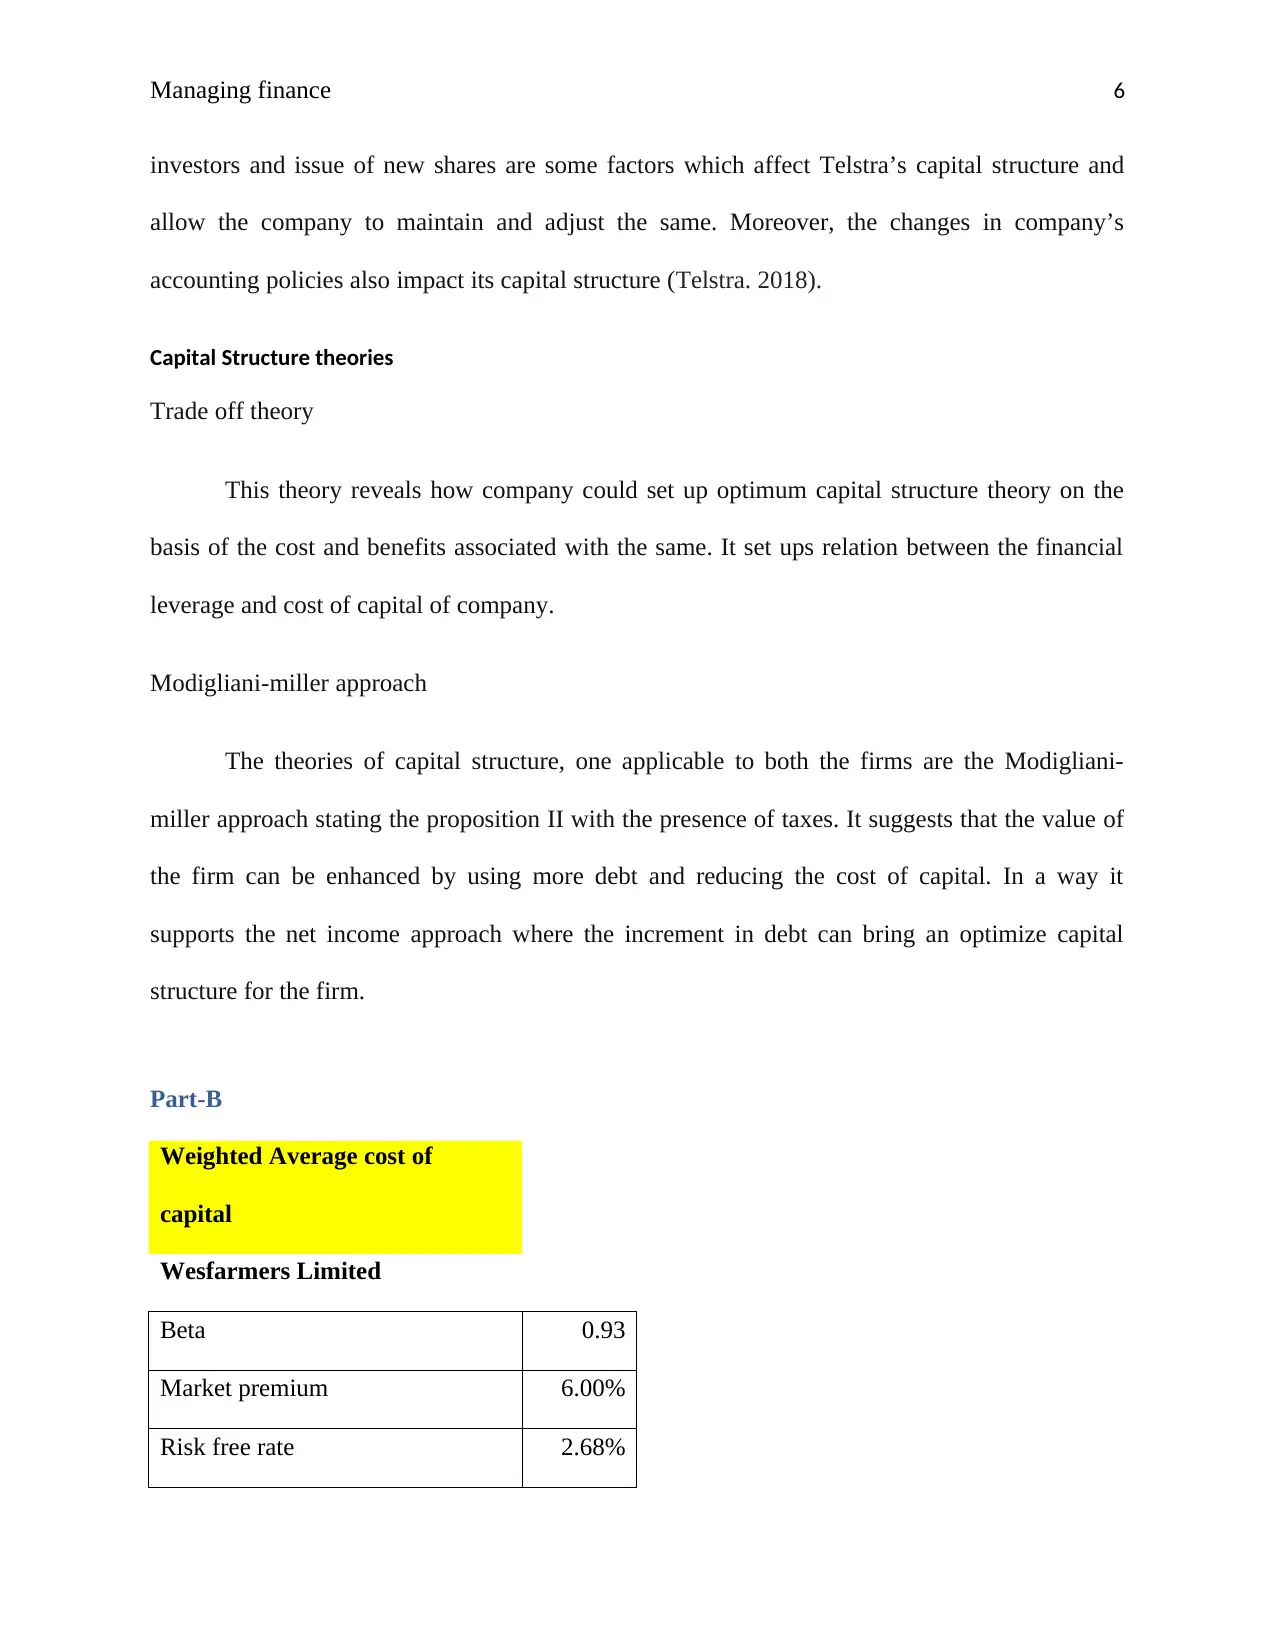
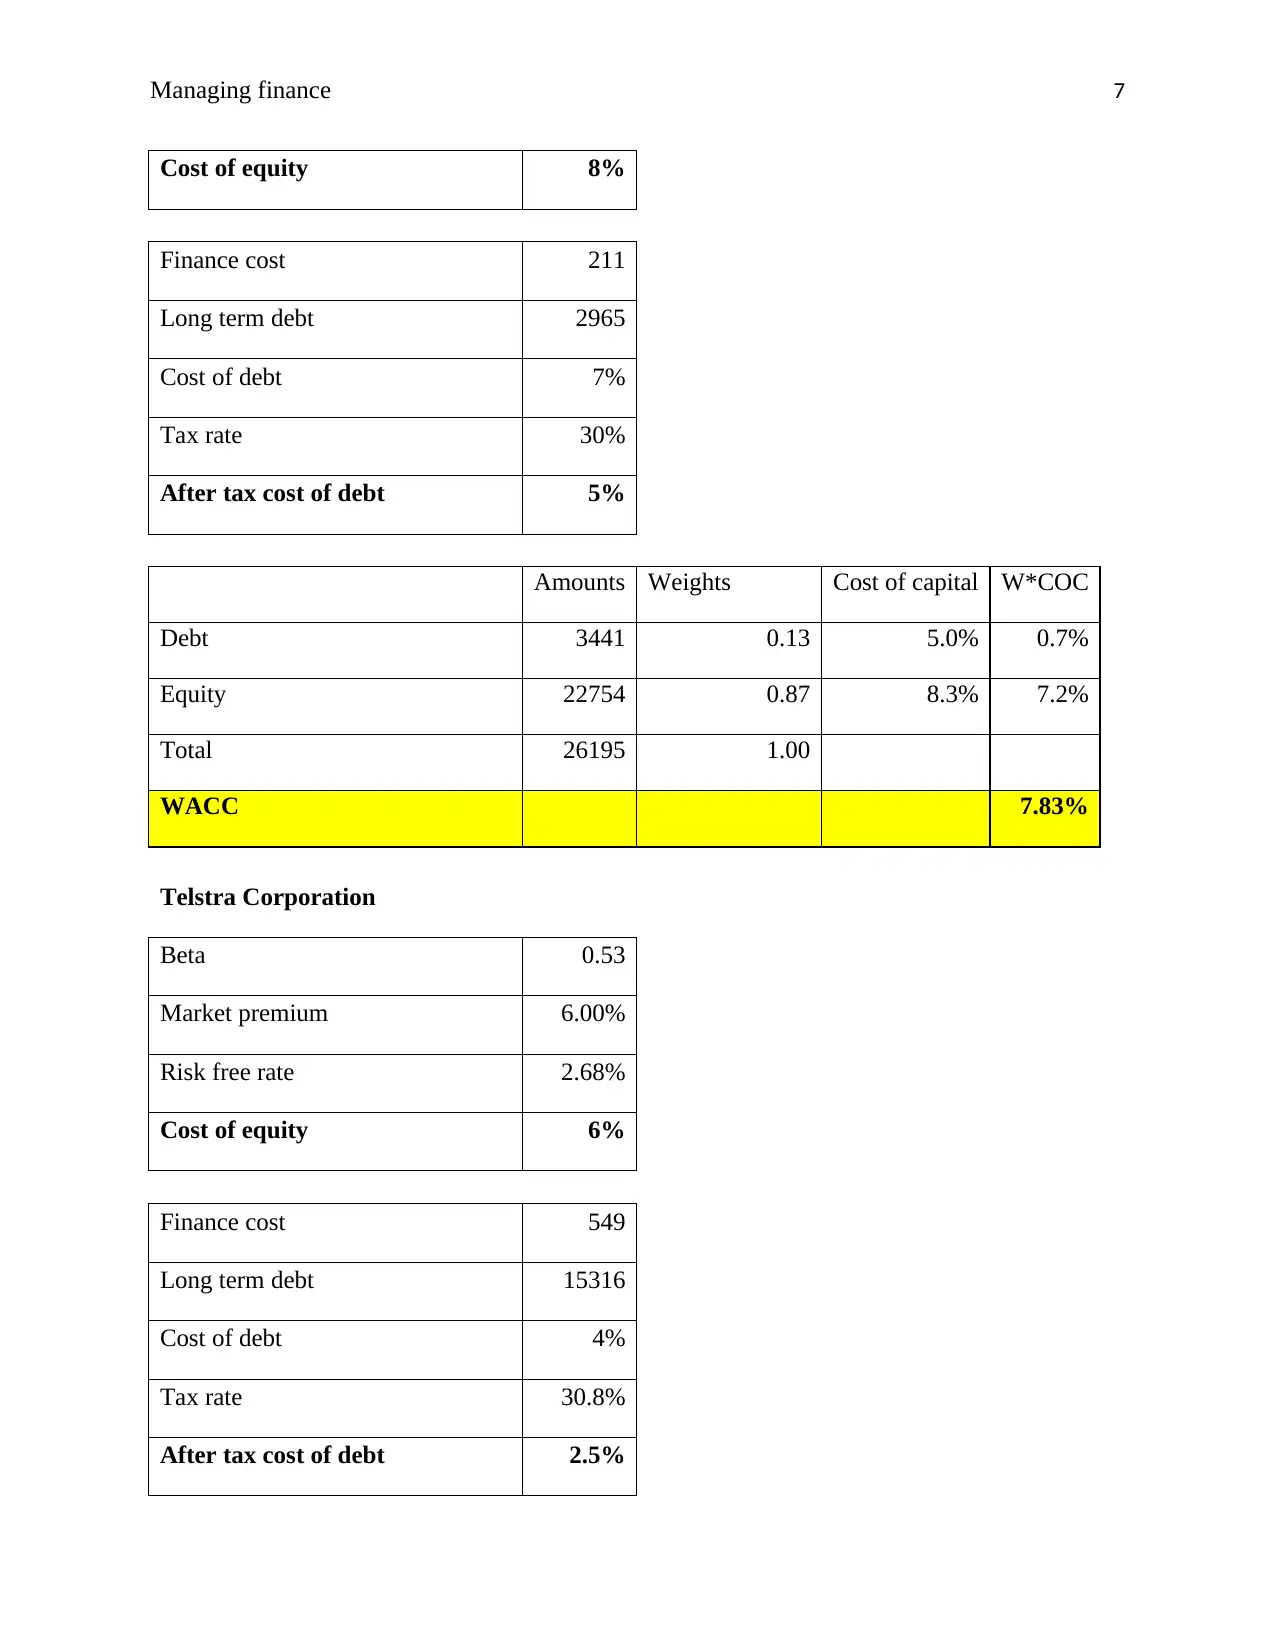
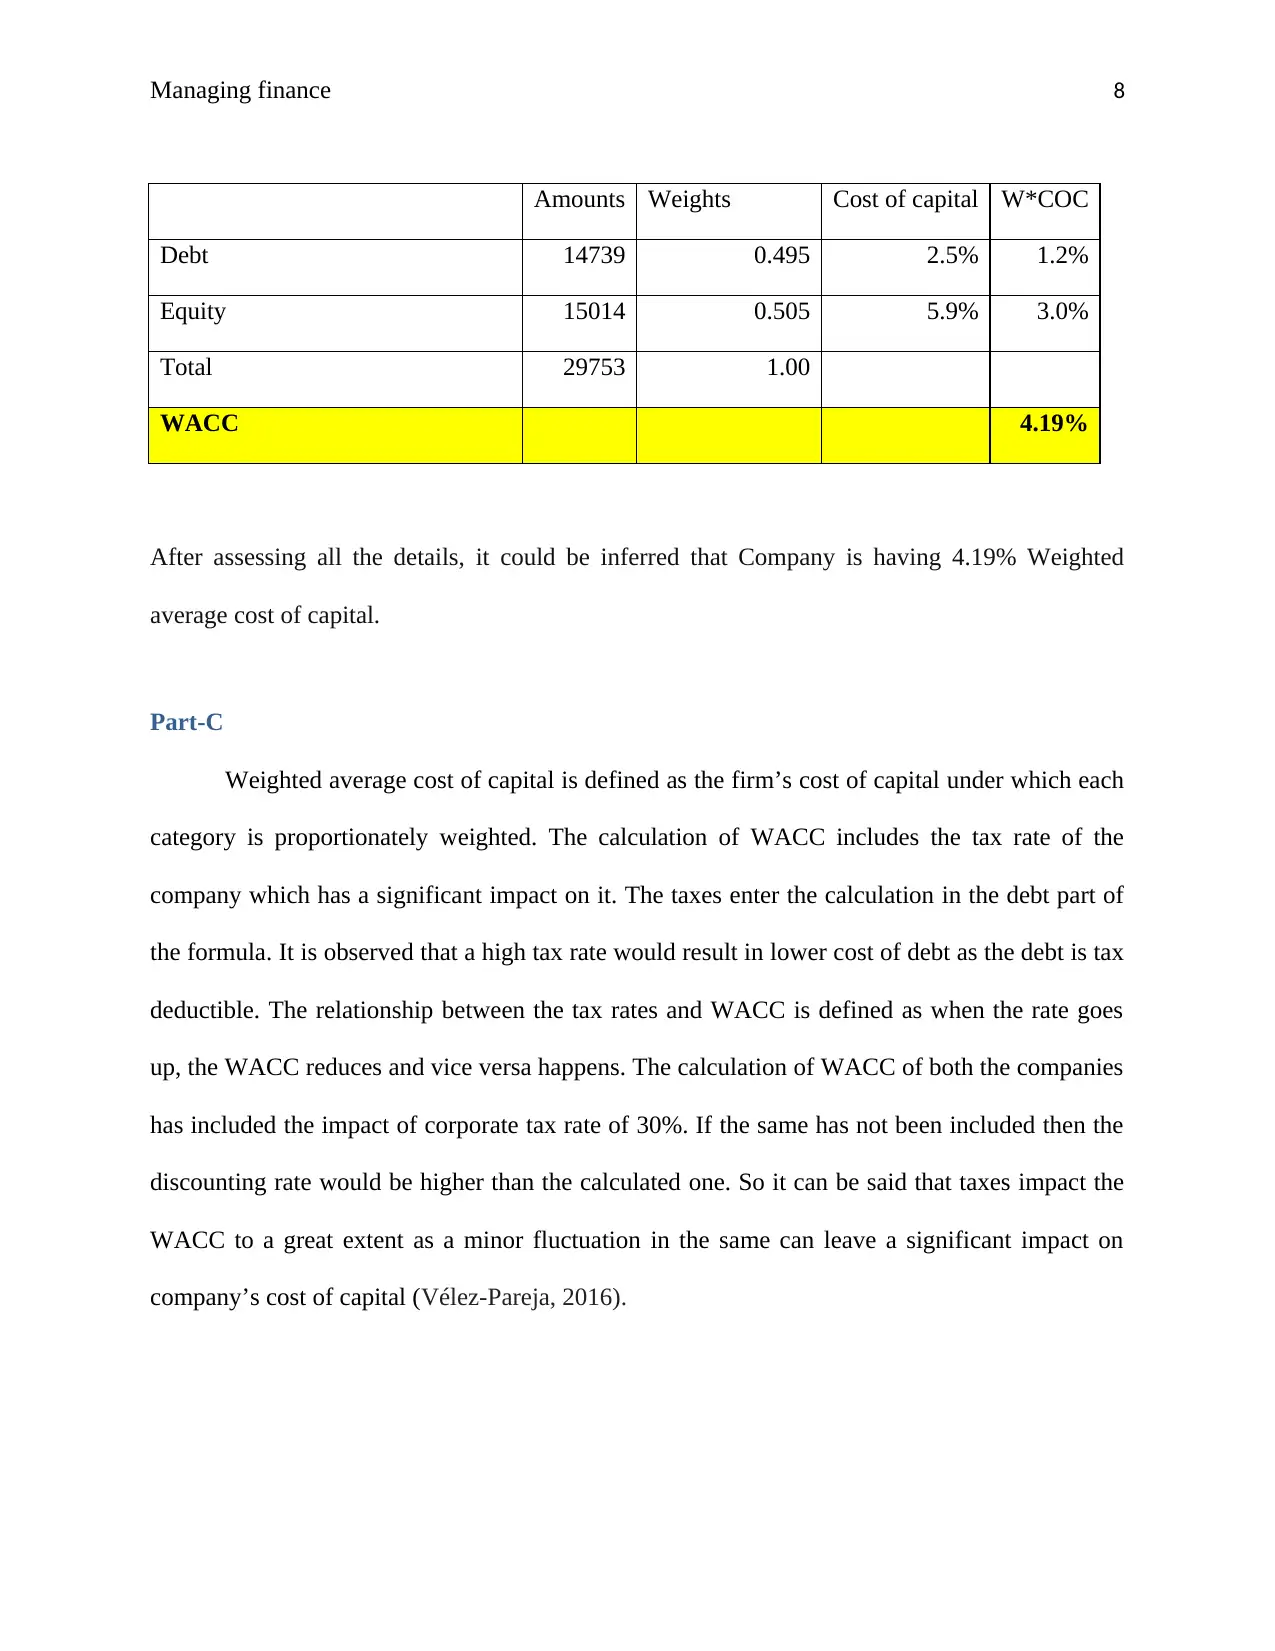
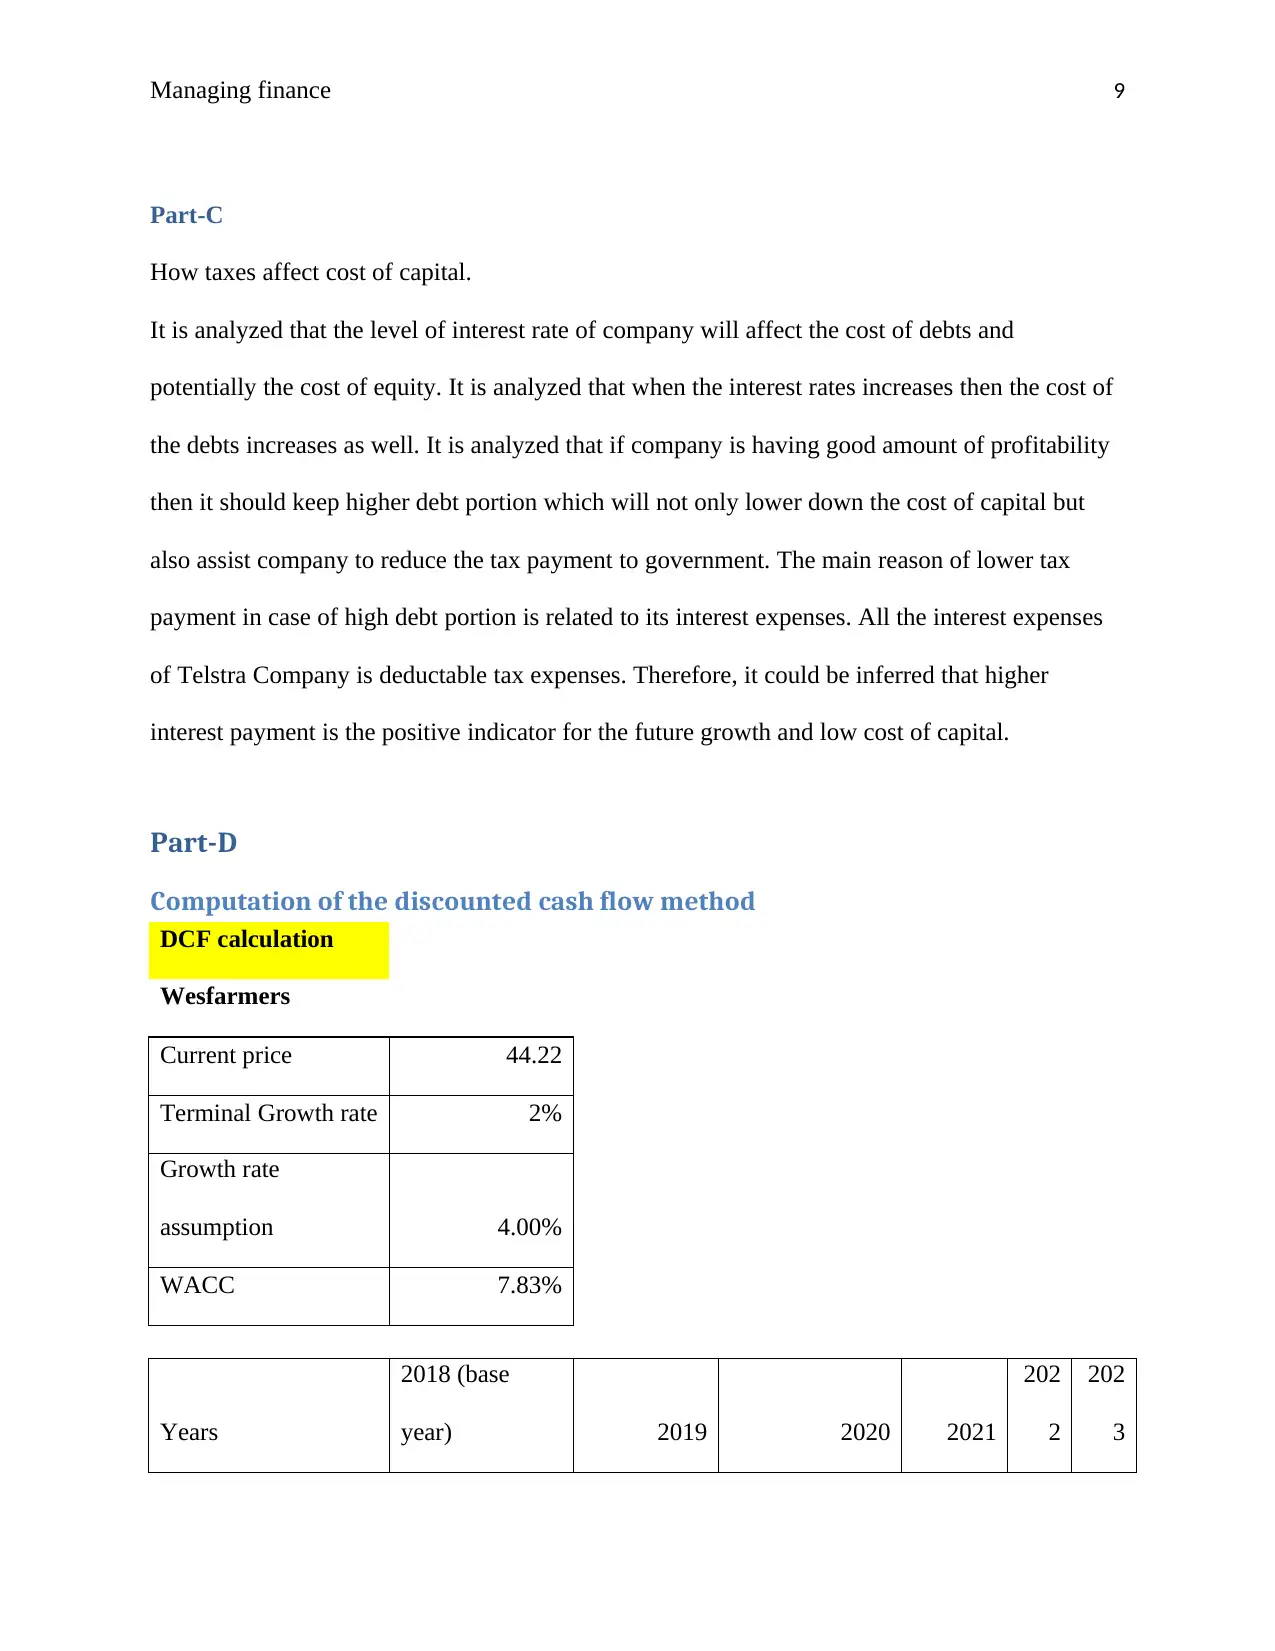
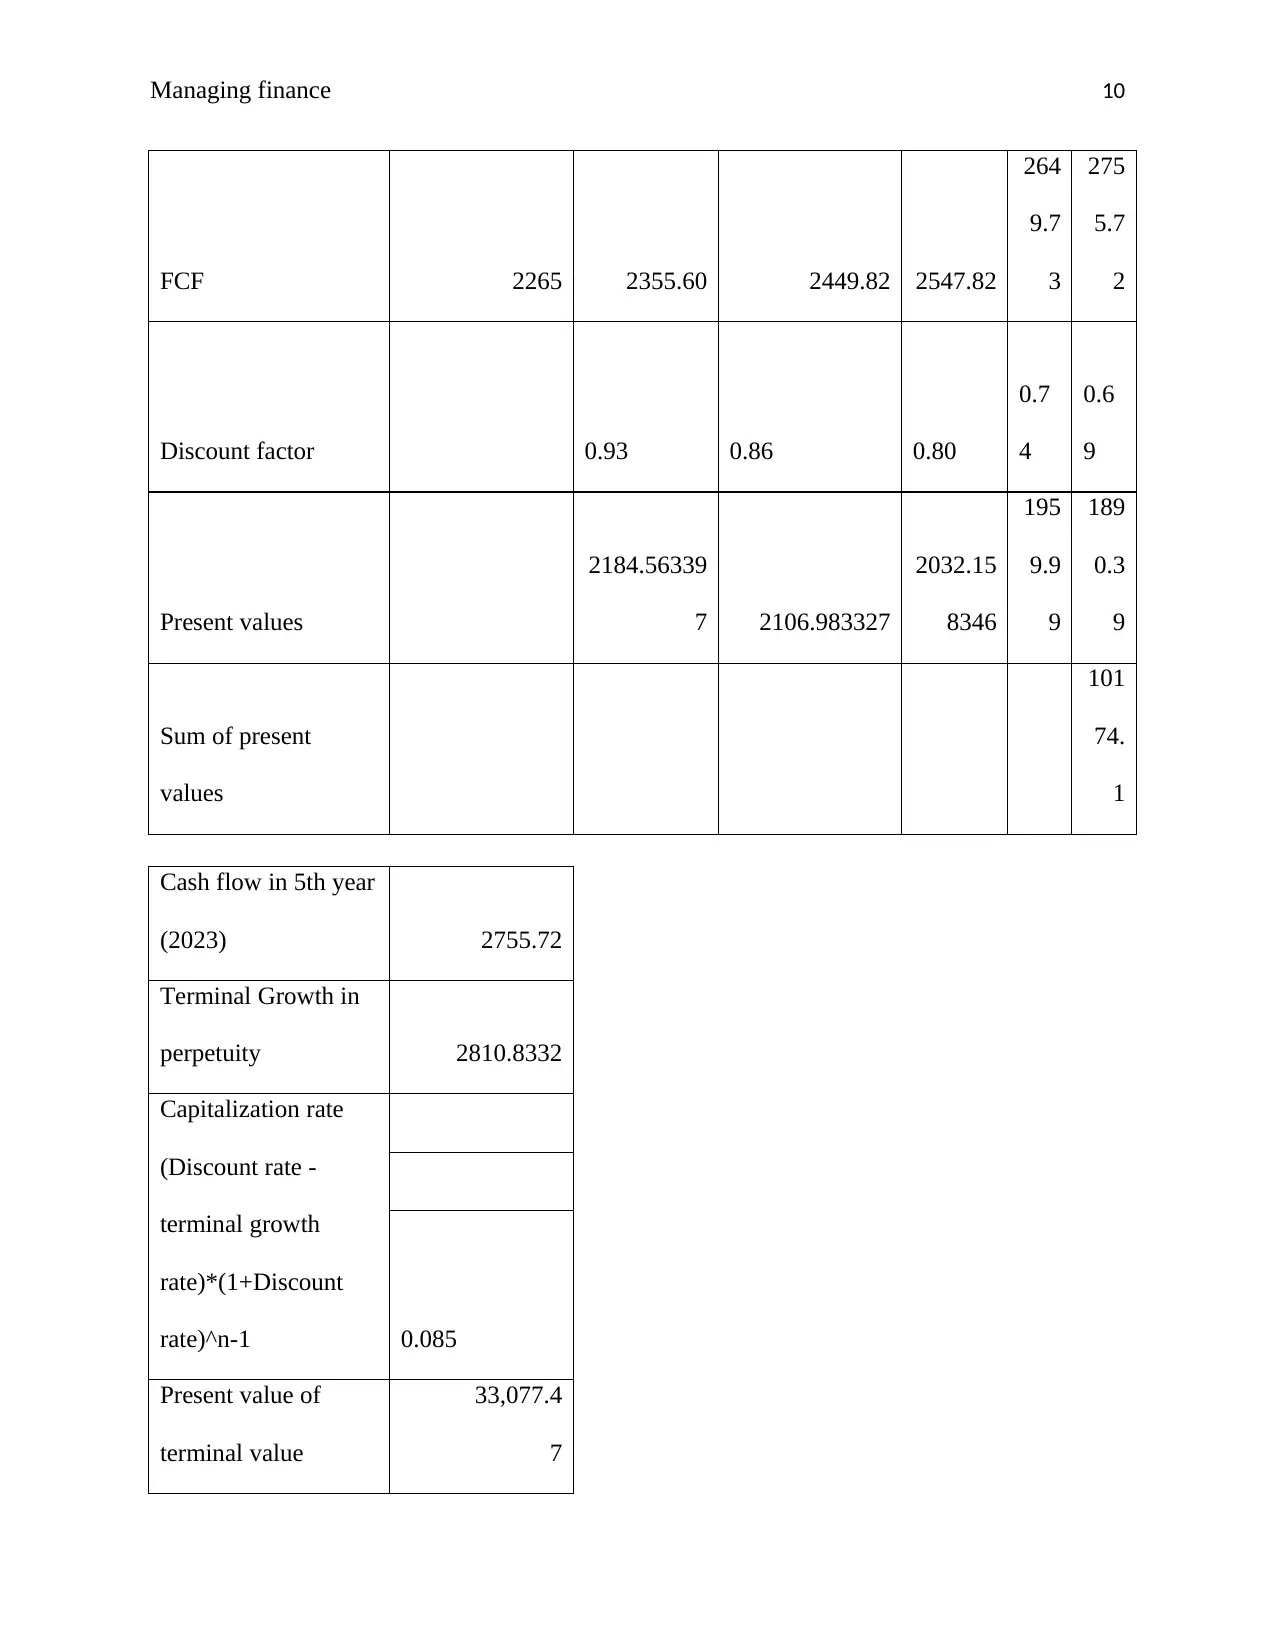
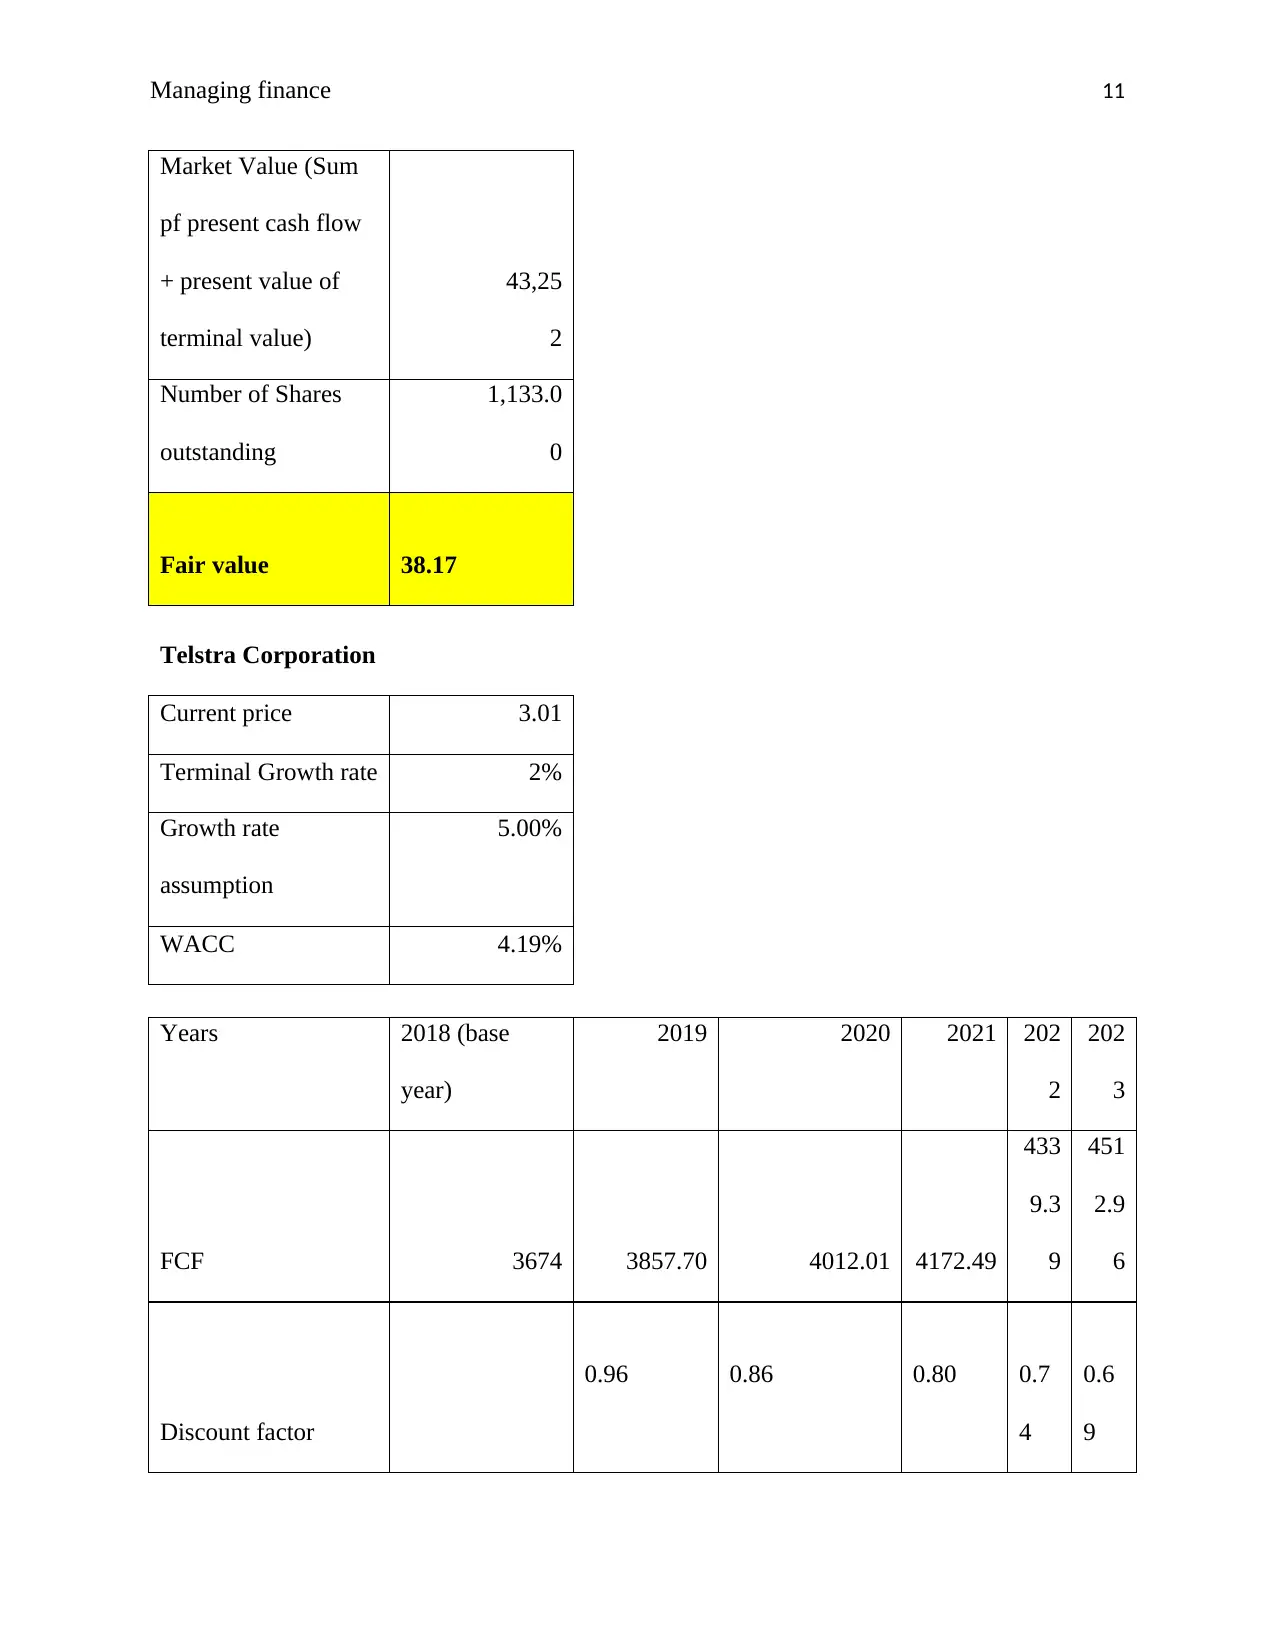
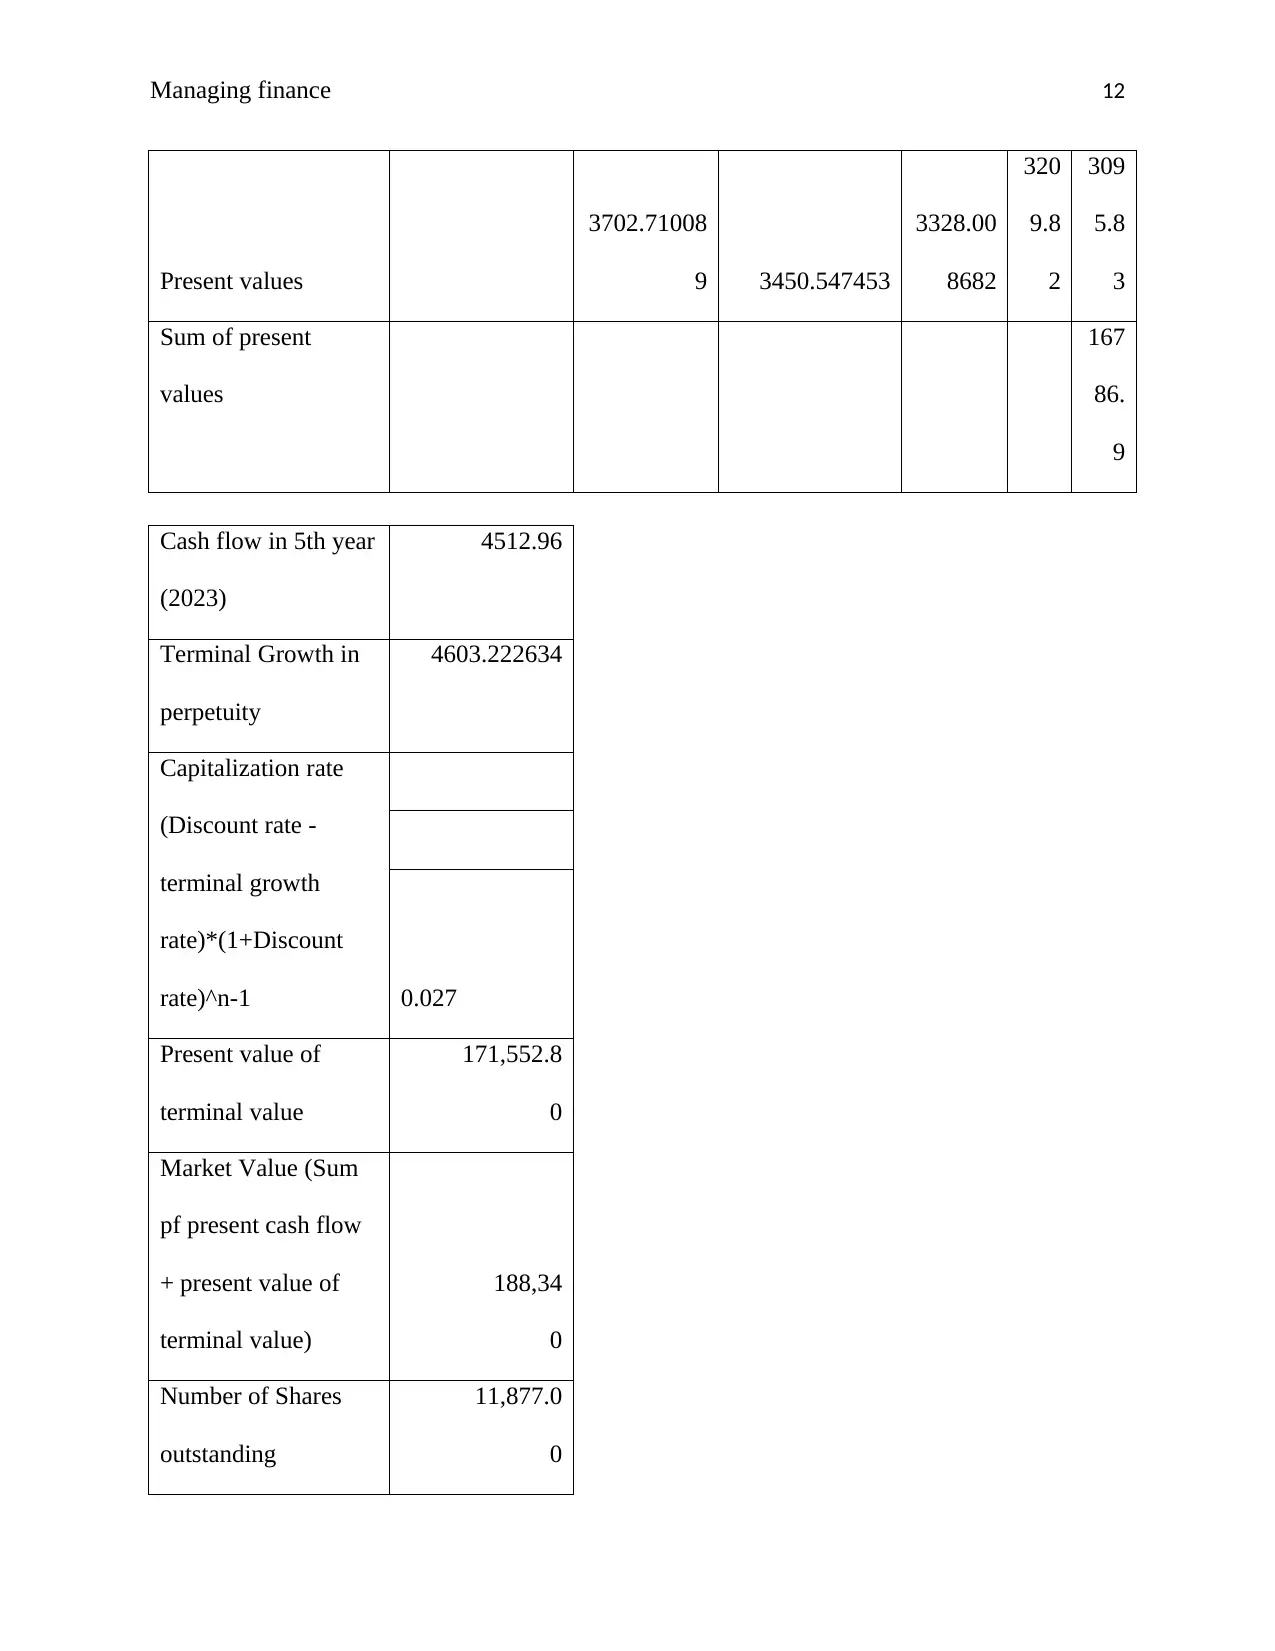
This case study undertakes a comprehensive financial analysis of two Australian companies, Telstra and Wesfarmers, focusing on their capital structures, valuation methods, and financial performance. The analysis includes an examination of each company's capital structure over a five-year period, considering factors like debt-to-equity ratios and industry benchmarks. The study then delves into the weighted average cost of capital (WACC) for both companies, highlighting the impact of tax rates on the cost of debt. Furthermore, the discounted cash flow (DCF) method is applied to estimate the fair value of each company's stock, considering growth rates and terminal values. The report also employs a relative valuation method using price-earnings, price-to-book, and price-to-sales ratios to assess the companies' valuations relative to their industry averages. The findings offer insights into the companies' financial health, investment potential, and the influence of various financial metrics on their market values.

RUNNING HEAD: MANAGING FINANCE
Company valuation
Company valuation
Paraphrase This Document
Need a fresh take? Get an instant paraphrase of this document with our AI Paraphraser

Managing finance 2
Contents
Introduction.................................................................................................................................................3
Part-A..........................................................................................................................................................3
Part-B..........................................................................................................................................................6
Part-C..........................................................................................................................................................8
Part-C..........................................................................................................................................................9
Part-D..........................................................................................................................................................9
Computation of the discounted cash flow method.................................................................................9
Price Earnings Ratio...............................................................................................................................14
Part-E.........................................................................................................................................................16
Part-G........................................................................................................................................................17
Conclusion.................................................................................................................................................18
References.................................................................................................................................................19

Managing finance 3
Introduction
This report emphasizes upon the capital structure, market value and valuation methods
which could be used to analyze the market price of the shares of two companies. In this report,
two companies named, Telstra and Wesfarmers Company have been selected. Each and every
company needs to keep its financial leverage low and profitability high if it wants to survive in
long run. It will allow company to sustain its business in long run.
Part-A
Capital structure of the company generally comprises of two elements named as debt and
equity. Every firm raises its capital from borrowing the funds and issuing the shares. Therefore,
it becomes necessary for them to maintain a balance between its debt and equity portion in order
to have optimal capital structure (Robb & Robinson, 2014). In case of Wesfarmers, the company
is focused on providing a satisfactory return to its shareholders by managing its capital. Its
capital structure consists of Net debt, shareholders’ equity and reserves.
Source of capital Number in
issue
Price per share Market Value Proportion
to total
long term
capital
Ordinary shares 2275.4 10 26195 84.82%
Preference shares 0 0 0 0
Long Term Debt# 3441 10 3441 15.12%
Total 100%
It can be observed from the below table that the debt element of the firm has reduced after 2016
along with the slightest reduction in its equity. It has a high Debt/equity ratio in 2016 at 29.16%
which fall to 15.125 in 2018. Repayment of debt for working capital requirements and
⊘ This is a preview!⊘
Do you want full access?
Subscribe today to unlock all pages.

Trusted by 1+ million students worldwide

Managing finance 4
monitoring the structure as per the group ratings has helped Wesfarmers to reduce its debt
portion. Also when compared with the industry average of 24.50%, the ratio of the company was
lower in the past years except the 2016. This reflects that Wesfarmers relies more on equity and
has less financial obligations which can prove to be an attractive point for the investors.
Moreover, the company uses relevant measures to manage its capital so that it can offer high
returns with low financial risk (Morningstar. 2018).
Capital structure of Wesfarmers (Amount in Million $)
2018 2017 2016 2015 2014
Debt 3441 4400 6692 5817 2998
Equity 22754 23941 22949 24781 25987
Total capital 26195 28341 29641 30598 28985
Debt/equity 15.12% 18.38% 29.16% 23.47% 11.54%
Industry
average
24.50%
On the other hand, Telstra’s capital structure comprises of equal amount of debt and
equity. The company’s capital has approximately 50% equity and 50% net debt. However, a
fluctuating trend can be noticed in the capital structure of the firm over the past five years. It can
be observed that in 2015 and 2017, the debt element of the company has increased as compare to
their prior years. Talking about the recent year the ratio has declined to 98.17% as compare to
104.95% in 2017. Also it is below the industry benchmark of 116.26%. The structure reflects
that Telstra rely heavily on the outside borrowings which forms major part of its net debt. Also it
preserves high financial risk but is trying to reduce its debt portion. Having a ratio lower than the
Paraphrase This Document
Need a fresh take? Get an instant paraphrase of this document with our AI Paraphraser

Managing finance 5
benchmark reflects that company is less risky as compare to the other entities operating in the
same sector (Morningstar. 2018).
Capital structure of Telstra Corporation (Amount in $)
2018 2017 2016 2015 2014
Debt 14739 15,280 12,459 13,566 10,521
Equity 15014 14,560 15,907 14,510 13,960
Total capital 29753 29840 28366 28076 24481
Debt/equity 98.17%
104.95
% 78.32% 93.49% 75.37%
Industry
average 116.26%
There are many factors which influence the capital structure of the firm such as market
conditions, timing and flexibility, size of the company, cost of capital, industry benchmarks and
many others. In case of Wesfarmers, the one major factor which could have influenced its overall
structure is to decide the capital structure for Coles, which has been demerged. According to the
report in financial review, it has been believed that net debt for Coles will be between $1.5
billion and $2.1 billion which is half of Wesfarmers’ debt. It also includes the annual lease costs
and fixed charges which help in achieving the desired credit rating. The analysts assume that
enterprise value for Coles will be between $16 billion and $19 billion. Such decision may have
influenced the structure of the entity in the recent years (Financial Review. 2018). In case of
Telstra Corporation, factors which have and could impact its capital structure is the management
policies adopted by the company in respect of its capital. Its decisions regarding issuing and
repayment of debt, adjustments made in amount of shareholders’ dividend, capital returns to the

Managing finance 6
investors and issue of new shares are some factors which affect Telstra’s capital structure and
allow the company to maintain and adjust the same. Moreover, the changes in company’s
accounting policies also impact its capital structure (Telstra. 2018).
Capital Structure theories
Trade off theory
This theory reveals how company could set up optimum capital structure theory on the
basis of the cost and benefits associated with the same. It set ups relation between the financial
leverage and cost of capital of company.
Modigliani-miller approach
The theories of capital structure, one applicable to both the firms are the Modigliani-
miller approach stating the proposition II with the presence of taxes. It suggests that the value of
the firm can be enhanced by using more debt and reducing the cost of capital. In a way it
supports the net income approach where the increment in debt can bring an optimize capital
structure for the firm.
Part-B
Weighted Average cost of
capital
Wesfarmers Limited
Beta 0.93
Market premium 6.00%
Risk free rate 2.68%
⊘ This is a preview!⊘
Do you want full access?
Subscribe today to unlock all pages.

Trusted by 1+ million students worldwide

Managing finance 7
Cost of equity 8%
Finance cost 211
Long term debt 2965
Cost of debt 7%
Tax rate 30%
After tax cost of debt 5%
Amounts Weights Cost of capital W*COC
Debt 3441 0.13 5.0% 0.7%
Equity 22754 0.87 8.3% 7.2%
Total 26195 1.00
WACC 7.83%
Telstra Corporation
Beta 0.53
Market premium 6.00%
Risk free rate 2.68%
Cost of equity 6%
Finance cost 549
Long term debt 15316
Cost of debt 4%
Tax rate 30.8%
After tax cost of debt 2.5%
Paraphrase This Document
Need a fresh take? Get an instant paraphrase of this document with our AI Paraphraser

Managing finance 8
Amounts Weights Cost of capital W*COC
Debt 14739 0.495 2.5% 1.2%
Equity 15014 0.505 5.9% 3.0%
Total 29753 1.00
WACC 4.19%
After assessing all the details, it could be inferred that Company is having 4.19% Weighted
average cost of capital.
Part-C
Weighted average cost of capital is defined as the firm’s cost of capital under which each
category is proportionately weighted. The calculation of WACC includes the tax rate of the
company which has a significant impact on it. The taxes enter the calculation in the debt part of
the formula. It is observed that a high tax rate would result in lower cost of debt as the debt is tax
deductible. The relationship between the tax rates and WACC is defined as when the rate goes
up, the WACC reduces and vice versa happens. The calculation of WACC of both the companies
has included the impact of corporate tax rate of 30%. If the same has not been included then the
discounting rate would be higher than the calculated one. So it can be said that taxes impact the
WACC to a great extent as a minor fluctuation in the same can leave a significant impact on
company’s cost of capital (Vélez-Pareja, 2016).

Managing finance 9
Part-C
How taxes affect cost of capital.
It is analyzed that the level of interest rate of company will affect the cost of debts and
potentially the cost of equity. It is analyzed that when the interest rates increases then the cost of
the debts increases as well. It is analyzed that if company is having good amount of profitability
then it should keep higher debt portion which will not only lower down the cost of capital but
also assist company to reduce the tax payment to government. The main reason of lower tax
payment in case of high debt portion is related to its interest expenses. All the interest expenses
of Telstra Company is deductable tax expenses. Therefore, it could be inferred that higher
interest payment is the positive indicator for the future growth and low cost of capital.
Part-D
Computation of the discounted cash flow method
DCF calculation
Wesfarmers
Current price 44.22
Terminal Growth rate 2%
Growth rate
assumption 4.00%
WACC 7.83%
Years
2018 (base
year) 2019 2020 2021
202
2
202
3
⊘ This is a preview!⊘
Do you want full access?
Subscribe today to unlock all pages.

Trusted by 1+ million students worldwide

Managing finance 10
FCF 2265 2355.60 2449.82 2547.82
264
9.7
3
275
5.7
2
Discount factor 0.93 0.86 0.80
0.7
4
0.6
9
Present values
2184.56339
7 2106.983327
2032.15
8346
195
9.9
9
189
0.3
9
Sum of present
values
101
74.
1
Cash flow in 5th year
(2023) 2755.72
Terminal Growth in
perpetuity 2810.8332
Capitalization rate
(Discount rate -
terminal growth
rate)*(1+Discount
rate)^n-1 0.085
Present value of
terminal value
33,077.4
7
Paraphrase This Document
Need a fresh take? Get an instant paraphrase of this document with our AI Paraphraser

Managing finance 11
Market Value (Sum
pf present cash flow
+ present value of
terminal value)
43,25
2
Number of Shares
outstanding
1,133.0
0
Fair value 38.17
Telstra Corporation
Current price 3.01
Terminal Growth rate 2%
Growth rate
assumption
5.00%
WACC 4.19%
Years 2018 (base
year)
2019 2020 2021 202
2
202
3
FCF 3674 3857.70 4012.01 4172.49
433
9.3
9
451
2.9
6
Discount factor
0.96 0.86 0.80 0.7
4
0.6
9

Managing finance 12
Present values
3702.71008
9 3450.547453
3328.00
8682
320
9.8
2
309
5.8
3
Sum of present
values
167
86.
9
Cash flow in 5th year
(2023)
4512.96
Terminal Growth in
perpetuity
4603.222634
Capitalization rate
(Discount rate -
terminal growth
rate)*(1+Discount
rate)^n-1 0.027
Present value of
terminal value
171,552.8
0
Market Value (Sum
pf present cash flow
+ present value of
terminal value)
188,34
0
Number of Shares
outstanding
11,877.0
0
⊘ This is a preview!⊘
Do you want full access?
Subscribe today to unlock all pages.

Trusted by 1+ million students worldwide
1 out of 20
Related Documents

Your All-in-One AI-Powered Toolkit for Academic Success.
+13062052269
info@desklib.com
Available 24*7 on WhatsApp / Email
Unlock your academic potential
Copyright © 2020–2025 A2Z Services. All Rights Reserved. Developed and managed by ZUCOL.