Capitaland Limited: A Financial Performance and Strategy Report
VerifiedAdded on 2023/06/04
|15
|3148
|447
Report
AI Summary
This report provides a comprehensive financial analysis of CapitaLand Limited, a Singapore-listed real estate company, for its Board of Directors. It evaluates the company's performance through key financial and non-financial ratios, including profitability, asset efficiency, and liquidity. The report highlights the company's strong financial and non-financial performance, as well as its effective corporate governance policies that support sustainable growth. Additionally, it offers recommendations for effective capital structure monitoring as a medium-term financial strategy. The analysis covers the period from 2012 to 2017, providing insights into the company's financial trends and performance metrics. The report also includes a critical evaluation of corporate governance compliance and proposes medium-term financial strategies for achieving a dominant position within the real estate sector. The analysis aims to provide a perspective of a potential candidate seeking the job of a finance director.

1
FINM036 Assignment Two
FINM036 Assignment Two
Paraphrase This Document
Need a fresh take? Get an instant paraphrase of this document with our AI Paraphraser
2
Executive Summary
The main purpose of the report is to critically evaluate and analyze the key performance
indicators of a selected organization CapitaLand Limited; a Singapore listed Real Estate
Company. The report has been directed to its Board of Directors and has assesses its
performance through calculation of some of its key financial and non-financial ratios. It has been
examine through the report that the company is having a good financial and non-financial
performance. Also, its effective corporate governance policies are promoting its sustainable
growth and development. The company is further recommended to effectively monitor and
control its capital structure as a medium-term financial strategy.
3
Contents
Executive Summary.........................................................................................................................2
Introduction......................................................................................................................................4
Brief Introduction of the Selected Company ‘CAPITALAND LIMITED’.................................4
Section A: (Part 1): Performance of the selected company (Capitaland)........................................4
Ratio Analysis of Capitaland for last five years..........................................................................4
Profitability analysis.................................................................................................................5
Assets Efficiency Ratios...........................................................................................................8
Liquidity Analysis..................................................................................................................10
Other Ratios............................................................................................................................11
Section B....................................................................................................................................12
Part 1: Critical Evaluation of Corporate Governance Compliance........................................12
Part 2: Proposed Medium-Term Financial Strategies of Selected Company.........................13
Conclusion.....................................................................................................................................13
References......................................................................................................................................14
⊘ This is a preview!⊘
Do you want full access?
Subscribe today to unlock all pages.
Trusted by 1+ million students worldwide
4
Introduction
The present report is developed for providing an evaluation of the key accounting and
corporate finance concepts of a selected company to its Board of Directors. This is done on the
perspective of a potential candidate seeking for the job of a finance director of a company listed
on Alternative Investment Market (AIM) within the London Stock Exchange (LSE). It is
developed as a part of the interviewing process for the job role that need to be presented to the
Board of Directors for presenting information in relation to the vision and strategic financial
goals of the selected company. The financial performance of the company is selected with the
use of financial ratios such as profitability, efficiency, liquidity and other that are relevant for
gaining an understanding of its current and future financial outcomes. This is followed by
carrying out a critical evaluation of the corporate governance framework of the selected
company to analyze its impact on the brand and reputation. It has also provided a discussion in
relation to the discussion of the proposed medium term financial strategies of the selected
company for achieving a dominant position within its respective sector.
Brief Introduction of the Selected Company ‘CAPITALAND LIMITED’
The company selected for the analysis purpose is ‘Capital Land Limited’ that is a
public-limited entity traded as SGX in Singapore. It is known to be one of the largest real estate
company recognized for managing a global portfolio of real estate products. The company’s
product portfolio consists of integrated developments, shopping malls, residencies, offices,
homes and financial services. The company is providing its products and services in about 30
countries but its core markets include Singapore and China. It has recorded a turnover of about
$93 billion as of the end of the year 2018. It is recognized as one of the largest investment
management businesses across Asia and is estimated to provide employment to about 8.48K
people around the world.
Section A: (Part 1): Performance of the selected company (Capitaland)
Ratio Analysis of Capitaland for last five years
Ratio analysis is an important management tool that is used to make the quantitative
analysis of financial information contained in the financial statements of the company. The main
Paraphrase This Document
Need a fresh take? Get an instant paraphrase of this document with our AI Paraphraser
5
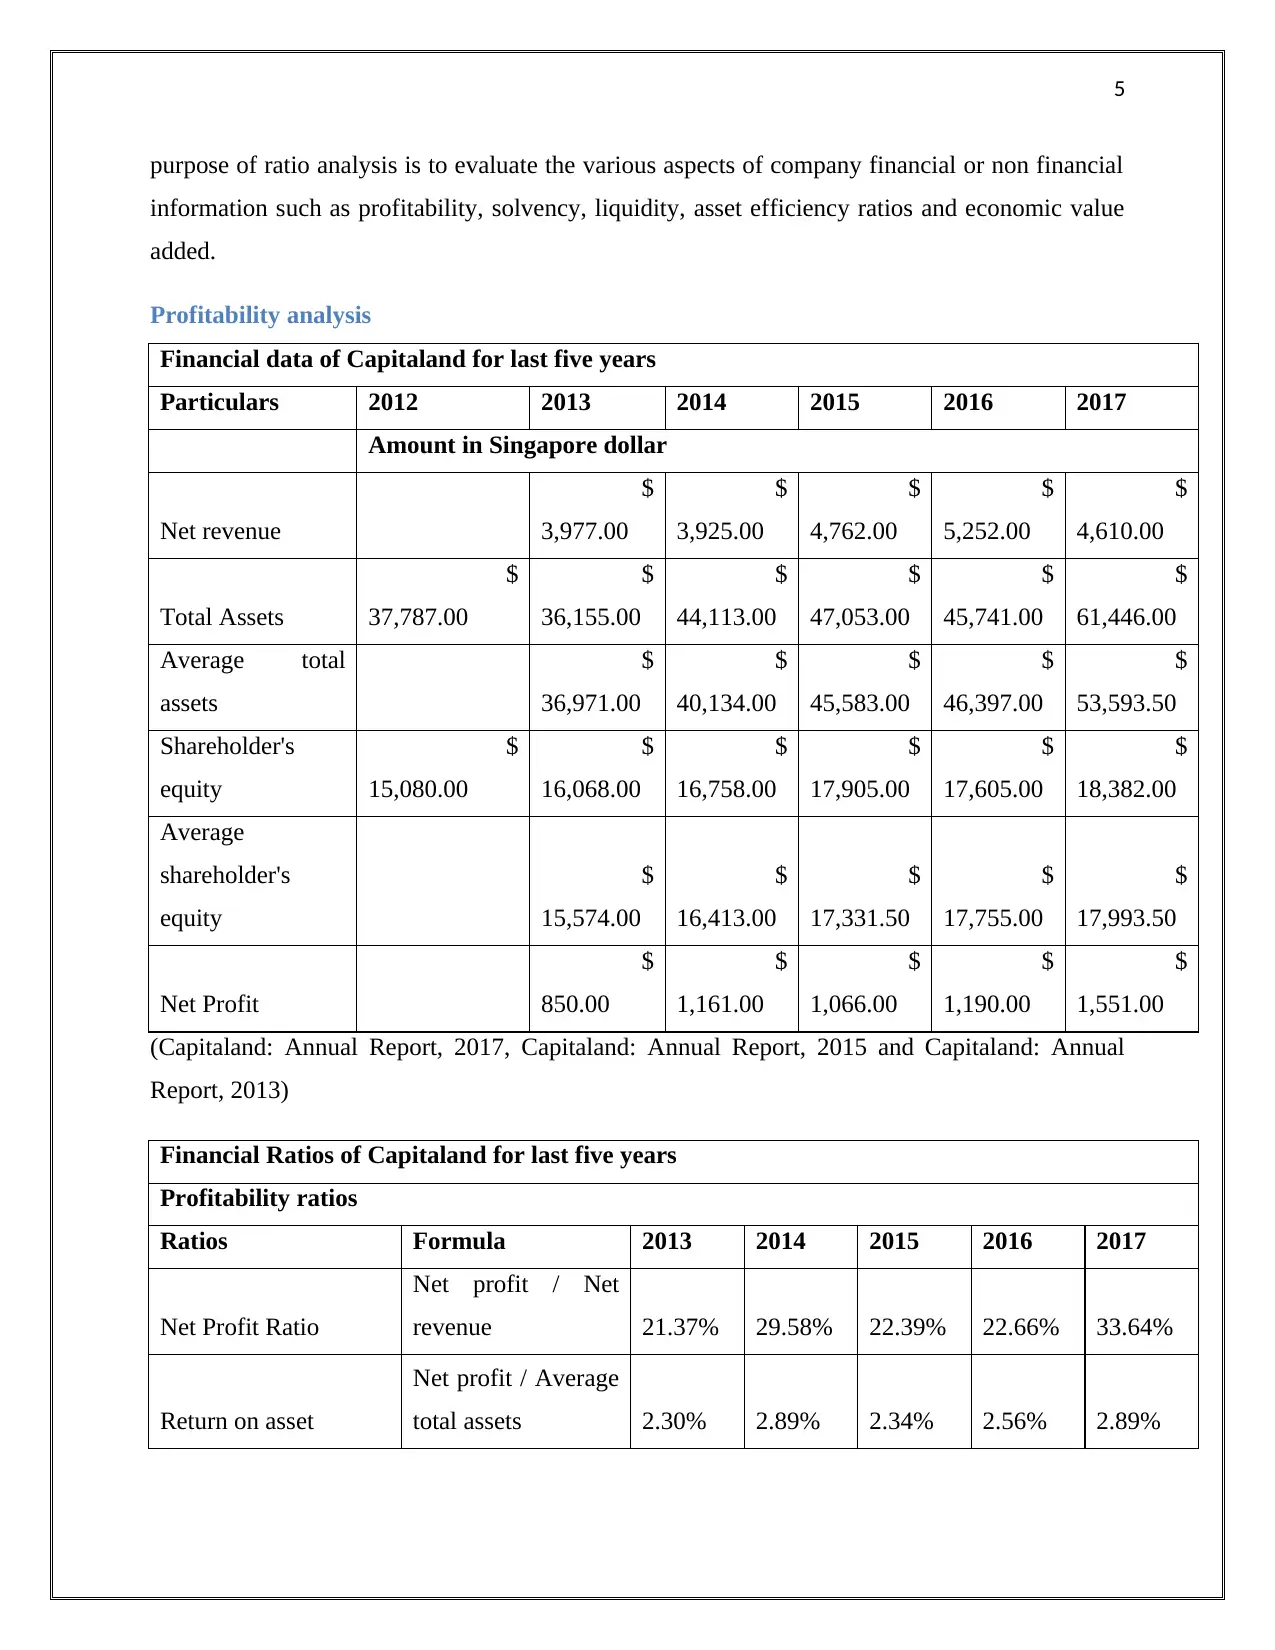
purpose of ratio analysis is to evaluate the various aspects of company financial or non financial
information such as profitability, solvency, liquidity, asset efficiency ratios and economic value
added.
Profitability analysis
Financial data of Capitaland for last five years
Particulars 2012 2013 2014 2015 2016 2017
Amount in Singapore dollar
Net revenue
$
3,977.00
$
3,925.00
$
4,762.00
$
5,252.00
$
4,610.00
Total Assets
$
37,787.00
$
36,155.00
$
44,113.00
$
47,053.00
$
45,741.00
$
61,446.00
Average total
assets
$
36,971.00
$
40,134.00
$
45,583.00
$
46,397.00
$
53,593.50
Shareholder's
equity
$
15,080.00
$
16,068.00
$
16,758.00
$
17,905.00
$
17,605.00
$
18,382.00
Average
shareholder's
equity
$
15,574.00
$
16,413.00
$
17,331.50
$
17,755.00
$
17,993.50
Net Profit
$
850.00
$
1,161.00
$
1,066.00
$
1,190.00
$
1,551.00
(Capitaland: Annual Report, 2017, Capitaland: Annual Report, 2015 and Capitaland: Annual
Report, 2013)
Financial Ratios of Capitaland for last five years
Profitability ratios
Ratios Formula 2013 2014 2015 2016 2017
Net Profit Ratio
Net profit / Net
revenue 21.37% 29.58% 22.39% 22.66% 33.64%
Return on asset
Net profit / Average
total assets 2.30% 2.89% 2.34% 2.56% 2.89%
6
Return on Equity
Net profit / Average
shareholder's equity 5.46% 7.07% 6.15% 6.70% 8.62%
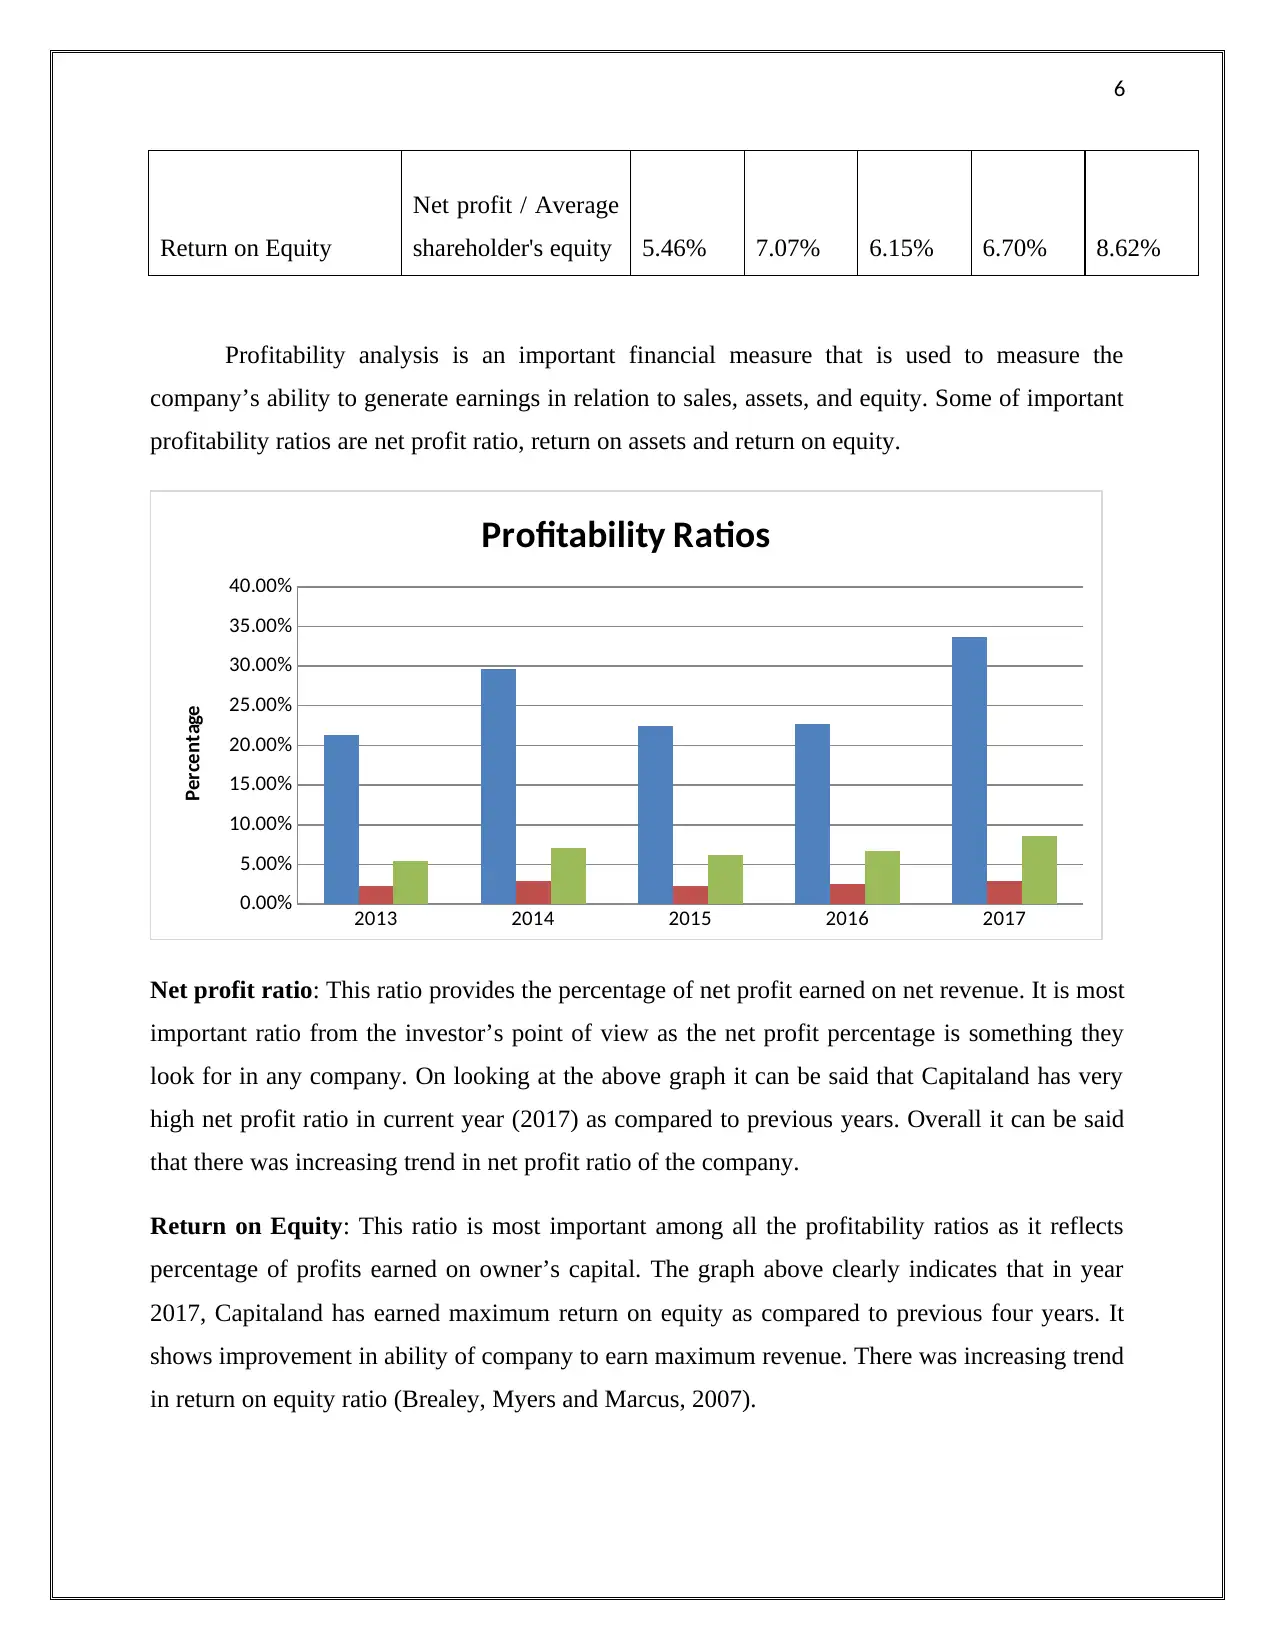
Profitability analysis is an important financial measure that is used to measure the
company’s ability to generate earnings in relation to sales, assets, and equity. Some of important
profitability ratios are net profit ratio, return on assets and return on equity.
2013 2014 2015 2016 2017
0.00%
5.00%
10.00%
15.00%
20.00%
25.00%
30.00%
35.00%
40.00%
Profitability Ratios
Percentage
Net profit ratio: This ratio provides the percentage of net profit earned on net revenue. It is most
important ratio from the investor’s point of view as the net profit percentage is something they
look for in any company. On looking at the above graph it can be said that Capitaland has very
high net profit ratio in current year (2017) as compared to previous years. Overall it can be said
that there was increasing trend in net profit ratio of the company.
Return on Equity: This ratio is most important among all the profitability ratios as it reflects
percentage of profits earned on owner’s capital. The graph above clearly indicates that in year
2017, Capitaland has earned maximum return on equity as compared to previous four years. It
shows improvement in ability of company to earn maximum revenue. There was increasing trend
in return on equity ratio (Brealey, Myers and Marcus, 2007).
Return on Equity
Net profit / Average
shareholder's equity 5.46% 7.07% 6.15% 6.70% 8.62%
Profitability analysis is an important financial measure that is used to measure the
company’s ability to generate earnings in relation to sales, assets, and equity. Some of important
profitability ratios are net profit ratio, return on assets and return on equity.
2013 2014 2015 2016 2017
0.00%
5.00%
10.00%
15.00%
20.00%
25.00%
30.00%
35.00%
40.00%
Profitability Ratios
Percentage
Net profit ratio: This ratio provides the percentage of net profit earned on net revenue. It is most
important ratio from the investor’s point of view as the net profit percentage is something they
look for in any company. On looking at the above graph it can be said that Capitaland has very
high net profit ratio in current year (2017) as compared to previous years. Overall it can be said
that there was increasing trend in net profit ratio of the company.
Return on Equity: This ratio is most important among all the profitability ratios as it reflects
percentage of profits earned on owner’s capital. The graph above clearly indicates that in year
2017, Capitaland has earned maximum return on equity as compared to previous four years. It
shows improvement in ability of company to earn maximum revenue. There was increasing trend
in return on equity ratio (Brealey, Myers and Marcus, 2007).
⊘ This is a preview!⊘
Do you want full access?
Subscribe today to unlock all pages.
Trusted by 1+ million students worldwide
7
Return on assets: This ratio is mainly calculated by the management to know their performance
in utilizing the assets of the company to earn the revenue. This ratio provides percentage of net
profit earned on total assets of the company. It seems that company earns very little profit
percentage on the total assets employed by the company in a year. It is because Capitaland
belongs to real estate industry where the value of assets is much more in compare to earnings
earned by the company. However, it can be said that company has able to maintained the
sufficient percentage of return on assets looking into the sector in which belongs.
Paraphrase This Document
Need a fresh take? Get an instant paraphrase of this document with our AI Paraphraser
8
Assets Efficiency Ratios
Financial data of Capitaland for last five years
Particulars 2012 2013 2014 2015 2016 2017
Amount in Singapore dollar
Net revenue
$
3,977.00
$
3,925.00
$
4,762.00
$
5,252.00
$
4,610.00
Total Assets
$
37,787.00
$
36,155.00
$
44,113.00
$
47,053.00
$
45,741.00
$
61,446.00
Average total
assets
$
36,971.00
$
40,134.00
$
45,583.00
$
46,397.00
$
53,593.50
Shareholder's
equity
$
15,080.00
$
16,068.00
$
16,758.00
$
17,905.00
$
17,605.00
$
18,382.00
Account
Receivables
$
1,485.00
$
1,164.00
$
963.00
$
1,424.00
$
1,859.00
$
1,471.00
Average
Accounts
Receivables
$
1,324.50
$
1,063.50
$
1,193.50
$
1,641.50
$
1,665.00
(Capitaland: Annual Report, 2017, Capitaland: Annual Report, 2015 and Capitaland: Annual
Report, 2013)
Financial Ratios of Capitaland for last five years
Asset Efficiency ratios
Ratios Formula 2013 2014 2015 2016 2017
Asset Turnover in days
Average total
assets*365/Revenue
3393.1
1
3732.2
1
3493.8
7
3224.4
7
4243.3
0
Average collection
period in days
Average accounts
receivable *365/ Net
Revenue 121.56 98.90 91.48 114.08 131.83
9
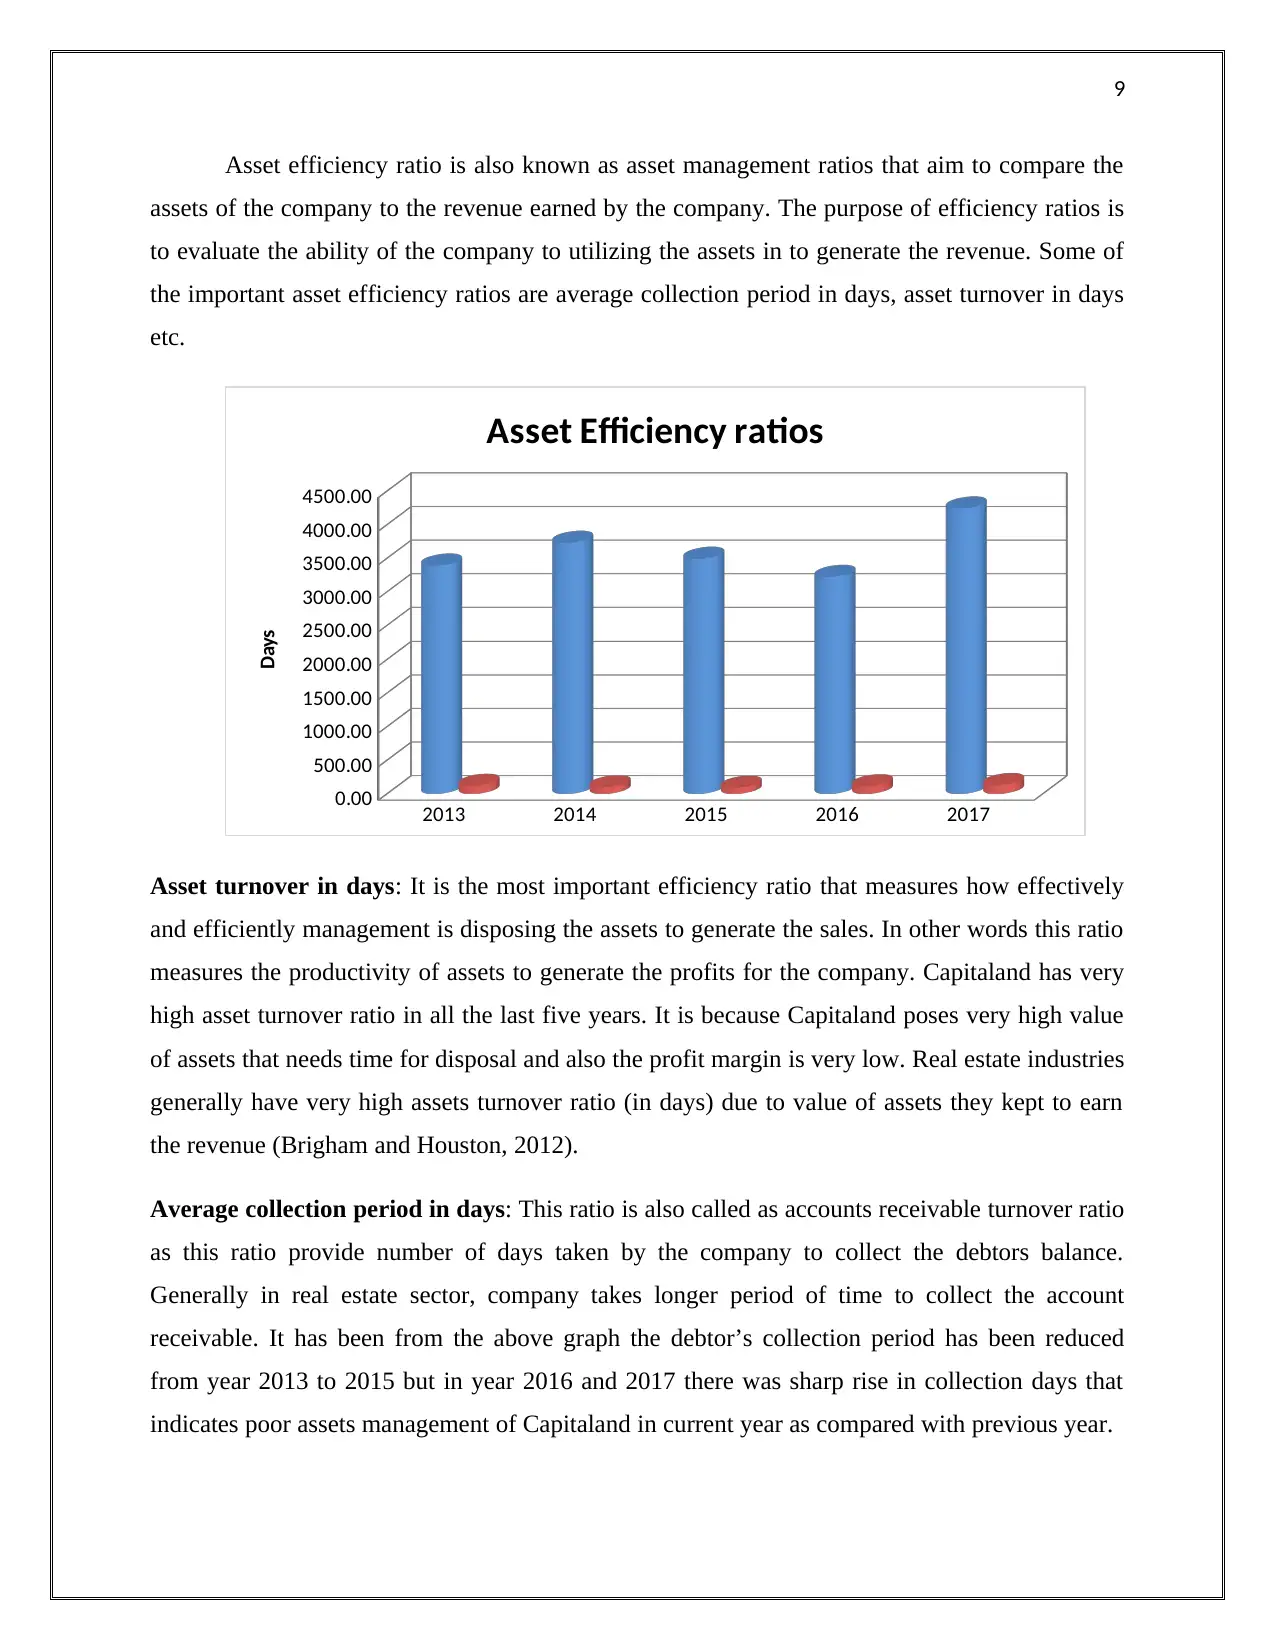
Asset efficiency ratio is also known as asset management ratios that aim to compare the
assets of the company to the revenue earned by the company. The purpose of efficiency ratios is
to evaluate the ability of the company to utilizing the assets in to generate the revenue. Some of
the important asset efficiency ratios are average collection period in days, asset turnover in days
etc.
2013 2014 2015 2016 2017
0.00
500.00
1000.00
1500.00
2000.00
2500.00
3000.00
3500.00
4000.00
4500.00
Asset Efficiency ratios
Days
Asset turnover in days: It is the most important efficiency ratio that measures how effectively
and efficiently management is disposing the assets to generate the sales. In other words this ratio
measures the productivity of assets to generate the profits for the company. Capitaland has very
high asset turnover ratio in all the last five years. It is because Capitaland poses very high value
of assets that needs time for disposal and also the profit margin is very low. Real estate industries
generally have very high assets turnover ratio (in days) due to value of assets they kept to earn
the revenue (Brigham and Houston, 2012).
Average collection period in days: This ratio is also called as accounts receivable turnover ratio
as this ratio provide number of days taken by the company to collect the debtors balance.
Generally in real estate sector, company takes longer period of time to collect the account
receivable. It has been from the above graph the debtor’s collection period has been reduced
from year 2013 to 2015 but in year 2016 and 2017 there was sharp rise in collection days that
indicates poor assets management of Capitaland in current year as compared with previous year.
⊘ This is a preview!⊘
Do you want full access?
Subscribe today to unlock all pages.
Trusted by 1+ million students worldwide
10
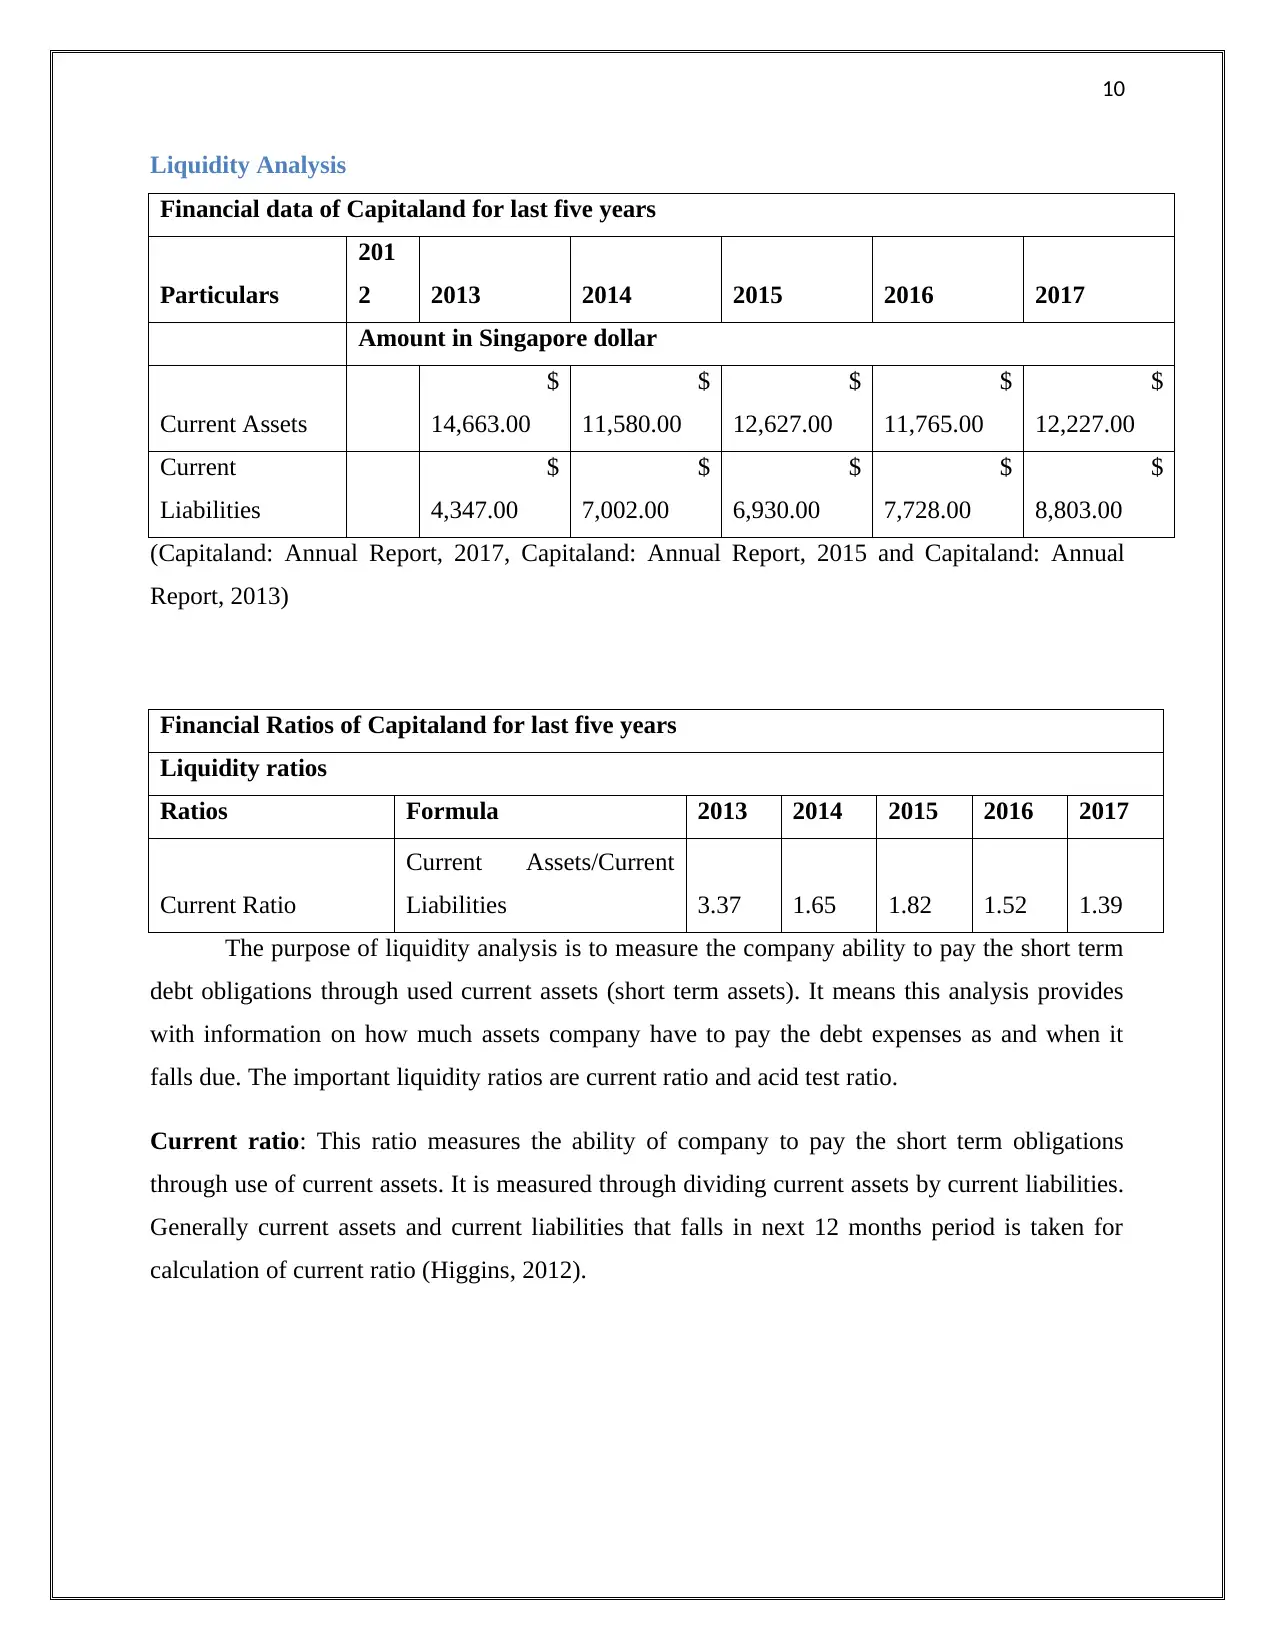
Liquidity Analysis
Financial data of Capitaland for last five years
Particulars
201
2 2013 2014 2015 2016 2017
Amount in Singapore dollar
Current Assets
$
14,663.00
$
11,580.00
$
12,627.00
$
11,765.00
$
12,227.00
Current
Liabilities
$
4,347.00
$
7,002.00
$
6,930.00
$
7,728.00
$
8,803.00
(Capitaland: Annual Report, 2017, Capitaland: Annual Report, 2015 and Capitaland: Annual
Report, 2013)
Financial Ratios of Capitaland for last five years
Liquidity ratios
Ratios Formula 2013 2014 2015 2016 2017
Current Ratio
Current Assets/Current
Liabilities 3.37 1.65 1.82 1.52 1.39
The purpose of liquidity analysis is to measure the company ability to pay the short term
debt obligations through used current assets (short term assets). It means this analysis provides
with information on how much assets company have to pay the debt expenses as and when it
falls due. The important liquidity ratios are current ratio and acid test ratio.
Current ratio: This ratio measures the ability of company to pay the short term obligations
through use of current assets. It is measured through dividing current assets by current liabilities.
Generally current assets and current liabilities that falls in next 12 months period is taken for
calculation of current ratio (Higgins, 2012).
Paraphrase This Document
Need a fresh take? Get an instant paraphrase of this document with our AI Paraphraser
11
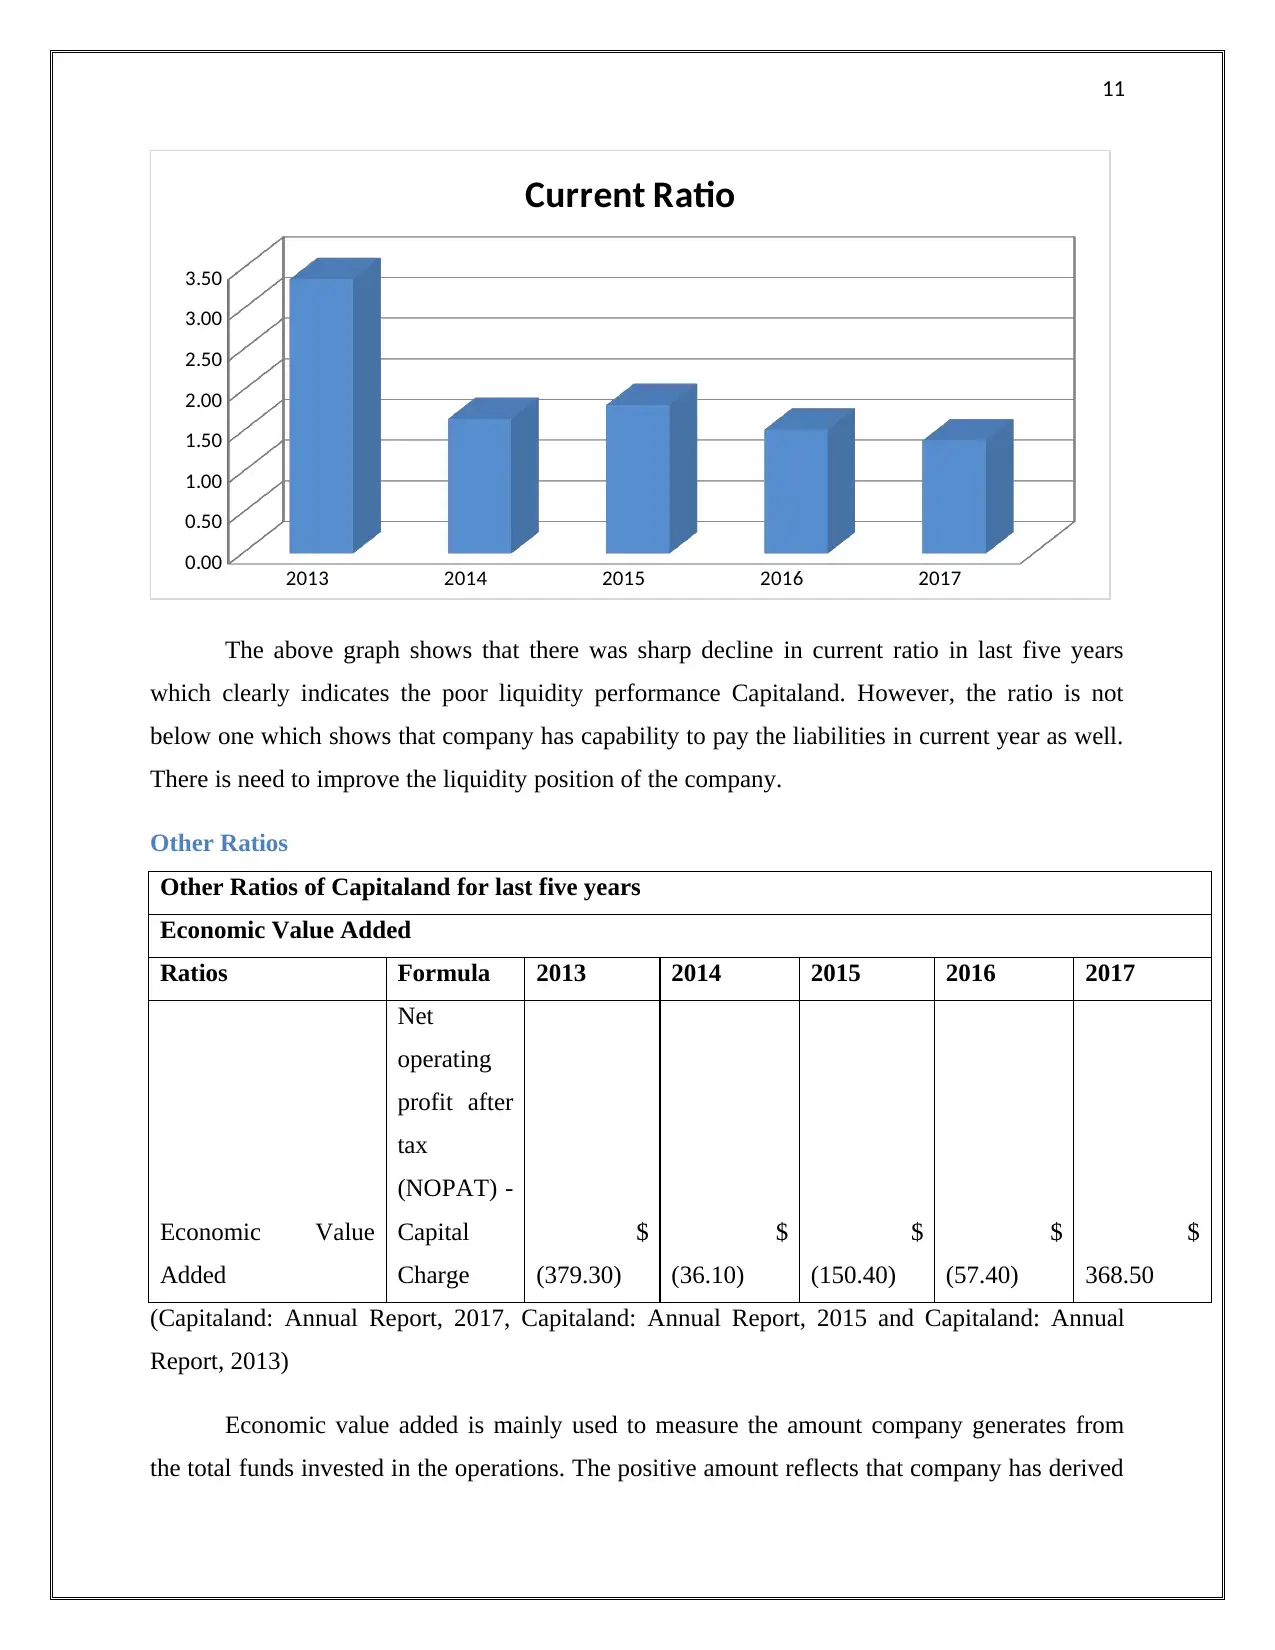
2013 2014 2015 2016 2017
0.00
0.50
1.00
1.50
2.00
2.50
3.00
3.50
Current Ratio
The above graph shows that there was sharp decline in current ratio in last five years
which clearly indicates the poor liquidity performance Capitaland. However, the ratio is not
below one which shows that company has capability to pay the liabilities in current year as well.
There is need to improve the liquidity position of the company.
Other Ratios
Other Ratios of Capitaland for last five years
Economic Value Added
Ratios Formula 2013 2014 2015 2016 2017
Economic Value
Added
Net
operating
profit after
tax
(NOPAT) -
Capital
Charge
$
(379.30)
$
(36.10)
$
(150.40)
$
(57.40)
$
368.50
(Capitaland: Annual Report, 2017, Capitaland: Annual Report, 2015 and Capitaland: Annual
Report, 2013)
Economic value added is mainly used to measure the amount company generates from
the total funds invested in the operations. The positive amount reflects that company has derived
12
some return for their shareholders while negative EVA indicates poor performance of the
company (Deegan, 2013). From year 2013 to 2016, Capitaland has negative EVA while in year
2017 it was positive $368.50 million which shows a great improvement in the financial
performance of the company.
Section B
Part 1: Critical Evaluation of Corporate Governance Compliance
CapitaLand Limited has placed high emphasis on attaining the highest standards of
corporate governance and thus continually seeking the ways for its regular improvement. The
company is focused on complying with the principle of the Code of Corporate Governance for
promoting integrity and transparency in its overall business activities. The Board of Directors is
responsible for developing the policies in relation to corporate governance framework of the
firm. The framework needs to be followed by the business managers and employees for
enquiring that they carry out their roles and responsibilities in an ethical manner. The company
has disclosed the relevant information regarding its Board, remuneration, accountability and
audit and shareholders’ rights in its investor section under the corporate governance (CapitaLand
Limited, 2017).
The development of an effective corporate governance framework within the company
has positive impacted its brand reputation. It is listed under the Singapore Governance and
Transparency Index (SGTI) for having the presence of a well-governed and transparency
corporate governance system. SGTI assess companies in relation to their corporate governance
disclosures and practices by examining the transparency of their business policies and financial
announcements. The presence of effective corporate governance policies has enabled the
company in achieving trust and confidence among wide range of its stakeholders. The key
stakeholders of the company include employees, customers, business associated, builders,
suppliers and the local community (Meixian, 2018). The achievement of trust in the wide range
of its stakeholders has enabled in promoting the growth and development of the company by
gaining large capital inflows from the investors. The effective governance policy has enabled the
company to disclose credible information to the shareholders, analysts and the media. It provides
regular updates o its strategies, financial performance and operations through adequate
announcements and press releases (CapitaLand Limited: Global Sustainability Report, 2017).
⊘ This is a preview!⊘
Do you want full access?
Subscribe today to unlock all pages.
Trusted by 1+ million students worldwide
1 out of 15
Related Documents


Your All-in-One AI-Powered Toolkit for Academic Success.
+13062052269
info@desklib.com
Available 24*7 on WhatsApp / Email
![[object Object]](/_next/static/media/star-bottom.7253800d.svg)
Unlock your academic potential
Copyright © 2020–2026 A2Z Services. All Rights Reserved. Developed and managed by ZUCOL.