Financial Analysis: CAPM Model for UK Sectors Report
VerifiedAdded on 2022/08/12
|14
|3300
|18
Report
AI Summary
This report presents a comprehensive analysis of the Capital Asset Pricing Model (CAPM), a financial model used to determine the required rate of return for an asset. The study investigates the performance of twelve companies from three key sectors in the United Kingdom: retail, energy, and healthcare. The report begins with an introduction to the CAPM model, followed by an analysis of the significance of Beta, t-statistics, and R-squared values for each company. The analysis includes time-series regression for each company, verifying the existence of a significant Beta. The report then discusses the merits and demerits of CAPM analysis, including its simplicity and its limitations. Furthermore, the report examines the sensitivity of the results to sector characteristics and provides a discussion of the findings. The report concludes with a summary of the key findings and their implications for financial decision-making, providing insights into the application of CAPM in evaluating investment opportunities within the selected sectors. The report includes the results of the regression analysis, beta values, t-statistics, and R-squared values. The report also includes a discussion of the merits and demerits of CAPM analysis and whether the results are sensitive to sector characteristics. The report uses the data from 12 companies selected from retail, energy, and healthcare sectors.

Running head: STATISTICS
Statistics
Name of the Student
Name of the University
Course ID
Statistics
Name of the Student
Name of the University
Course ID
Paraphrase This Document
Need a fresh take? Get an instant paraphrase of this document with our AI Paraphraser
1STATISTICS
Table of Contents
Introduction......................................................................................................................................2
Significance of Beta.........................................................................................................................2
t statistics and R square....................................................................................................................4
Discussion and merits and demerits of CAPM analysis..................................................................5
Merits and Demerits of CAPM....................................................................................................9
Sensitivity to sector characteristics..................................................................................................9
Conclusion.....................................................................................................................................10
References......................................................................................................................................12
2STATISTICS
Introduction
The business report is prepared to test the Capital Asset Pricing Model (CAPM). The
CAPM model is widely used in finance for determining a suitable required return rate of an asset
in order to take decision regarding adding the assets to a portfolio (Michalkova and Kramarova
2017). CAPM model has been developed for 12 companies selected from three different sector
of United Kingdom. The three chosen sectors are retail, energy and health care. The sectors have
been selected by taking into consideration its economic contribution to the economy. The retail
sector of UK is the largest private sector employing nearly three million workers (Corbet and
McMullan 2018). The sector accounts almost 5% of total value added of the economy. Another
important sector in the economy is Energy sector. The sector accounts 2.9 percent of UK’s GDP
and responsible for 6.3% of direct employment. 33.6% of total industrial investment has gone to
energy industry (Assets.publishing.service.gov.uk. 2018) The health care sector is another
important sector of the UK economy making significant contribution to aggregate output and
employment. The biopharmaceutical industry is one major employers of high valued jobs in the
economy employing nearly 63000 employees (Abpi.org.uk. 2020).
Significance of Beta
The model used to compute beta value in the CAPM model is
Y =α+ βX
Y: Dependent variable: Company return
α: Constant
β: Slope
⊘ This is a preview!⊘
Do you want full access?
Subscribe today to unlock all pages.
Trusted by 1+ million students worldwide
3STATISTICS
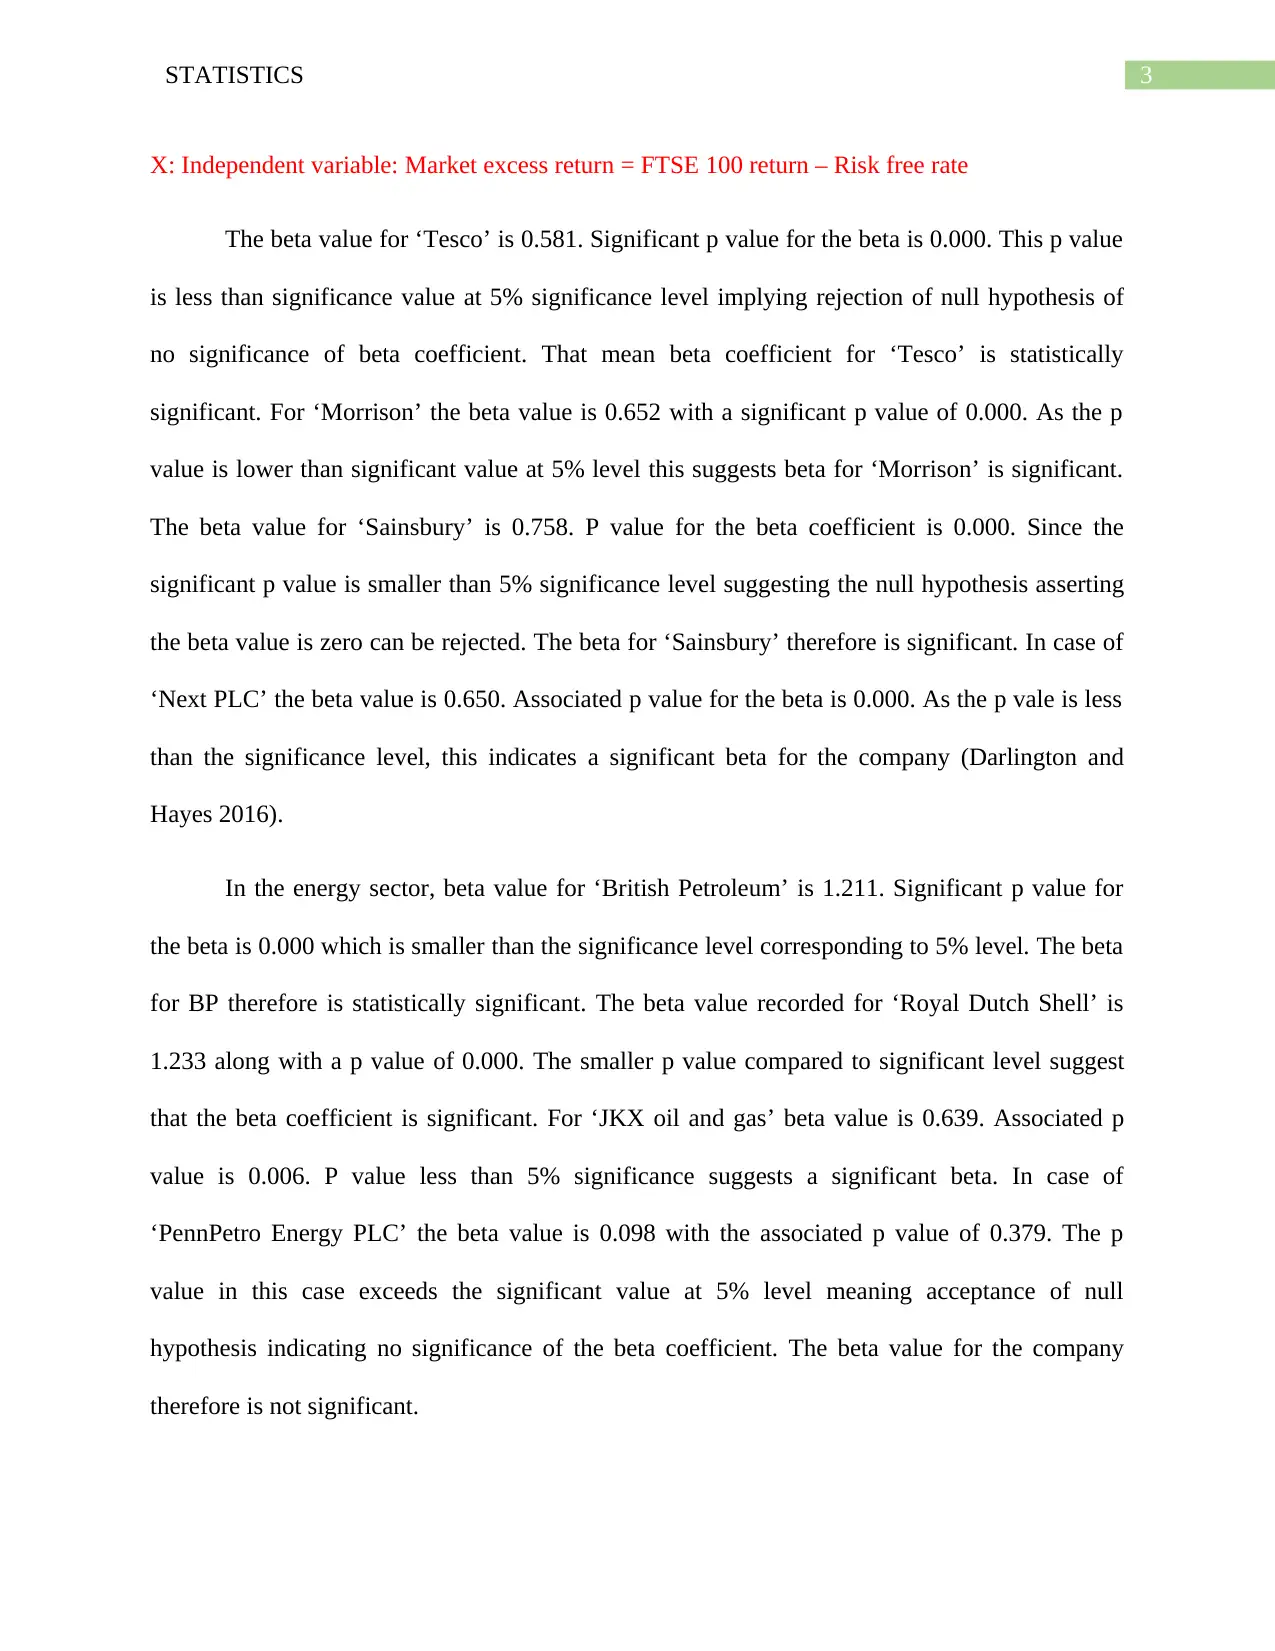
X: Independent variable: Market excess return = FTSE 100 return – Risk free rate
The beta value for ‘Tesco’ is 0.581. Significant p value for the beta is 0.000. This p value
is less than significance value at 5% significance level implying rejection of null hypothesis of
no significance of beta coefficient. That mean beta coefficient for ‘Tesco’ is statistically
significant. For ‘Morrison’ the beta value is 0.652 with a significant p value of 0.000. As the p
value is lower than significant value at 5% level this suggests beta for ‘Morrison’ is significant.
The beta value for ‘Sainsbury’ is 0.758. P value for the beta coefficient is 0.000. Since the
significant p value is smaller than 5% significance level suggesting the null hypothesis asserting
the beta value is zero can be rejected. The beta for ‘Sainsbury’ therefore is significant. In case of
‘Next PLC’ the beta value is 0.650. Associated p value for the beta is 0.000. As the p vale is less
than the significance level, this indicates a significant beta for the company (Darlington and
Hayes 2016).
In the energy sector, beta value for ‘British Petroleum’ is 1.211. Significant p value for
the beta is 0.000 which is smaller than the significance level corresponding to 5% level. The beta
for BP therefore is statistically significant. The beta value recorded for ‘Royal Dutch Shell’ is
1.233 along with a p value of 0.000. The smaller p value compared to significant level suggest
that the beta coefficient is significant. For ‘JKX oil and gas’ beta value is 0.639. Associated p
value is 0.006. P value less than 5% significance suggests a significant beta. In case of
‘PennPetro Energy PLC’ the beta value is 0.098 with the associated p value of 0.379. The p
value in this case exceeds the significant value at 5% level meaning acceptance of null
hypothesis indicating no significance of the beta coefficient. The beta value for the company
therefore is not significant.
Paraphrase This Document
Need a fresh take? Get an instant paraphrase of this document with our AI Paraphraser
4STATISTICS
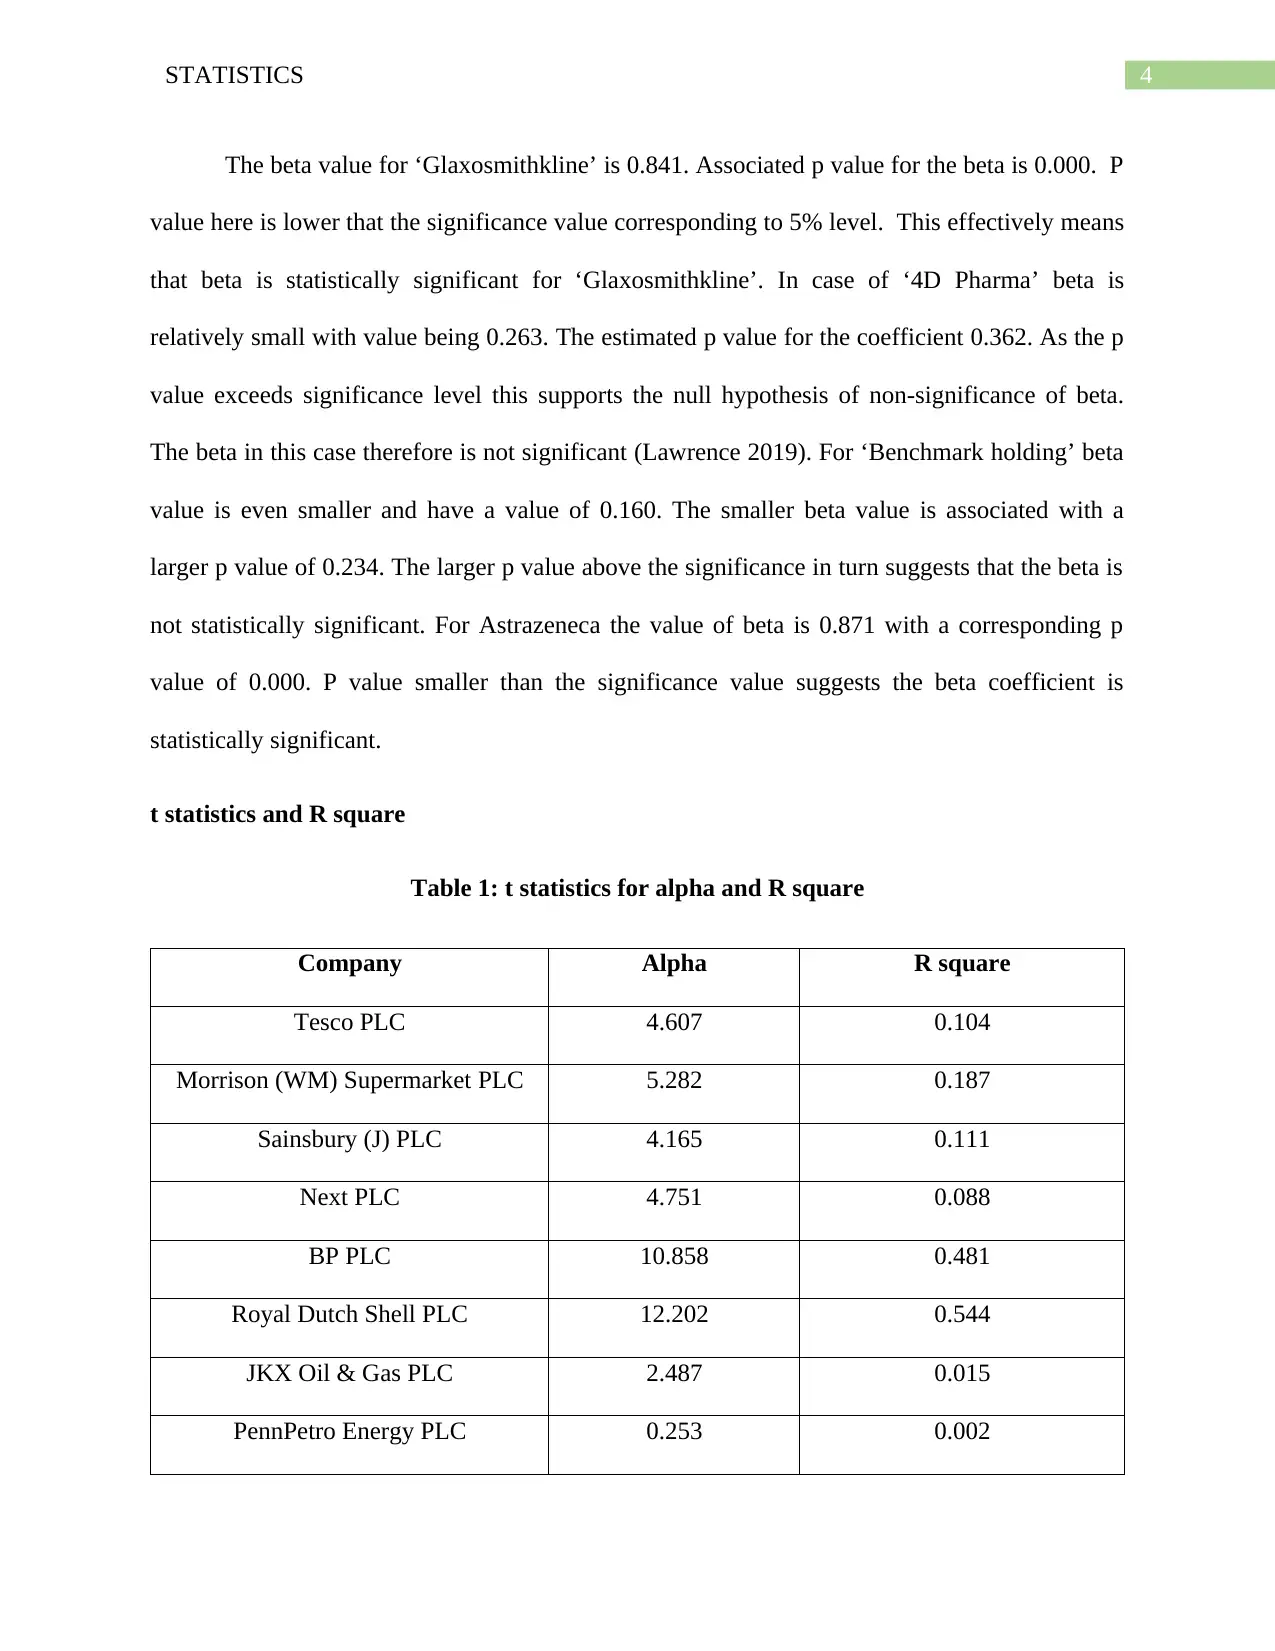
The beta value for ‘Glaxosmithkline’ is 0.841. Associated p value for the beta is 0.000. P
value here is lower that the significance value corresponding to 5% level. This effectively means
that beta is statistically significant for ‘Glaxosmithkline’. In case of ‘4D Pharma’ beta is
relatively small with value being 0.263. The estimated p value for the coefficient 0.362. As the p
value exceeds significance level this supports the null hypothesis of non-significance of beta.
The beta in this case therefore is not significant (Lawrence 2019). For ‘Benchmark holding’ beta
value is even smaller and have a value of 0.160. The smaller beta value is associated with a
larger p value of 0.234. The larger p value above the significance in turn suggests that the beta is
not statistically significant. For Astrazeneca the value of beta is 0.871 with a corresponding p
value of 0.000. P value smaller than the significance value suggests the beta coefficient is
statistically significant.
t statistics and R square
Table 1: t statistics for alpha and R square
Company Alpha R square
Tesco PLC 4.607 0.104
Morrison (WM) Supermarket PLC 5.282 0.187
Sainsbury (J) PLC 4.165 0.111
Next PLC 4.751 0.088
BP PLC 10.858 0.481
Royal Dutch Shell PLC 12.202 0.544
JKX Oil & Gas PLC 2.487 0.015
PennPetro Energy PLC 0.253 0.002
5STATISTICS
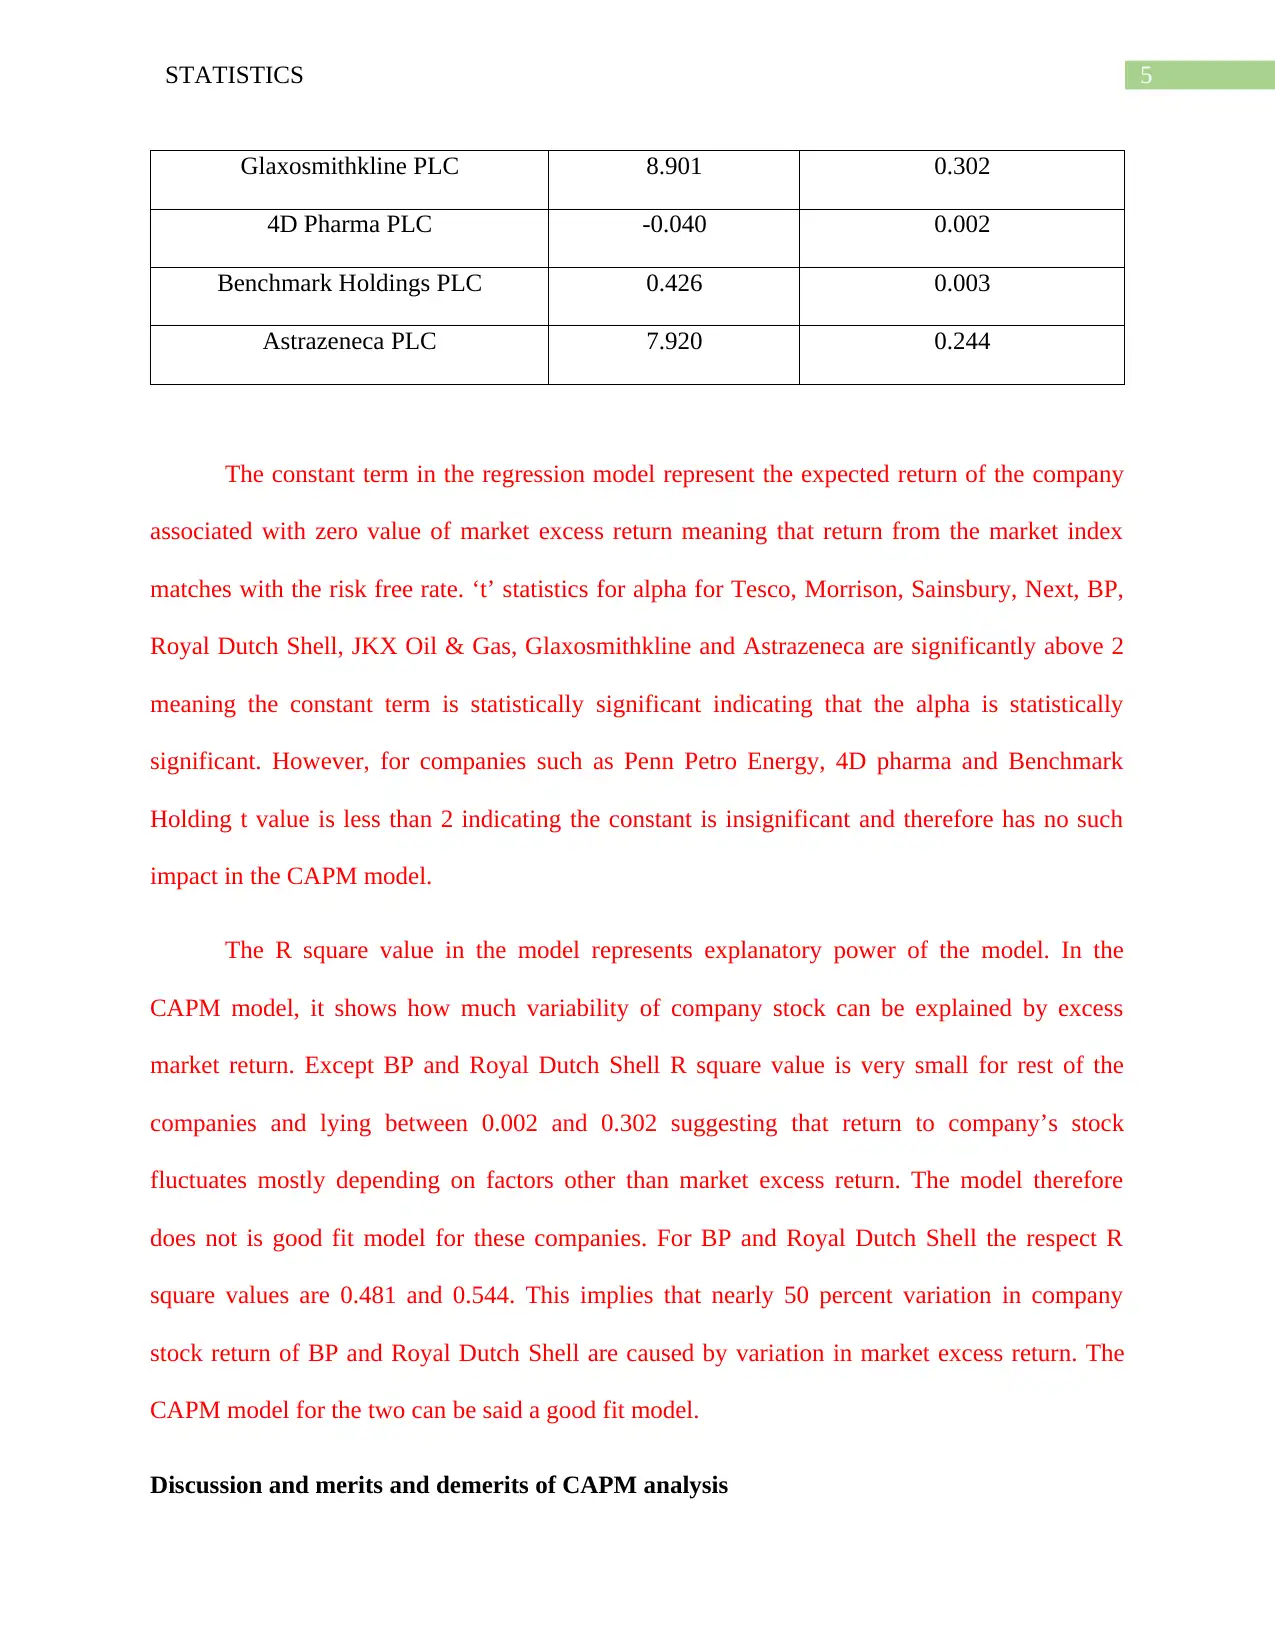
Glaxosmithkline PLC 8.901 0.302
4D Pharma PLC -0.040 0.002
Benchmark Holdings PLC 0.426 0.003
Astrazeneca PLC 7.920 0.244
The constant term in the regression model represent the expected return of the company
associated with zero value of market excess return meaning that return from the market index
matches with the risk free rate. ‘t’ statistics for alpha for Tesco, Morrison, Sainsbury, Next, BP,
Royal Dutch Shell, JKX Oil & Gas, Glaxosmithkline and Astrazeneca are significantly above 2
meaning the constant term is statistically significant indicating that the alpha is statistically
significant. However, for companies such as Penn Petro Energy, 4D pharma and Benchmark
Holding t value is less than 2 indicating the constant is insignificant and therefore has no such
impact in the CAPM model.
The R square value in the model represents explanatory power of the model. In the
CAPM model, it shows how much variability of company stock can be explained by excess
market return. Except BP and Royal Dutch Shell R square value is very small for rest of the
companies and lying between 0.002 and 0.302 suggesting that return to company’s stock
fluctuates mostly depending on factors other than market excess return. The model therefore
does not is good fit model for these companies. For BP and Royal Dutch Shell the respect R
square values are 0.481 and 0.544. This implies that nearly 50 percent variation in company
stock return of BP and Royal Dutch Shell are caused by variation in market excess return. The
CAPM model for the two can be said a good fit model.
Discussion and merits and demerits of CAPM analysis
⊘ This is a preview!⊘
Do you want full access?
Subscribe today to unlock all pages.
Trusted by 1+ million students worldwide
6STATISTICS
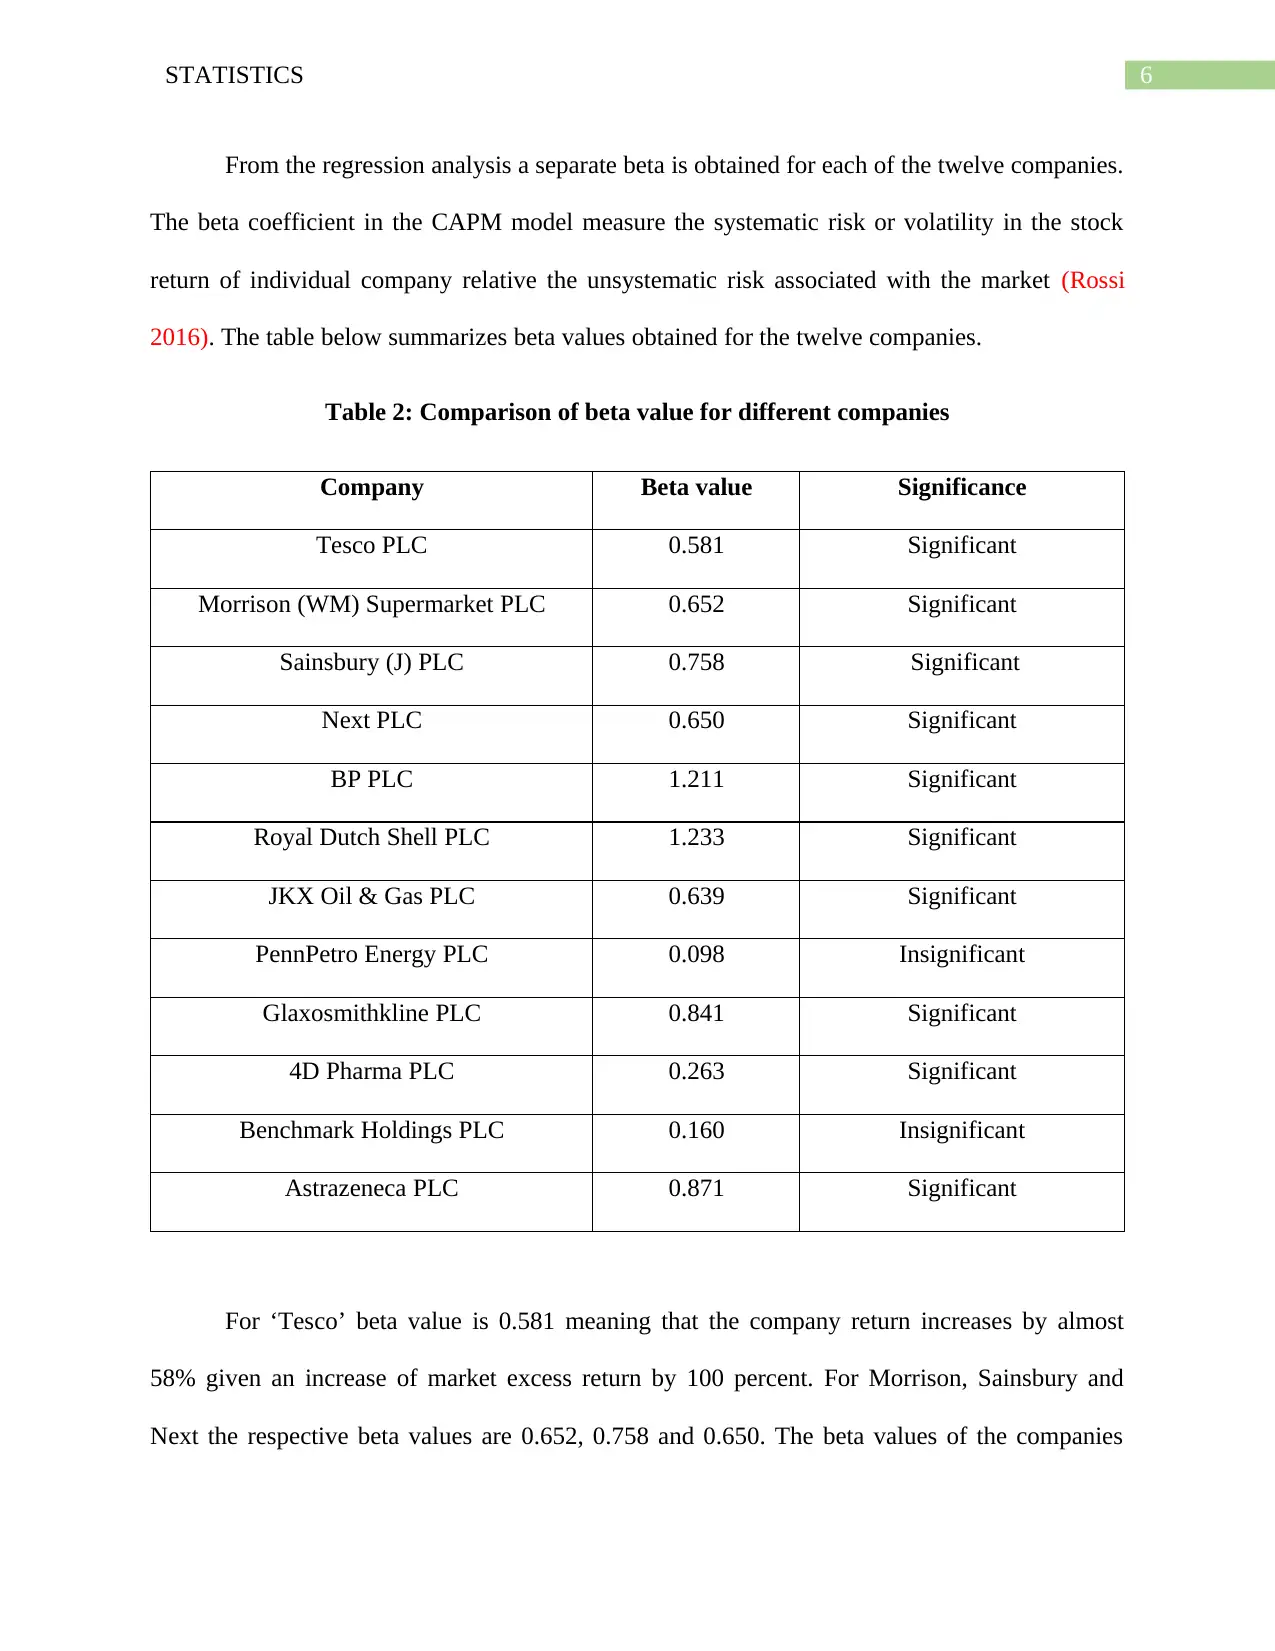
From the regression analysis a separate beta is obtained for each of the twelve companies.
The beta coefficient in the CAPM model measure the systematic risk or volatility in the stock
return of individual company relative the unsystematic risk associated with the market (Rossi
2016). The table below summarizes beta values obtained for the twelve companies.
Table 2: Comparison of beta value for different companies
Company Beta value Significance
Tesco PLC 0.581 Significant
Morrison (WM) Supermarket PLC 0.652 Significant
Sainsbury (J) PLC 0.758 Significant
Next PLC 0.650 Significant
BP PLC 1.211 Significant
Royal Dutch Shell PLC 1.233 Significant
JKX Oil & Gas PLC 0.639 Significant
PennPetro Energy PLC 0.098 Insignificant
Glaxosmithkline PLC 0.841 Significant
4D Pharma PLC 0.263 Significant
Benchmark Holdings PLC 0.160 Insignificant
Astrazeneca PLC 0.871 Significant
For ‘Tesco’ beta value is 0.581 meaning that the company return increases by almost
58% given an increase of market excess return by 100 percent. For Morrison, Sainsbury and
Next the respective beta values are 0.652, 0.758 and 0.650. The beta values of the companies
Paraphrase This Document
Need a fresh take? Get an instant paraphrase of this document with our AI Paraphraser
7STATISTICS
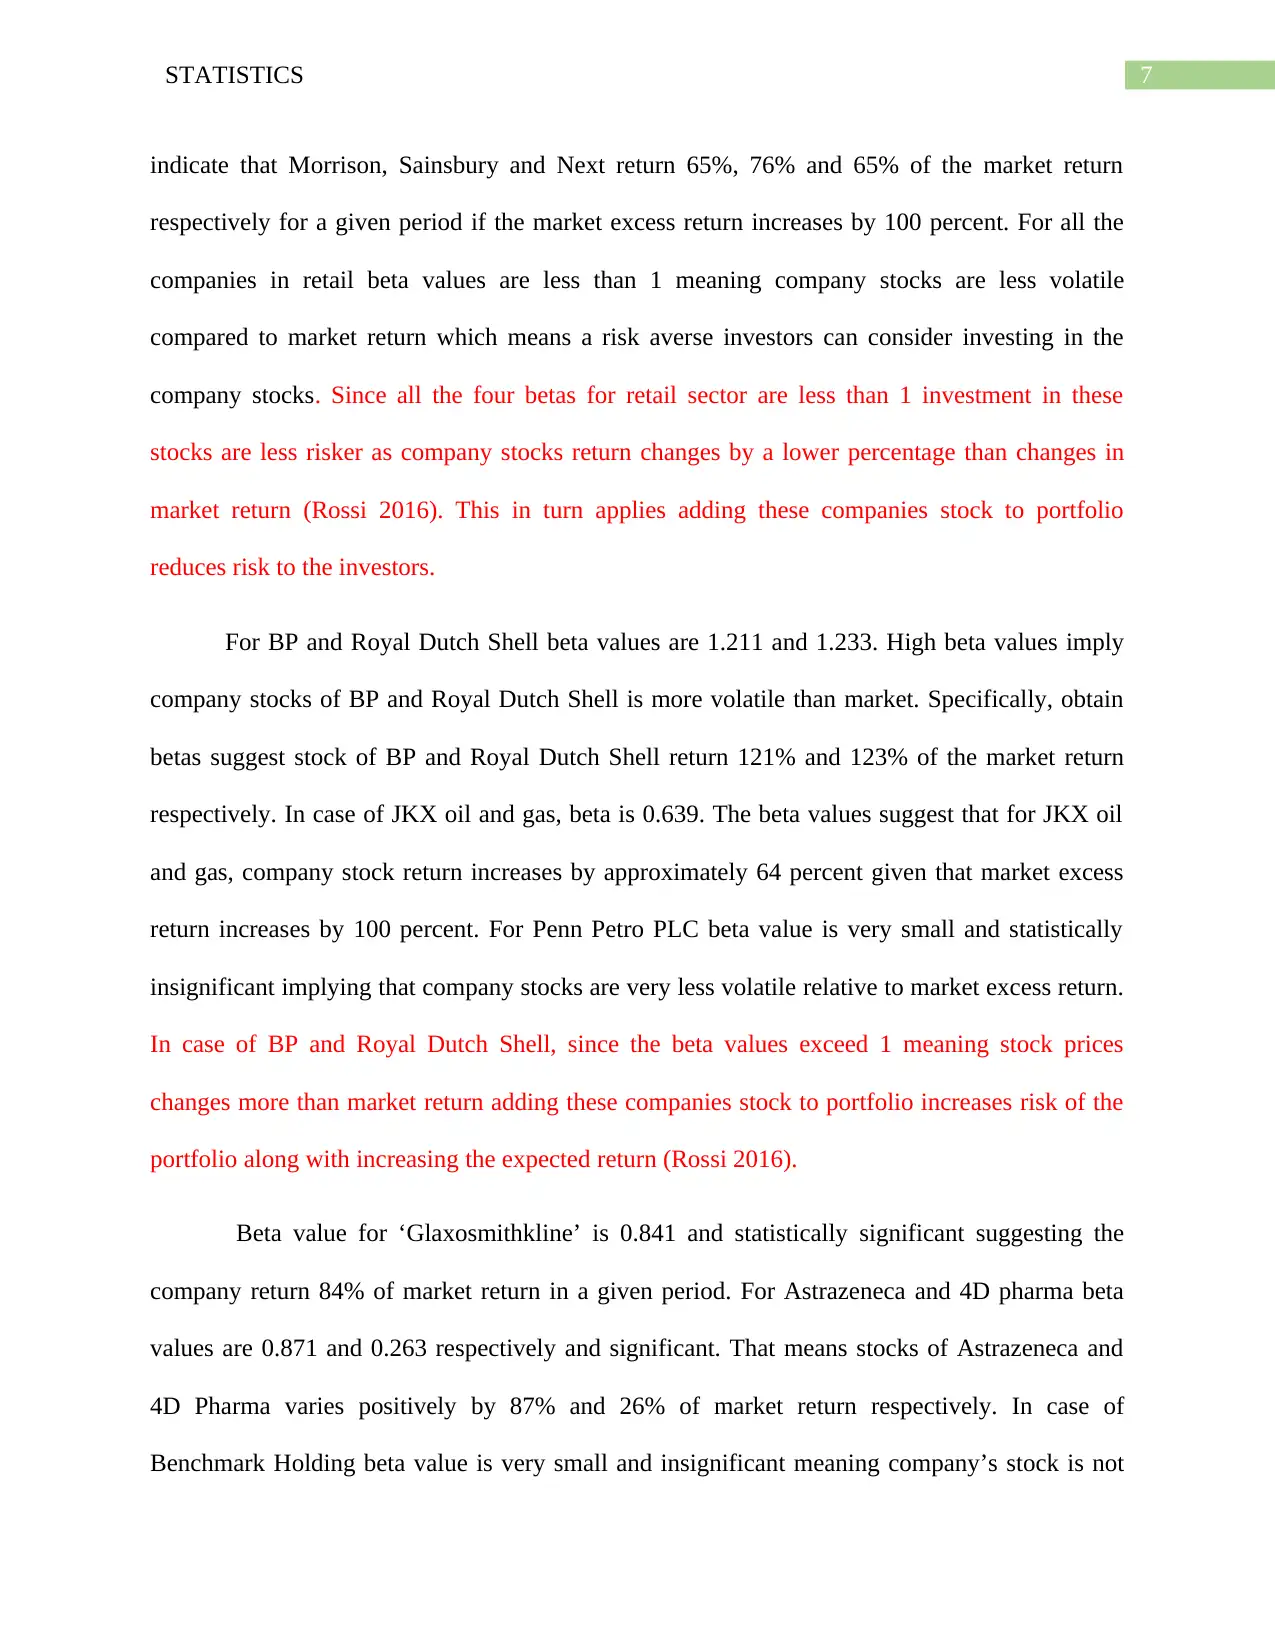
indicate that Morrison, Sainsbury and Next return 65%, 76% and 65% of the market return
respectively for a given period if the market excess return increases by 100 percent. For all the
companies in retail beta values are less than 1 meaning company stocks are less volatile
compared to market return which means a risk averse investors can consider investing in the
company stocks. Since all the four betas for retail sector are less than 1 investment in these
stocks are less risker as company stocks return changes by a lower percentage than changes in
market return (Rossi 2016). This in turn applies adding these companies stock to portfolio
reduces risk to the investors.
For BP and Royal Dutch Shell beta values are 1.211 and 1.233. High beta values imply
company stocks of BP and Royal Dutch Shell is more volatile than market. Specifically, obtain
betas suggest stock of BP and Royal Dutch Shell return 121% and 123% of the market return
respectively. In case of JKX oil and gas, beta is 0.639. The beta values suggest that for JKX oil
and gas, company stock return increases by approximately 64 percent given that market excess
return increases by 100 percent. For Penn Petro PLC beta value is very small and statistically
insignificant implying that company stocks are very less volatile relative to market excess return.
In case of BP and Royal Dutch Shell, since the beta values exceed 1 meaning stock prices
changes more than market return adding these companies stock to portfolio increases risk of the
portfolio along with increasing the expected return (Rossi 2016).
Beta value for ‘Glaxosmithkline’ is 0.841 and statistically significant suggesting the
company return 84% of market return in a given period. For Astrazeneca and 4D pharma beta
values are 0.871 and 0.263 respectively and significant. That means stocks of Astrazeneca and
4D Pharma varies positively by 87% and 26% of market return respectively. In case of
Benchmark Holding beta value is very small and insignificant meaning company’s stock is not
8STATISTICS
much sensitive to market volatility. All the beta values are less than 1, meaning companies
stocks are less volatile than the market return meaning if the companies’ stock are added to
portfolio then it lowers the portfolio risk (Rossi 2016).
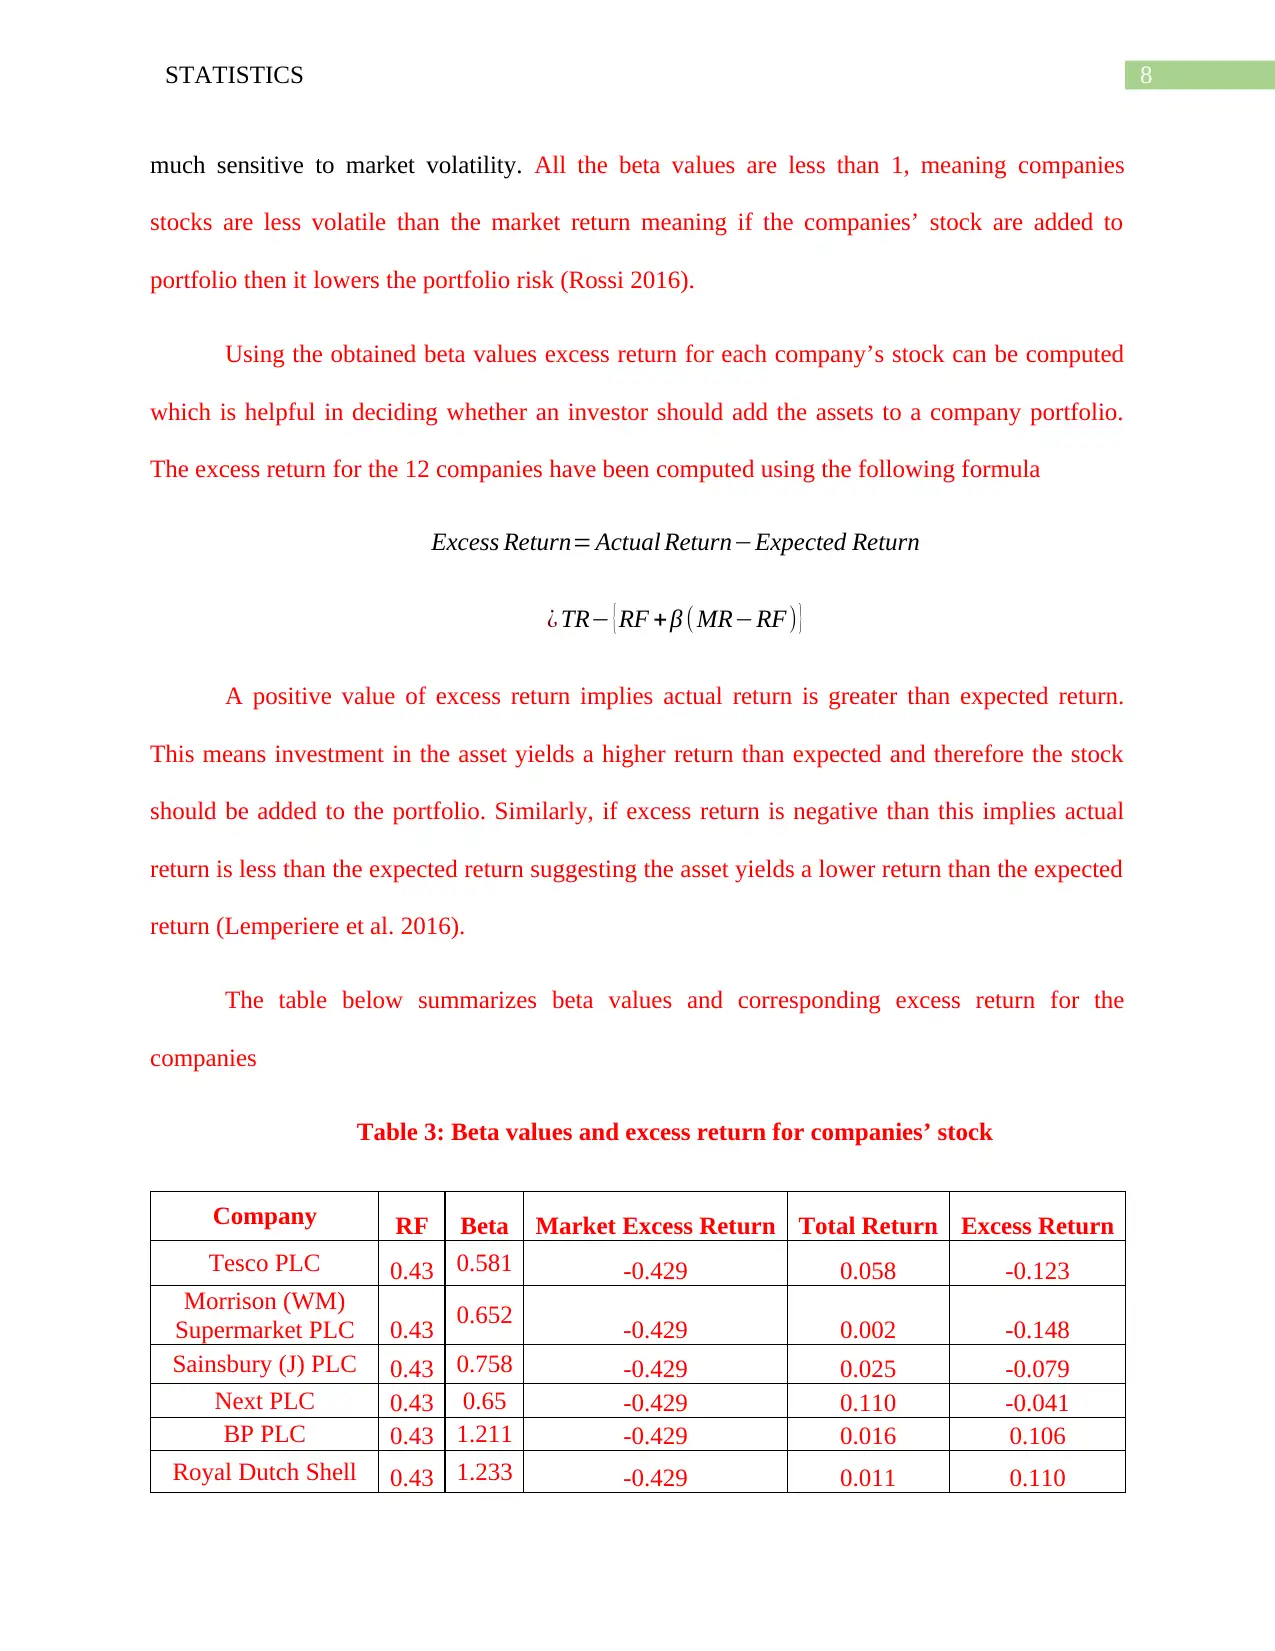
Using the obtained beta values excess return for each company’s stock can be computed
which is helpful in deciding whether an investor should add the assets to a company portfolio.
The excess return for the 12 companies have been computed using the following formula
Excess Return= Actual Return−Expected Return
¿ TR− { RF + β ( MR−RF) }
A positive value of excess return implies actual return is greater than expected return.
This means investment in the asset yields a higher return than expected and therefore the stock
should be added to the portfolio. Similarly, if excess return is negative than this implies actual
return is less than the expected return suggesting the asset yields a lower return than the expected
return (Lemperiere et al. 2016).
The table below summarizes beta values and corresponding excess return for the
companies
Table 3: Beta values and excess return for companies’ stock
Company RF Beta Market Excess Return Total Return Excess Return
Tesco PLC 0.43 0.581 -0.429 0.058 -0.123
Morrison (WM)
Supermarket PLC 0.43 0.652 -0.429 0.002 -0.148
Sainsbury (J) PLC 0.43 0.758 -0.429 0.025 -0.079
Next PLC 0.43 0.65 -0.429 0.110 -0.041
BP PLC 0.43 1.211 -0.429 0.016 0.106
Royal Dutch Shell 0.43 1.233 -0.429 0.011 0.110
much sensitive to market volatility. All the beta values are less than 1, meaning companies
stocks are less volatile than the market return meaning if the companies’ stock are added to
portfolio then it lowers the portfolio risk (Rossi 2016).
Using the obtained beta values excess return for each company’s stock can be computed
which is helpful in deciding whether an investor should add the assets to a company portfolio.
The excess return for the 12 companies have been computed using the following formula
Excess Return= Actual Return−Expected Return
¿ TR− { RF + β ( MR−RF) }
A positive value of excess return implies actual return is greater than expected return.
This means investment in the asset yields a higher return than expected and therefore the stock
should be added to the portfolio. Similarly, if excess return is negative than this implies actual
return is less than the expected return suggesting the asset yields a lower return than the expected
return (Lemperiere et al. 2016).
The table below summarizes beta values and corresponding excess return for the
companies
Table 3: Beta values and excess return for companies’ stock
Company RF Beta Market Excess Return Total Return Excess Return
Tesco PLC 0.43 0.581 -0.429 0.058 -0.123
Morrison (WM)
Supermarket PLC 0.43 0.652 -0.429 0.002 -0.148
Sainsbury (J) PLC 0.43 0.758 -0.429 0.025 -0.079
Next PLC 0.43 0.65 -0.429 0.110 -0.041
BP PLC 0.43 1.211 -0.429 0.016 0.106
Royal Dutch Shell 0.43 1.233 -0.429 0.011 0.110
⊘ This is a preview!⊘
Do you want full access?
Subscribe today to unlock all pages.
Trusted by 1+ million students worldwide
9STATISTICS
PLC
JKX Oil & Gas
PLC 0.43 0.639 -0.429 0.233 0.077
PennPetro Energy
PLC 0.43 0.098 -0.429 -0.017 -0.405
Glaxosmithkline
PLC 0.43 0.841 -0.429 0.086 0.017
4D Pharma PLC 0.43 0.263 -0.429 -0.123 -0.440
Benchmark
Holdings PLC 0.43 0.16 -0.429 -0.018 -0.380
Astrazeneca PLC 0.43 0.871 -0.429 0.103 0.047
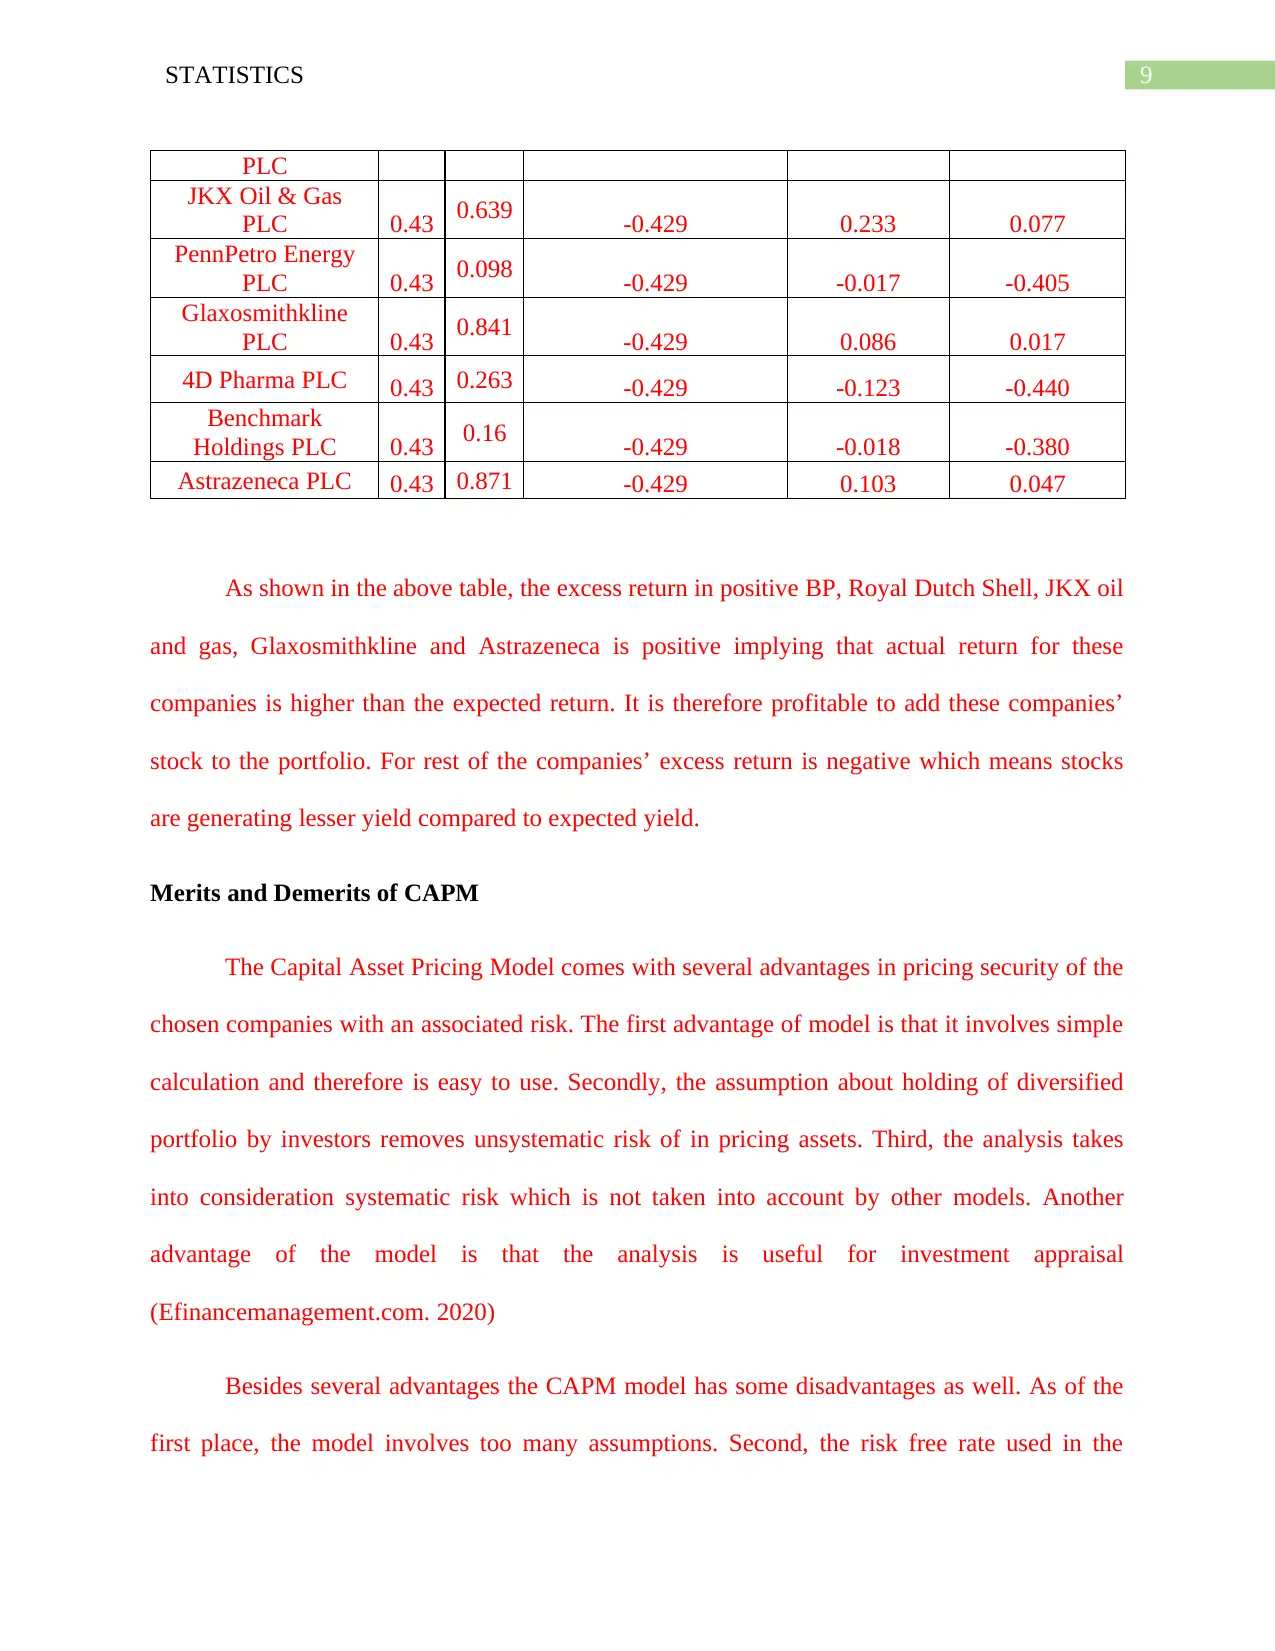
As shown in the above table, the excess return in positive BP, Royal Dutch Shell, JKX oil
and gas, Glaxosmithkline and Astrazeneca is positive implying that actual return for these
companies is higher than the expected return. It is therefore profitable to add these companies’
stock to the portfolio. For rest of the companies’ excess return is negative which means stocks
are generating lesser yield compared to expected yield.
Merits and Demerits of CAPM
The Capital Asset Pricing Model comes with several advantages in pricing security of the
chosen companies with an associated risk. The first advantage of model is that it involves simple
calculation and therefore is easy to use. Secondly, the assumption about holding of diversified
portfolio by investors removes unsystematic risk of in pricing assets. Third, the analysis takes
into consideration systematic risk which is not taken into account by other models. Another
advantage of the model is that the analysis is useful for investment appraisal
(Efinancemanagement.com. 2020)
Besides several advantages the CAPM model has some disadvantages as well. As of the
first place, the model involves too many assumptions. Second, the risk free rate used in the
PLC
JKX Oil & Gas
PLC 0.43 0.639 -0.429 0.233 0.077
PennPetro Energy
PLC 0.43 0.098 -0.429 -0.017 -0.405
Glaxosmithkline
PLC 0.43 0.841 -0.429 0.086 0.017
4D Pharma PLC 0.43 0.263 -0.429 -0.123 -0.440
Benchmark
Holdings PLC 0.43 0.16 -0.429 -0.018 -0.380
Astrazeneca PLC 0.43 0.871 -0.429 0.103 0.047
As shown in the above table, the excess return in positive BP, Royal Dutch Shell, JKX oil
and gas, Glaxosmithkline and Astrazeneca is positive implying that actual return for these
companies is higher than the expected return. It is therefore profitable to add these companies’
stock to the portfolio. For rest of the companies’ excess return is negative which means stocks
are generating lesser yield compared to expected yield.
Merits and Demerits of CAPM
The Capital Asset Pricing Model comes with several advantages in pricing security of the
chosen companies with an associated risk. The first advantage of model is that it involves simple
calculation and therefore is easy to use. Secondly, the assumption about holding of diversified
portfolio by investors removes unsystematic risk of in pricing assets. Third, the analysis takes
into consideration systematic risk which is not taken into account by other models. Another
advantage of the model is that the analysis is useful for investment appraisal
(Efinancemanagement.com. 2020)
Besides several advantages the CAPM model has some disadvantages as well. As of the
first place, the model involves too many assumptions. Second, the risk free rate used in the
Paraphrase This Document
Need a fresh take? Get an instant paraphrase of this document with our AI Paraphraser
10STATISTICS
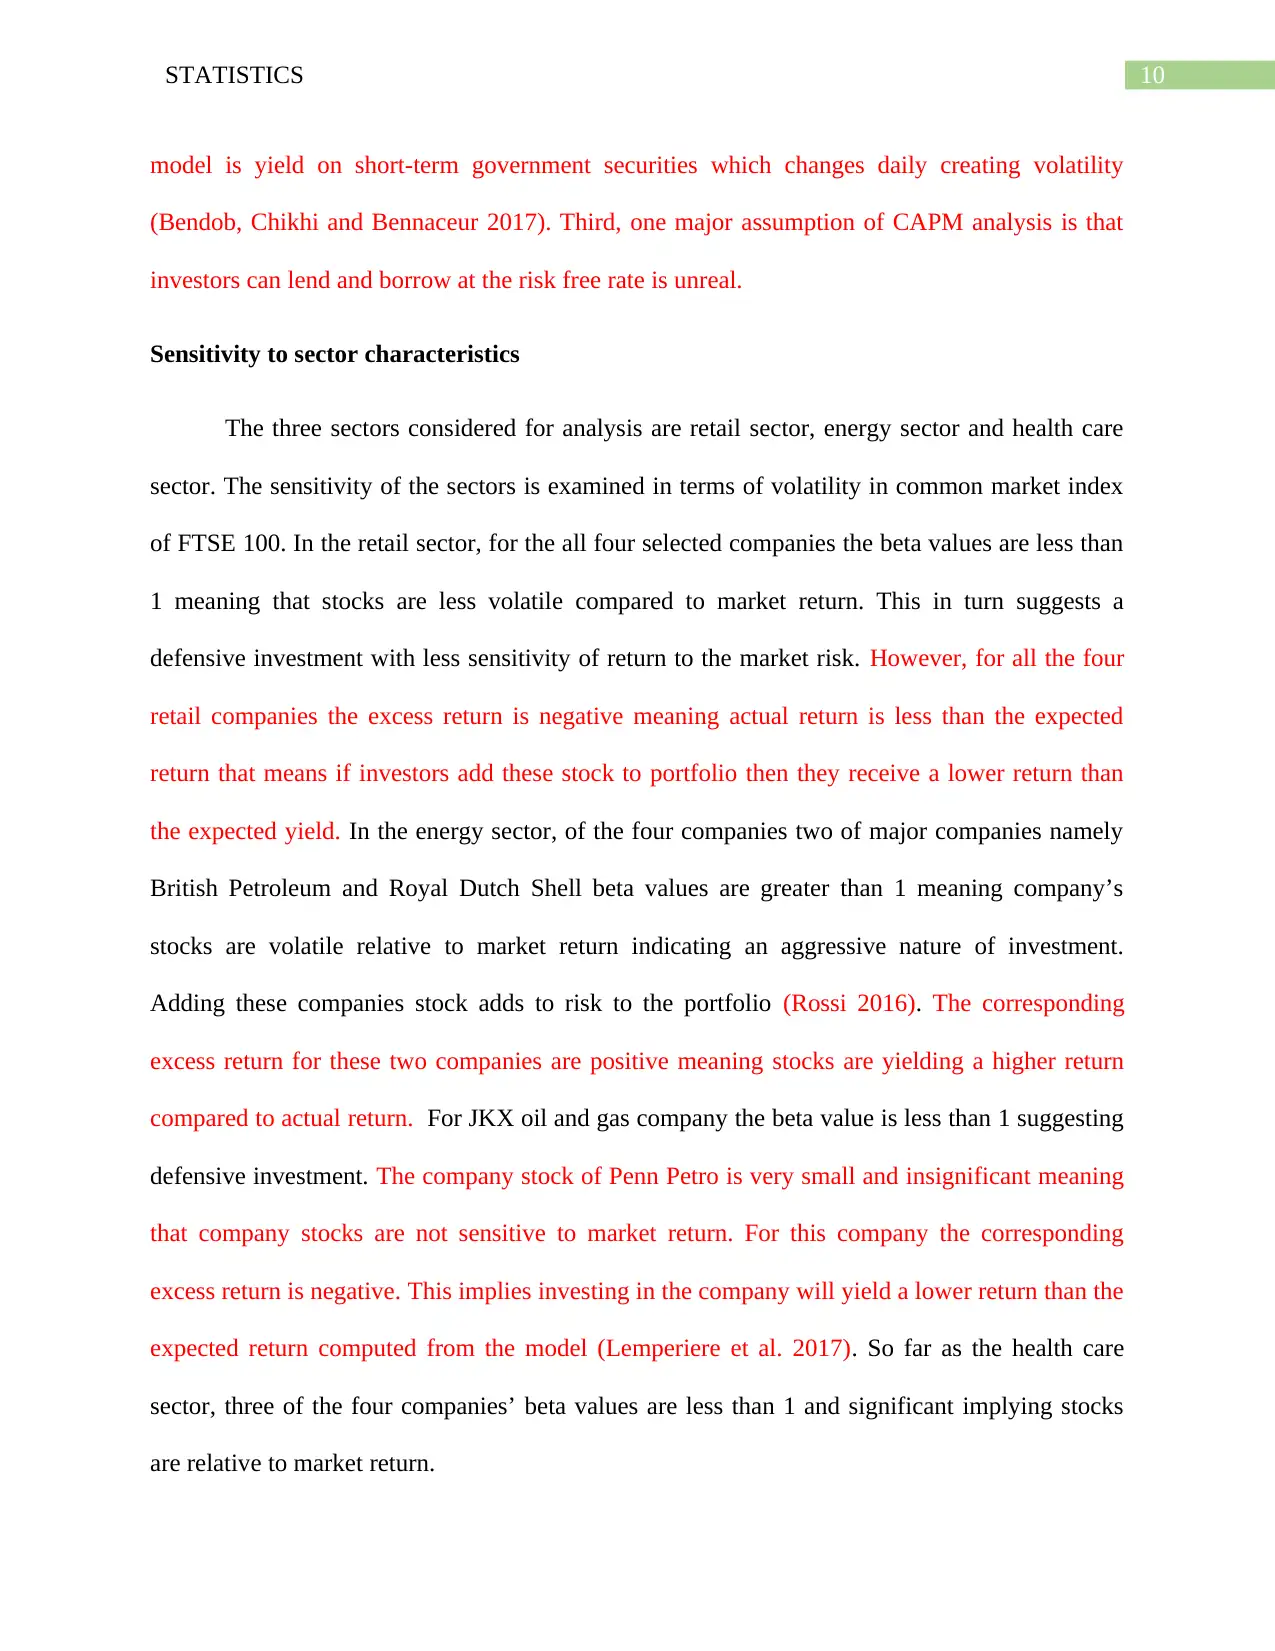
model is yield on short-term government securities which changes daily creating volatility
(Bendob, Chikhi and Bennaceur 2017). Third, one major assumption of CAPM analysis is that
investors can lend and borrow at the risk free rate is unreal.
Sensitivity to sector characteristics
The three sectors considered for analysis are retail sector, energy sector and health care
sector. The sensitivity of the sectors is examined in terms of volatility in common market index
of FTSE 100. In the retail sector, for the all four selected companies the beta values are less than
1 meaning that stocks are less volatile compared to market return. This in turn suggests a
defensive investment with less sensitivity of return to the market risk. However, for all the four
retail companies the excess return is negative meaning actual return is less than the expected
return that means if investors add these stock to portfolio then they receive a lower return than
the expected yield. In the energy sector, of the four companies two of major companies namely
British Petroleum and Royal Dutch Shell beta values are greater than 1 meaning company’s
stocks are volatile relative to market return indicating an aggressive nature of investment.
Adding these companies stock adds to risk to the portfolio (Rossi 2016). The corresponding
excess return for these two companies are positive meaning stocks are yielding a higher return
compared to actual return. For JKX oil and gas company the beta value is less than 1 suggesting
defensive investment. The company stock of Penn Petro is very small and insignificant meaning
that company stocks are not sensitive to market return. For this company the corresponding
excess return is negative. This implies investing in the company will yield a lower return than the
expected return computed from the model (Lemperiere et al. 2017). So far as the health care
sector, three of the four companies’ beta values are less than 1 and significant implying stocks
are relative to market return.
11STATISTICS
Conclusion
The CAPM analysis helps to understand the risk associated with each of 12 companies’
stock in relation to market return. This analysis thus helps the investors to assess the risk
involved in the stock while deciding whether to add the assets to the portfolio. Of the twelve
companies only BP and Royal Dutch shell has beta values above 1 meaning stocks are highly
vulnerable to market risk. Only a risk lover investor can consider investing in these stocks as
adding these assets to the portfolio increases risk for the portfolio. For rest of the companies, beta
values are below 1 meaning adding stocks to the portfolio reduces risk and therefore risk-averse
investors can consider investment in these assets. In case of PennPetro Energy and Benchmark
Holding beta values are very small and statistically insignificant implying companies stock are
not very much sensitive to market return. Considering from the perspective of excess return
stocks of BP, Royal Dutch Shell, JKX oil and gas, Glaxosmithkline and Astrazeneca general an
actual yield above the expected yield and therefore is more attractive for investors.
⊘ This is a preview!⊘
Do you want full access?
Subscribe today to unlock all pages.
Trusted by 1+ million students worldwide
1 out of 14
Related Documents


Your All-in-One AI-Powered Toolkit for Academic Success.
+13062052269
info@desklib.com
Available 24*7 on WhatsApp / Email
![[object Object]](/_next/static/media/star-bottom.7253800d.svg)
Unlock your academic potential
Copyright © 2020–2026 A2Z Services. All Rights Reserved. Developed and managed by ZUCOL.