Capital Asset Pricing Model (CAPM) Theory Testing and Analysis Report
VerifiedAdded on 2020/01/15
|18
|3072
|254
Report
AI Summary
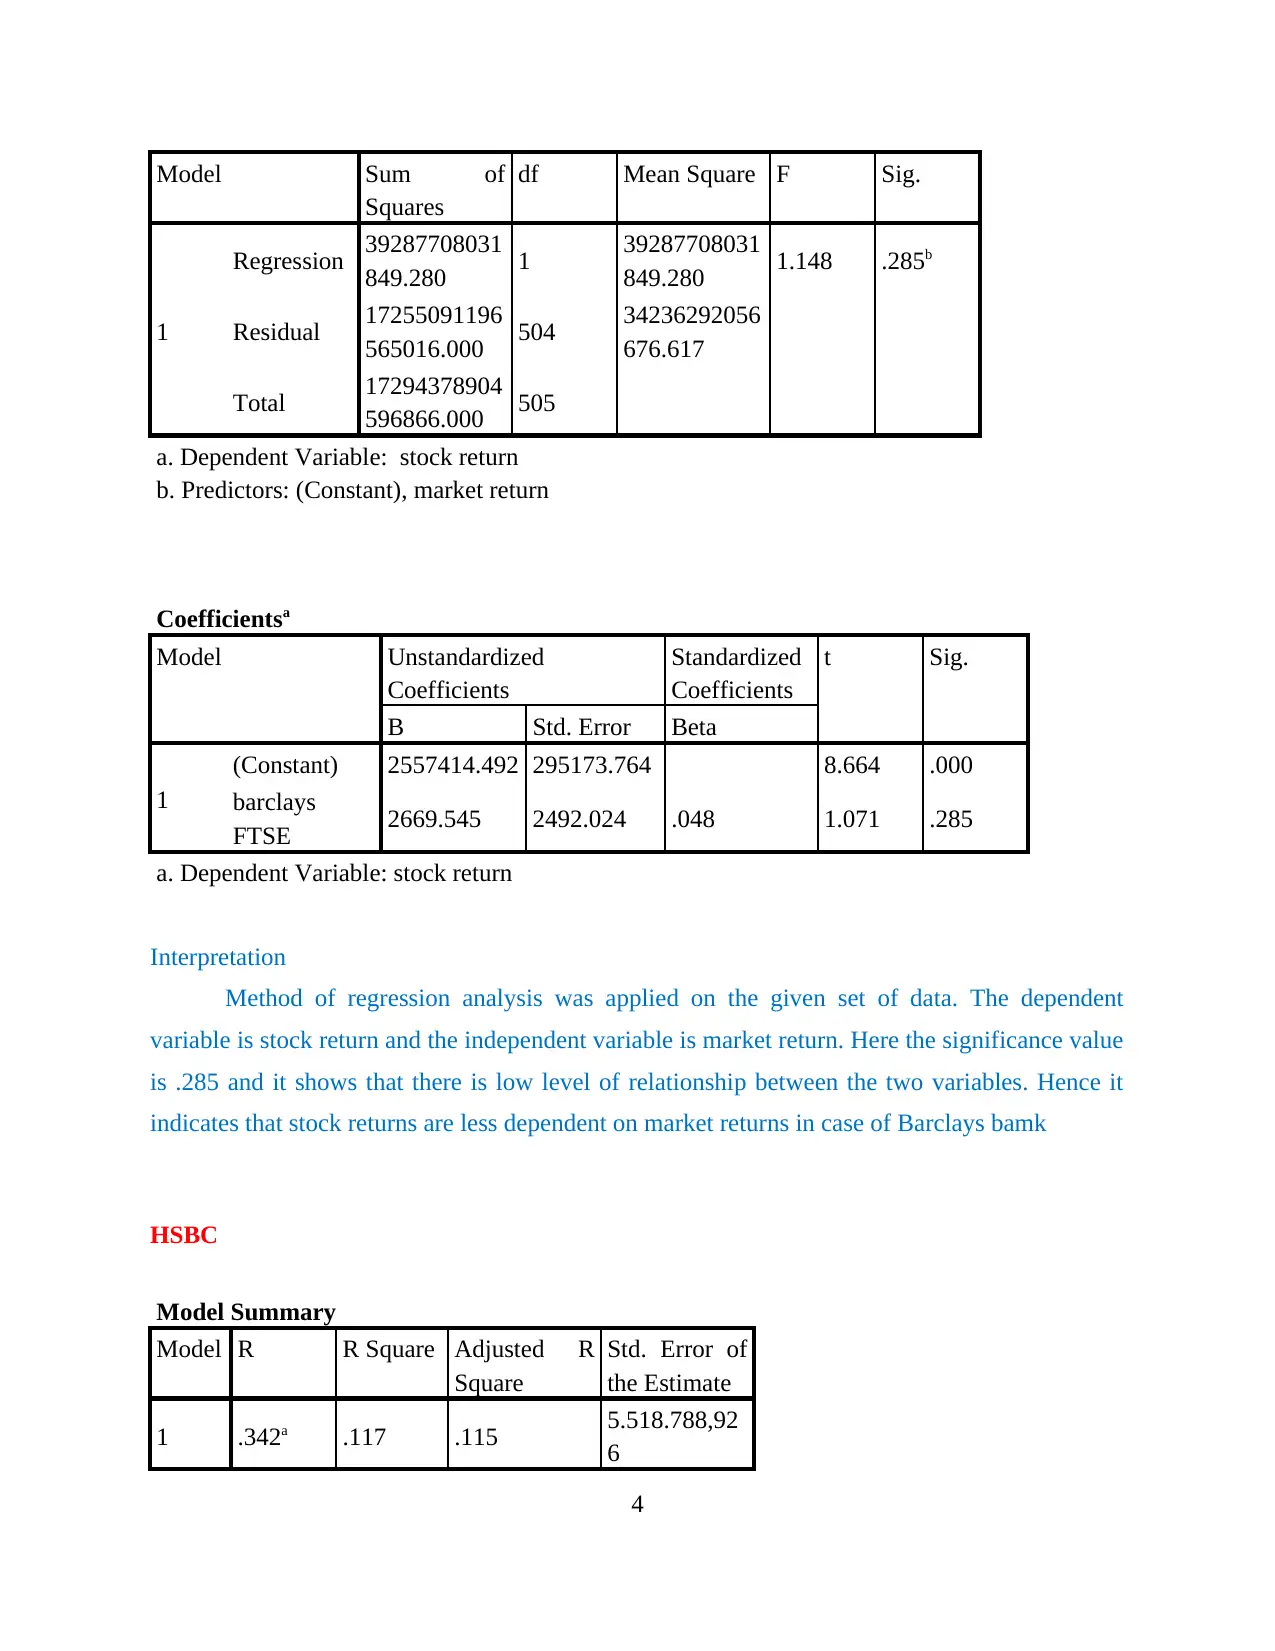
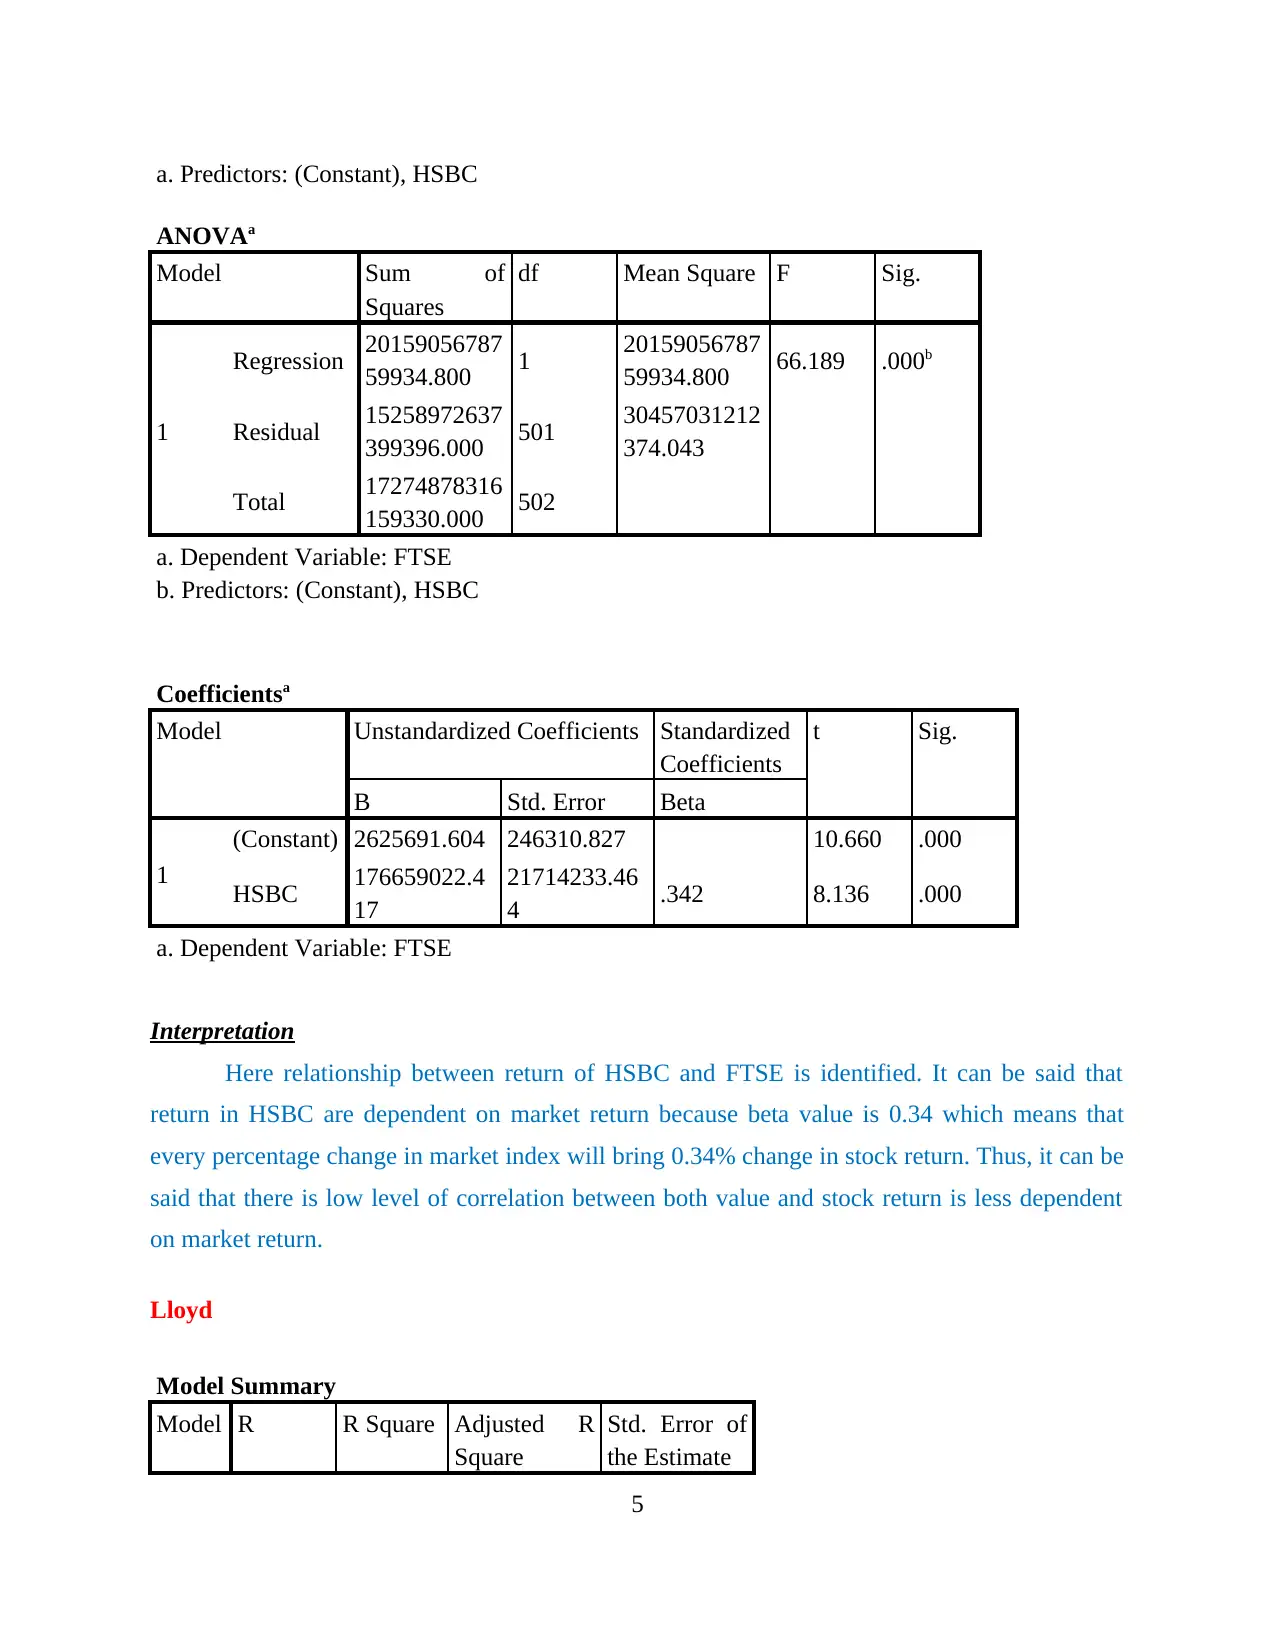
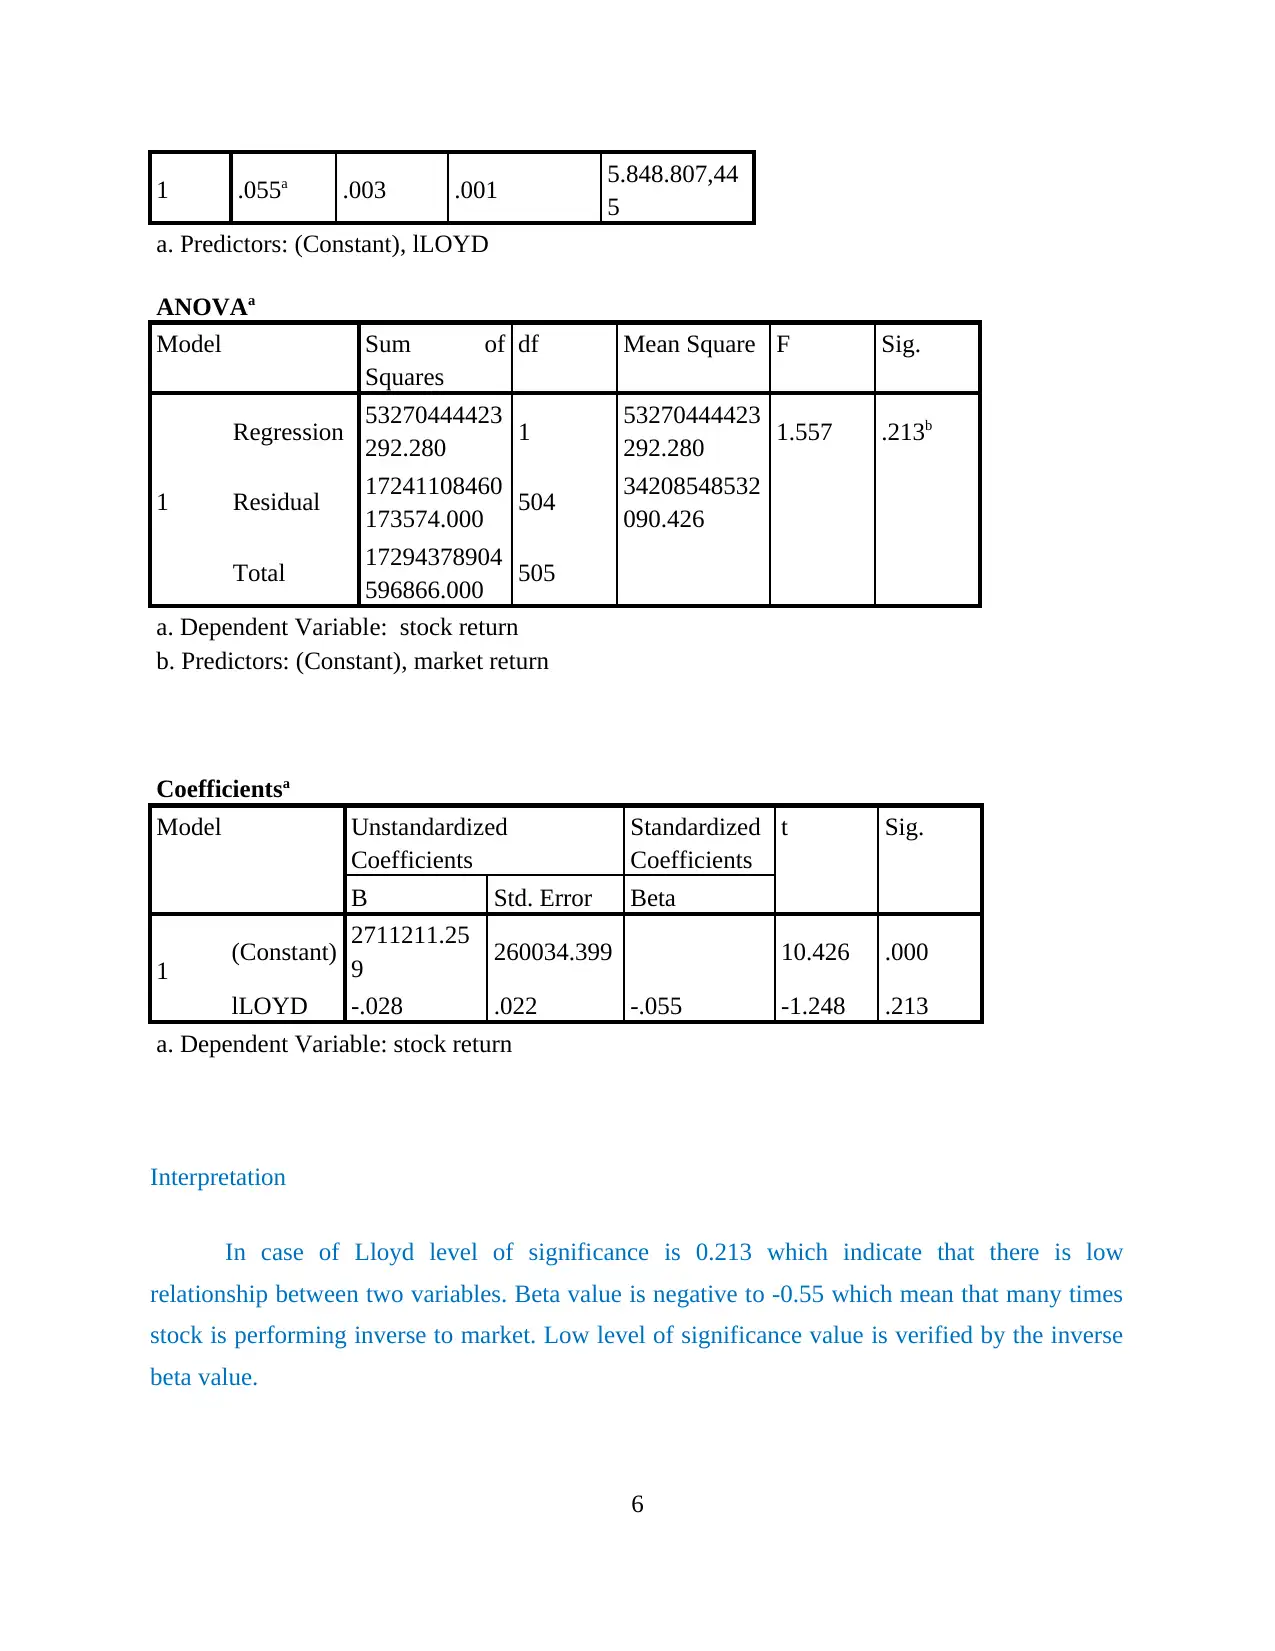
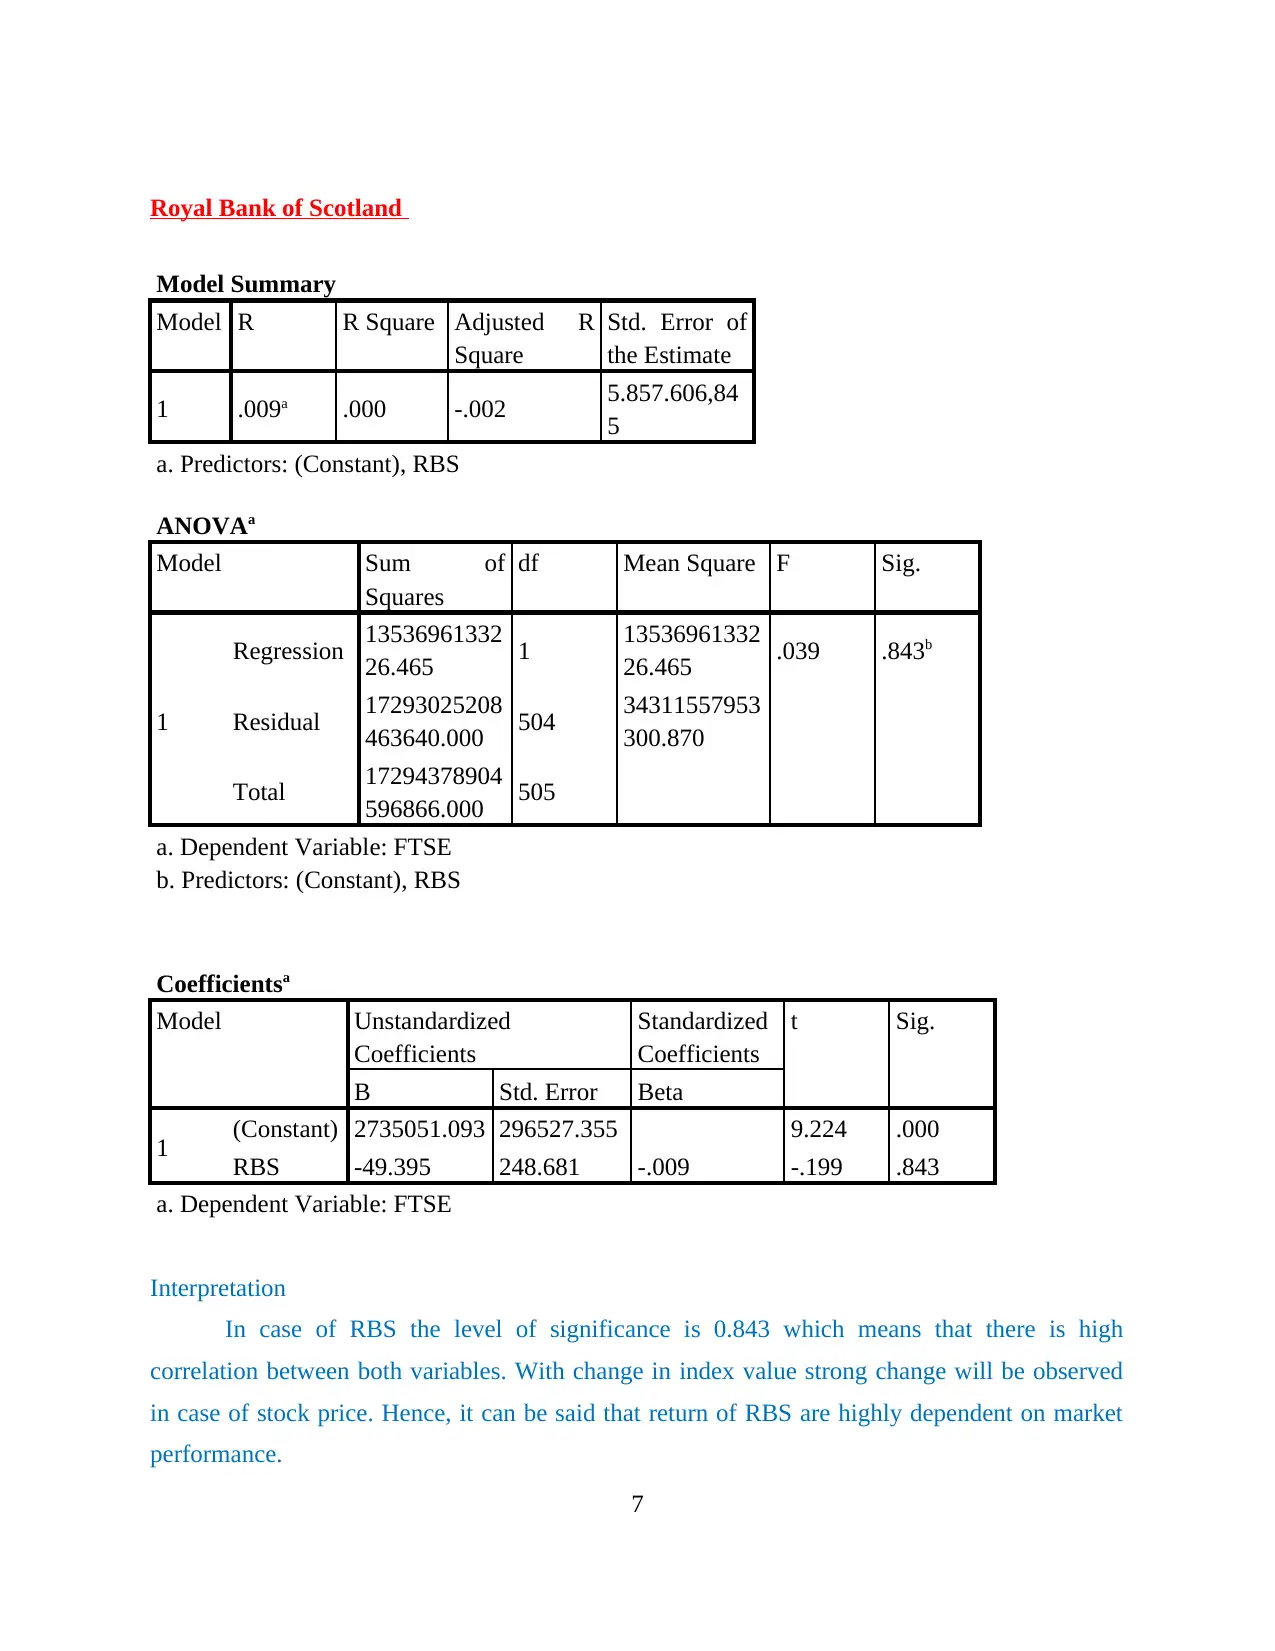
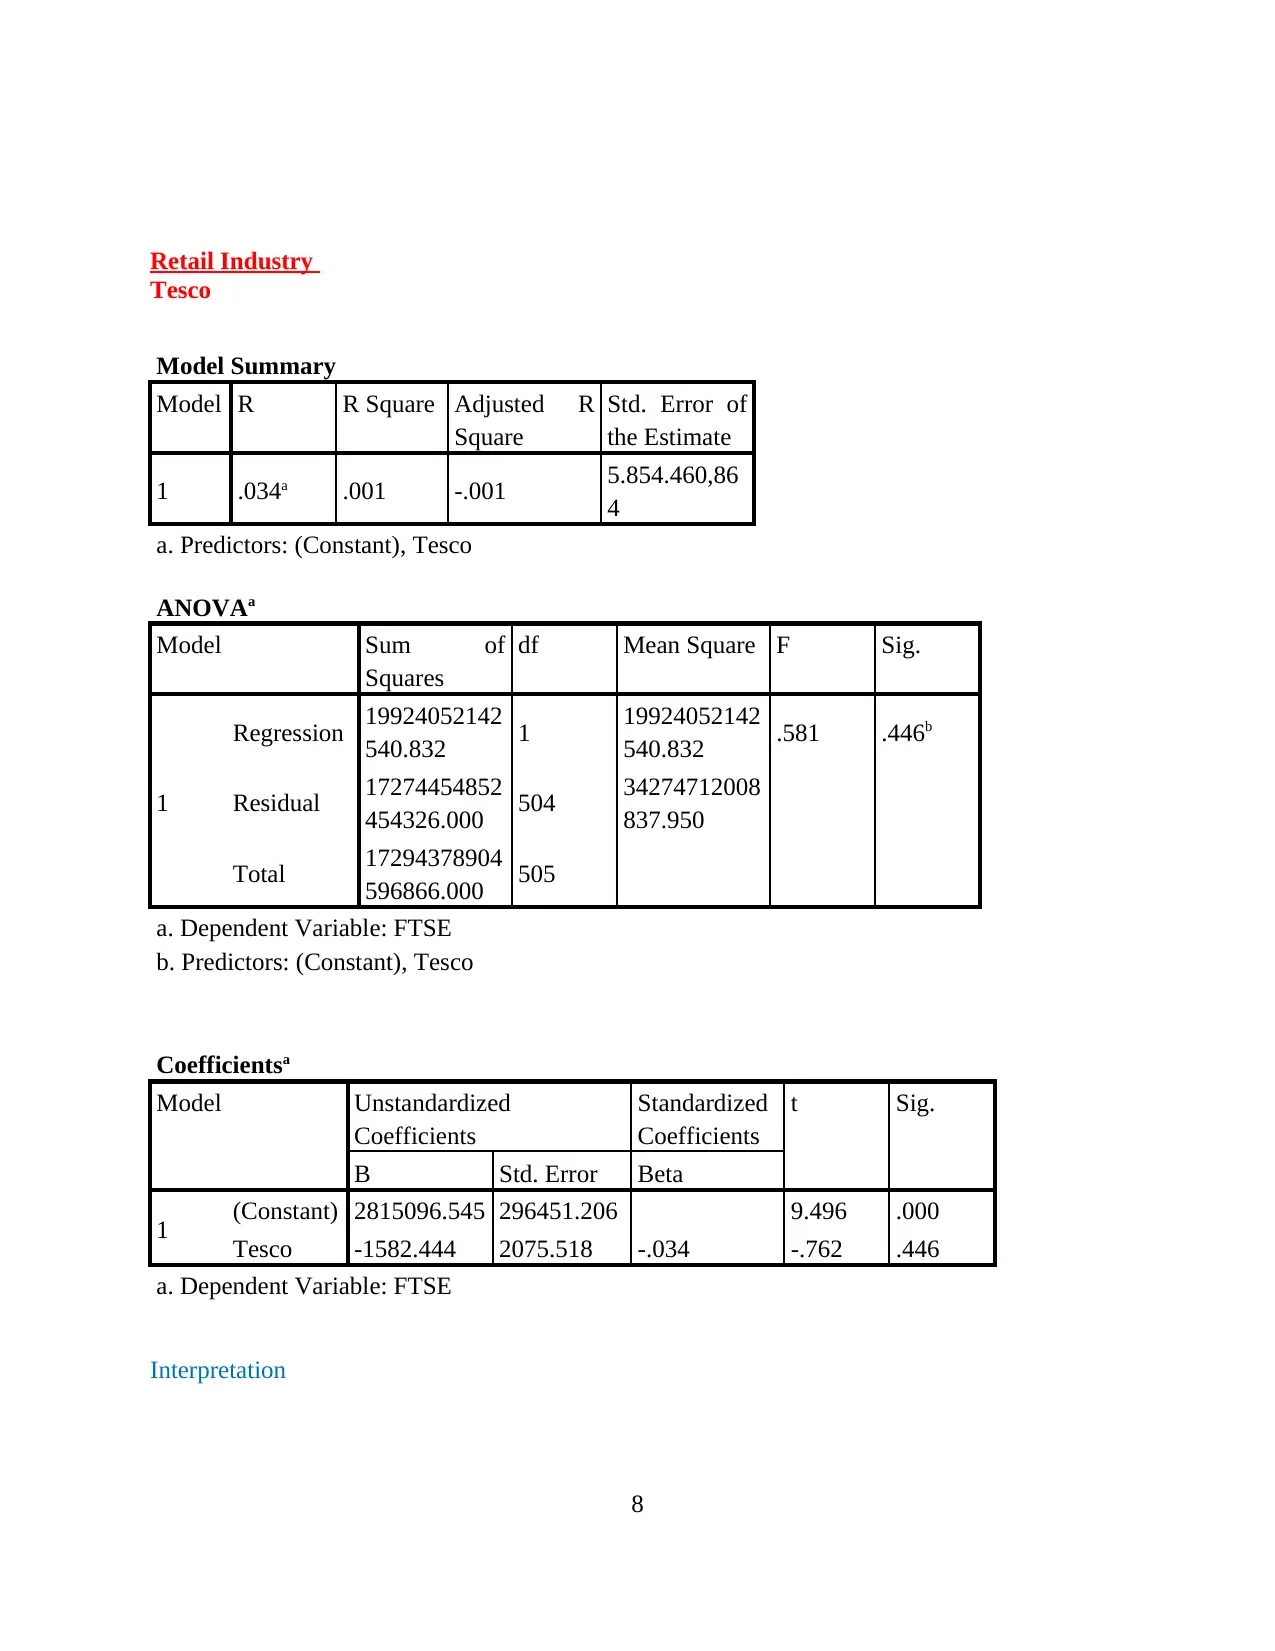
This report presents a comprehensive analysis of the Capital Asset Pricing Model (CAPM) theory. It utilizes financial data from 12 companies and a market index to test the validity of the model. The methodology involves time series regression analysis, with a focus on key statistical measures such as the t-statistic for alpha and the R-squared value for each company. The report provides detailed interpretations of the regression results for each company, including Barclays, HSBC, Lloyd, Royal Bank of Scotland, Tesco, Sainsbury, Next plc, Marks and Spencer’s, Thomas Cook, Virgin airlines, and Ryanair, examining the relationship between stock returns and market returns. Furthermore, the report discusses the merits and demerits of the CAPM analysis, offering a critical evaluation of the model's application and limitations in the context of the provided data.

Testing the CAPM
theory
1
theory
1
Paraphrase This Document
Need a fresh take? Get an instant paraphrase of this document with our AI Paraphraser

TABLE OF CONTENTS
Introduction......................................................................................................................................3
Task 1 and Task 2............................................................................................................................3
Task 3.............................................................................................................................................16
Task 4.............................................................................................................................................17
Conclusion.....................................................................................................................................17
References......................................................................................................................................18
2

Introduction
The purpose of the report is to test the CAPM theory. For that purpose, one market index
and financial data of 12 companies have been used. Time series regression analysis for each of
the company has been performed. T-statistic for alpha and the R-squared for each company will
be reported. The results and the merits and demerits of CAPM analysis is also have been
performed.
Task 1 and Task 2
T-statistic – Within statistics, the T-statistic is a ratio of the departure of a projected parameter
from its notional value and its standard error. It is mostly used in testing of the hypothesis
(Deegan and Unerman, 2006).
Alpha – Alpha is also known as the significance level in the statistical test. The alpha level is the
probability of rejecting the null hypothesis when the null hypothesis is true.
Beta – Beta is a measure of the volatility or security or systematic risk or a portfolio in
comparison to the market as a whole. It is mostly used in the capital asset pricing model (Jara,
Ebrero and Zapata 2011). It calculates the expected return of an asset on the basis of beta and the
expected market returns.
R-squared – It is a statistical measure of how close the data is with the regression line. It is also
regarded as the coefficient of determination and the coefficient of multiple determination (Keller,
2013).
Banking sector
Barclays
Model Summary
Model R R Square Adjusted R
Square
Std. Error of
the Estimate
1 .048a .002 .000 5.851.178,69
0
a. Predictors: (Constant), barclays FTSE
ANOVAa
3
⊘ This is a preview!⊘
Do you want full access?
Subscribe today to unlock all pages.

Trusted by 1+ million students worldwide

Model Sum of
Squares
df Mean Square F Sig.
1
Regression 39287708031
849.280 1 39287708031
849.280 1.148 .285b
Residual 17255091196
565016.000 504 34236292056
676.617
Total 17294378904
596866.000 505
a. Dependent Variable: stock return
b. Predictors: (Constant), market return
Coefficientsa
Model Unstandardized
Coefficients
Standardized
Coefficients
t Sig.
B Std. Error Beta
1
(Constant) 2557414.492 295173.764 8.664 .000
barclays
FTSE 2669.545 2492.024 .048 1.071 .285
a. Dependent Variable: stock return
Interpretation
Method of regression analysis was applied on the given set of data. The dependent
variable is stock return and the independent variable is market return. Here the significance value
is .285 and it shows that there is low level of relationship between the two variables. Hence it
indicates that stock returns are less dependent on market returns in case of Barclays bamk
HSBC
Model Summary
Model R R Square Adjusted R
Square
Std. Error of
the Estimate
1 .342a .117 .115 5.518.788,92
6
4
Paraphrase This Document
Need a fresh take? Get an instant paraphrase of this document with our AI Paraphraser

a. Predictors: (Constant), HSBC
ANOVAa
Model Sum of
Squares
df Mean Square F Sig.
1
Regression 20159056787
59934.800 1 20159056787
59934.800 66.189 .000b
Residual 15258972637
399396.000 501 30457031212
374.043
Total 17274878316
159330.000 502
a. Dependent Variable: FTSE
b. Predictors: (Constant), HSBC
Coefficientsa
Model Unstandardized Coefficients Standardized
Coefficients
t Sig.
B Std. Error Beta
1
(Constant) 2625691.604 246310.827 10.660 .000
HSBC 176659022.4
17
21714233.46
4 .342 8.136 .000
a. Dependent Variable: FTSE
Interpretation
Here relationship between return of HSBC and FTSE is identified. It can be said that
return in HSBC are dependent on market return because beta value is 0.34 which means that
every percentage change in market index will bring 0.34% change in stock return. Thus, it can be
said that there is low level of correlation between both value and stock return is less dependent
on market return.
Lloyd
Model Summary
Model R R Square Adjusted R
Square
Std. Error of
the Estimate
5

1 .055a .003 .001 5.848.807,44
5
a. Predictors: (Constant), lLOYD
ANOVAa
Model Sum of
Squares
df Mean Square F Sig.
1
Regression 53270444423
292.280 1 53270444423
292.280 1.557 .213b
Residual 17241108460
173574.000 504 34208548532
090.426
Total 17294378904
596866.000 505
a. Dependent Variable: stock return
b. Predictors: (Constant), market return
Coefficientsa
Model Unstandardized
Coefficients
Standardized
Coefficients
t Sig.
B Std. Error Beta
1 (Constant) 2711211.25
9 260034.399 10.426 .000
lLOYD -.028 .022 -.055 -1.248 .213
a. Dependent Variable: stock return
Interpretation
In case of Lloyd level of significance is 0.213 which indicate that there is low
relationship between two variables. Beta value is negative to -0.55 which mean that many times
stock is performing inverse to market. Low level of significance value is verified by the inverse
beta value.
6
⊘ This is a preview!⊘
Do you want full access?
Subscribe today to unlock all pages.

Trusted by 1+ million students worldwide

Royal Bank of Scotland
Model Summary
Model R R Square Adjusted R
Square
Std. Error of
the Estimate
1 .009a .000 -.002 5.857.606,84
5
a. Predictors: (Constant), RBS
ANOVAa
Model Sum of
Squares
df Mean Square F Sig.
1
Regression 13536961332
26.465 1 13536961332
26.465 .039 .843b
Residual 17293025208
463640.000 504 34311557953
300.870
Total 17294378904
596866.000 505
a. Dependent Variable: FTSE
b. Predictors: (Constant), RBS
Coefficientsa
Model Unstandardized
Coefficients
Standardized
Coefficients
t Sig.
B Std. Error Beta
1 (Constant) 2735051.093 296527.355 9.224 .000
RBS -49.395 248.681 -.009 -.199 .843
a. Dependent Variable: FTSE
Interpretation
In case of RBS the level of significance is 0.843 which means that there is high
correlation between both variables. With change in index value strong change will be observed
in case of stock price. Hence, it can be said that return of RBS are highly dependent on market
performance.
7
Paraphrase This Document
Need a fresh take? Get an instant paraphrase of this document with our AI Paraphraser

Retail Industry
Tesco
Model Summary
Model R R Square Adjusted R
Square
Std. Error of
the Estimate
1 .034a .001 -.001 5.854.460,86
4
a. Predictors: (Constant), Tesco
ANOVAa
Model Sum of
Squares
df Mean Square F Sig.
1
Regression 19924052142
540.832 1 19924052142
540.832 .581 .446b
Residual 17274454852
454326.000 504 34274712008
837.950
Total 17294378904
596866.000 505
a. Dependent Variable: FTSE
b. Predictors: (Constant), Tesco
Coefficientsa
Model Unstandardized
Coefficients
Standardized
Coefficients
t Sig.
B Std. Error Beta
1 (Constant) 2815096.545 296451.206 9.496 .000
Tesco -1582.444 2075.518 -.034 -.762 .446
a. Dependent Variable: FTSE
Interpretation
8

In case of Tesco level of significance is 0.446 which means that return given by
mentioned firm are moderately linked to the market performance. It means that if index fall
sharply on single day then moderate change will be observed in case of stock return. An investor
who is prepared to take moderate risk on market return can make investment in Tesco. It has
been observed that high risk we take on investment there become greater chances of profit
earning on shares. Here risk is moderate to change in index value. Hence, investor can make
investment in Tesco in order to earn good amount of profit,
Sainsbury
Model Summary
Model R R Square Adjusted R
Square
Std. Error of
the Estimate
1 .026a .001 -.001 5.855.824,19
0
a. Predictors: (Constant), Sainsbury
ANOVAa
Model Sum of
Squares
df Mean Square F Sig.
1
Regression 11877726637
937.012 1 11877726637
937.012 .346 .556b
Residual 17282501177
958928.000 504 34290676940
394.700
Total 17294378904
596866.000 505
a. Dependent Variable: FTSE
b. Predictors: (Constant), Sainsbury
Coefficientsa
Model Unstandardized
Coefficients
Standardized
Coefficients
t Sig.
B Std. Error Beta
1 (Constant) 2713767.936 260586.281 10.414 .000
9
⊘ This is a preview!⊘
Do you want full access?
Subscribe today to unlock all pages.

Trusted by 1+ million students worldwide

Sainsbury -.009 .015 -.026 -.589 .556
a. Dependent Variable: FTSE
Interpretation
Value of level of significance is 0.556 which is very high and this reflects that there is
high dependency of stock return of Sainsbury on performance of index. This means that with
every single positive change in index return big change will be observed in case of stock return.
Hence, investment is very risky in Sainsbury because if index perform poor then Sainsbury
shares will also give poor performance. Thus, proportion of this share in portfolio must be low.
Next plc
Model Summary
Model R R Square Adjusted R
Square
Std. Error of
the Estimate
1 .111a .012 -.035 4.698.104,79
2
a. Predictors: (Constant), next
ANOVAa
Model Sum of
Squares
df Mean Square F Sig.
1
Regression 57422273675
83.302 1 57422273675
83.302 .260 .615b
Residual 46351596142
9718.200 21 22072188639
510.390
Total 46925818879
7301.500 22
a. Dependent Variable: Stock returns
b. Predictors: (Constant), Market returns
Coefficientsa
Model Unstandardized
Coefficients
Standardized
Coefficients
t Sig.
10
Paraphrase This Document
Need a fresh take? Get an instant paraphrase of this document with our AI Paraphraser

B Std. Error Beta
1 (Constant) 2865428.785 994808.550 2.880 .009
next .011 .022 .111 .510 .615
a. Dependent Variable: stock returns
Interpretation
In case of Next plc also there is high value of level of significance. Value 0.615 indicates
that there is high dependency of return given by Next plc on market performance. If market will
give good performance then stock of the mentioned company will also give good performance.
This level of significance reflects that investment in Next plc share is very risky and chances of
earning profit on investment and losing of money both are high with small movement on stock
market index. Hence, on the basis of value of variable it can be said that there is high
dependency of return given by Next plc on market performance.
Marks and Spencer’s
Model Summary
Model R R Square Adjusted R
Square
Std. Error of
the Estimate
1 .075a .006 .004 5.841.167,90
1
a. Predictors: (Constant), MNS
ANOVAa
Model Sum of
Squares
df Mean Square F Sig.
1
Regression 98280711695
852.170 1 98280711695
852.170 2.881 .090b
Residual 17196098192
901014.000 504 34119242446
232.170
Total 17294378904
596866.000 505
a. Dependent Variable: Stock returns
b. Predictors: (Constant), Market returns
11

Coefficientsa
Model Unstandardized
Coefficients
Standardized
Coefficients
t Sig.
B Std. Error Beta
1 (Constant) 2696907.494 259738.022 10.383 .000
MNS -.033 .019 -.075 -1.697 .090
a. Dependent Variable: Stock returns
Interpretation
Value of level of significance is low in case of Mark and Spencer even it is below 0.1 and
this reflects that return of mentioned firm are very less dependent on the market return. It can be
said that if market decline by sharp rate the share price will of Mark and Spencer will decline by
very low percentage. This means that investment in Mark and Spencer shares is less risky. On
this basis it can be said that investment in this company share to large extent is less risky and risk
averse investors must make investment in same.
Airline Industry
Thomas Cook airways
Model Summary
Model R R Square Adjusted R
Square
Std. Error of
the Estimate
1 .031a .001 -.001 5.854.970,13
5
a. Predictors: (Constant), Thomas cook
Model Summary
Model R R Square Adjusted R
Square
Std. Error of
the Estimate
1 .031a .001 -.001 5.854.970,13
5
a. Predictors: (Constant), Thomas cook
12
⊘ This is a preview!⊘
Do you want full access?
Subscribe today to unlock all pages.

Trusted by 1+ million students worldwide
1 out of 18
Related Documents
Your All-in-One AI-Powered Toolkit for Academic Success.
+13062052269
info@desklib.com
Available 24*7 on WhatsApp / Email
Unlock your academic potential
Copyright © 2020–2025 A2Z Services. All Rights Reserved. Developed and managed by ZUCOL.


