Analyzing Car Buyer Data: Statistics for Decision-Making Insights
VerifiedAdded on 2023/06/10
|27
|4945
|158
Report
AI Summary
This report presents a statistical analysis of luxury car buyer data, focusing on BMW, Lexus, and Mercedes. The study investigates the age, annual income, and education levels of car buyers to understand their preferences and inform marketing strategies. Descriptive statistics, one-way ANOVA, and binary logistic regression are employed to analyze the data. The findings reveal insights into the demographics of buyers for each car brand, including average age, income distribution, and education levels. The report also discusses the marketing strategies employed by these brands, emphasizing the importance of customer market analysis and brand awareness. The conclusion highlights the competitive landscape and the need for data-driven decision-making in the luxury car market. Desklib offers students access to similar solved assignments and study tools for further learning.

STATISTICS FOR DECISION-MAKING
Statistics for Decision-making
Name of the student:
Name of the university:
Course ID:
Statistics for Decision-making
Name of the student:
Name of the university:
Course ID:
Paraphrase This Document
Need a fresh take? Get an instant paraphrase of this document with our AI Paraphraser
STATISTICS FOR DECISION-MAKING
Executive Summary:
The car brands such as BMW, Lexus and Mercedes campaign the custom agency of the brand. The marketing campaign is proved to
be the product of both the new global agency model of the market and refocused brand communicating strategies. The marketing mix
indicates a fantastic company. The recognized company is the top-most recognized automobiles brands. The implemented automobile
company established the fiercely competitive automobile industry. The age, annual income and education of the car buyers are the
investigating facts about preferences of cars. The marketing strategy is dependent upon the performances of the cars available in the
market. The target market gets increased by proper communication, marketing strategy and accessibility. The major thing that the cars
managed to construct a reputation of quality and exclusively in all its products. With the help of proper policy making, the brands
would be more recognizable in the market. The influencing factors are the determinants for strategy making of the managements.
These companies understand that consumers would be more approachable due to well applied policies. The car brands deal with a
niche segment where the customer is more concerned with the values they are receiving in the companies. The activities, planning,
processes, delivery and exchange of the car brands completely satisfy the profitability of customer requirements created to fulfil the
customer needs. ‘Mercedes’ is found to be more powerful competitor of the other two car companies that are ‘BMW’ and ‘Lexus’. To
keep competition in market and survive in other situations too, the low performing countries are needed to cope up the measurable
policies.
STATISTICS FOR DECISION-MAKING
Table of Contents
1. Introduction:............................................................................................................................................................................................2
2. Marketing Strategy:.................................................................................................................................................................................2
3. Data Analysis:..........................................................................................................................................................................................3
3.1. Data description:...............................................................................................................................................................................3
3.2. Answers:............................................................................................................................................................................................3
Answer 1...............................................................................................................................................................................................0
Answer 2...............................................................................................................................................................................................1
Answer 3...............................................................................................................................................................................................0
Answer 4...............................................................................................................................................................................................2
Answer 5...............................................................................................................................................................................................3
Answer 6...............................................................................................................................................................................................5
Answer 7...............................................................................................................................................................................................7
4. Conclusion:..............................................................................................................................................................................................0
5. Implications:............................................................................................................................................................................................1
References:..................................................................................................................................................................................................2
⊘ This is a preview!⊘
Do you want full access?
Subscribe today to unlock all pages.
Trusted by 1+ million students worldwide
STATISTICS FOR DECISION-MAKING
1. Introduction:
The report was based on the case study of the buyers of 2012. To find the buying of various types of luxury cars, automobile
association carried out a survey of luxury car buyers. The three types of luxury cars that are BMW, Lexus and Mercedes are collected
during this analysis. The ages of the buyers, household incomes (in dollars) and years of education are investigated as the effective
factors.
The luxury car manufactures divide its offerings based on ‘demographics’, ‘behavioral factors’ and ‘psychographics’. ‘BMW’
cars deliver a huge amount of successful growth as a result of its robust strategy as resolute approach in the implementation and
absolute commitment to all customers and their requirements (Peter, Olson and Grunert 1999). ‘Mercedes’ cars create challenges and
changes a healthy growth. ‘Lexus’ is a subsidiary division of its parent company Toyota that manufactures a huge number of cars
worldwide. It is associated with automotive industry and trades in producing and marketing of premium vehicles. The statistics of
surveyed data of purchase of three types of cars are visualized and analyzed in this research method.
The advantages that are required by the people are ‘superiority’, ‘performance’, ‘quality’ and ‘reliability’. The brands of cars
target ‘upper social group’ customers as they are the people for whom these cars would be affordable and moreover appreciated. The
brands of cars and global frontrunners have positioned itself as a symbol of ‘technological advancement’, ‘quality’ and ‘high
performance’. The following case study is going to highlight the combination of customer preferences and sales.
2. Marketing Strategy:
In the context of market value, these three brands “BMW”, “Lexus” and “Mercedes” are positioned in the top ten largest global
brands. These brands have gained world-wide recognition and are being marketed in Europe, Latin America and South-East Asia.
These brands generally aim the “Elite class” as potential market. These brands of cars look for perfection, comfort and ultimate luxury
for their potential consumers. The brands face inter-market and intra-market competition in global scenario. These brands were
interested in forming the covert project by their founder to manufacture the best luxury vehicle.
Paraphrase This Document
Need a fresh take? Get an instant paraphrase of this document with our AI Paraphraser
STATISTICS FOR DECISION-MAKING
The marketing strategy includes reformation in “Regional distributors”, “Dealership network” and “Exhibition canters”. The
key success of the marketing strategy and policies of the brands on a great extent are projected on the basis of customer market. The
advertisements and commercials highlight the distinctive features such as ‘relentless’, ‘perfection’, ‘precision’, ‘smoothness’ and
‘balance’ (Atwal and Williams 2009). The brands especially ‘BMW’ and ‘Lexus’ should take help of social, electronic and print
media to advertise with the help of television, newspapers, magazines and online platforms. The brand awareness of the three brands
is very much necessary with regard to this (Kapferer and Bastien 2012). The international brands coordinate its global pricing policy
with competitive pricing policy that generates a distinctive competitive advantage results in larger sales volume and better profits. The
marketing strategy must be based on the analyses of surveyed data of the car brands and companies. The companies cover up the
aspects of ‘Product’, ‘Price’, ‘Place’ and ‘Promotion’ elaborating the sales and performance (Dickson and Ginter 1987).
3. Data Analysis:
The analysis is quantitative in nature. MS-Excel 2016 is utilized for data analysis. Descriptive statistics, One-way ANOVA and
binary logistic regression are executed in the data analysis. Descriptive statistics discusses about average, median, standard deviation,
kurtosis, skewness, maximum, minimum and range of the numerical variables. One-way ANOVA tests find the equality of averages of
the variables. The binary logistic regression finds the association between dependent variable and independent variables.
3.1. Data description:
In this case study, the data is surveyed and collected for three types of luxury cars that are BMW, Lexus and Mercedes. The
age of the buyers, household incomes of the buyers and years of education of each types of luxury cars were gathered in this survey.
The quantitative variables are age of the customers, household income of the buyers in dollars and years of education of the car
buyers. The nominal variable is the types of car. The nominal variable is numerated by three levels. The data analysis is majorly
quantitative. This exploratory data analysis is utilized to find the hidden association between dependent variable and independent
variables of the data set.
STATISTICS FOR DECISION-MAKING
3.2. Answers:
Answer 1.
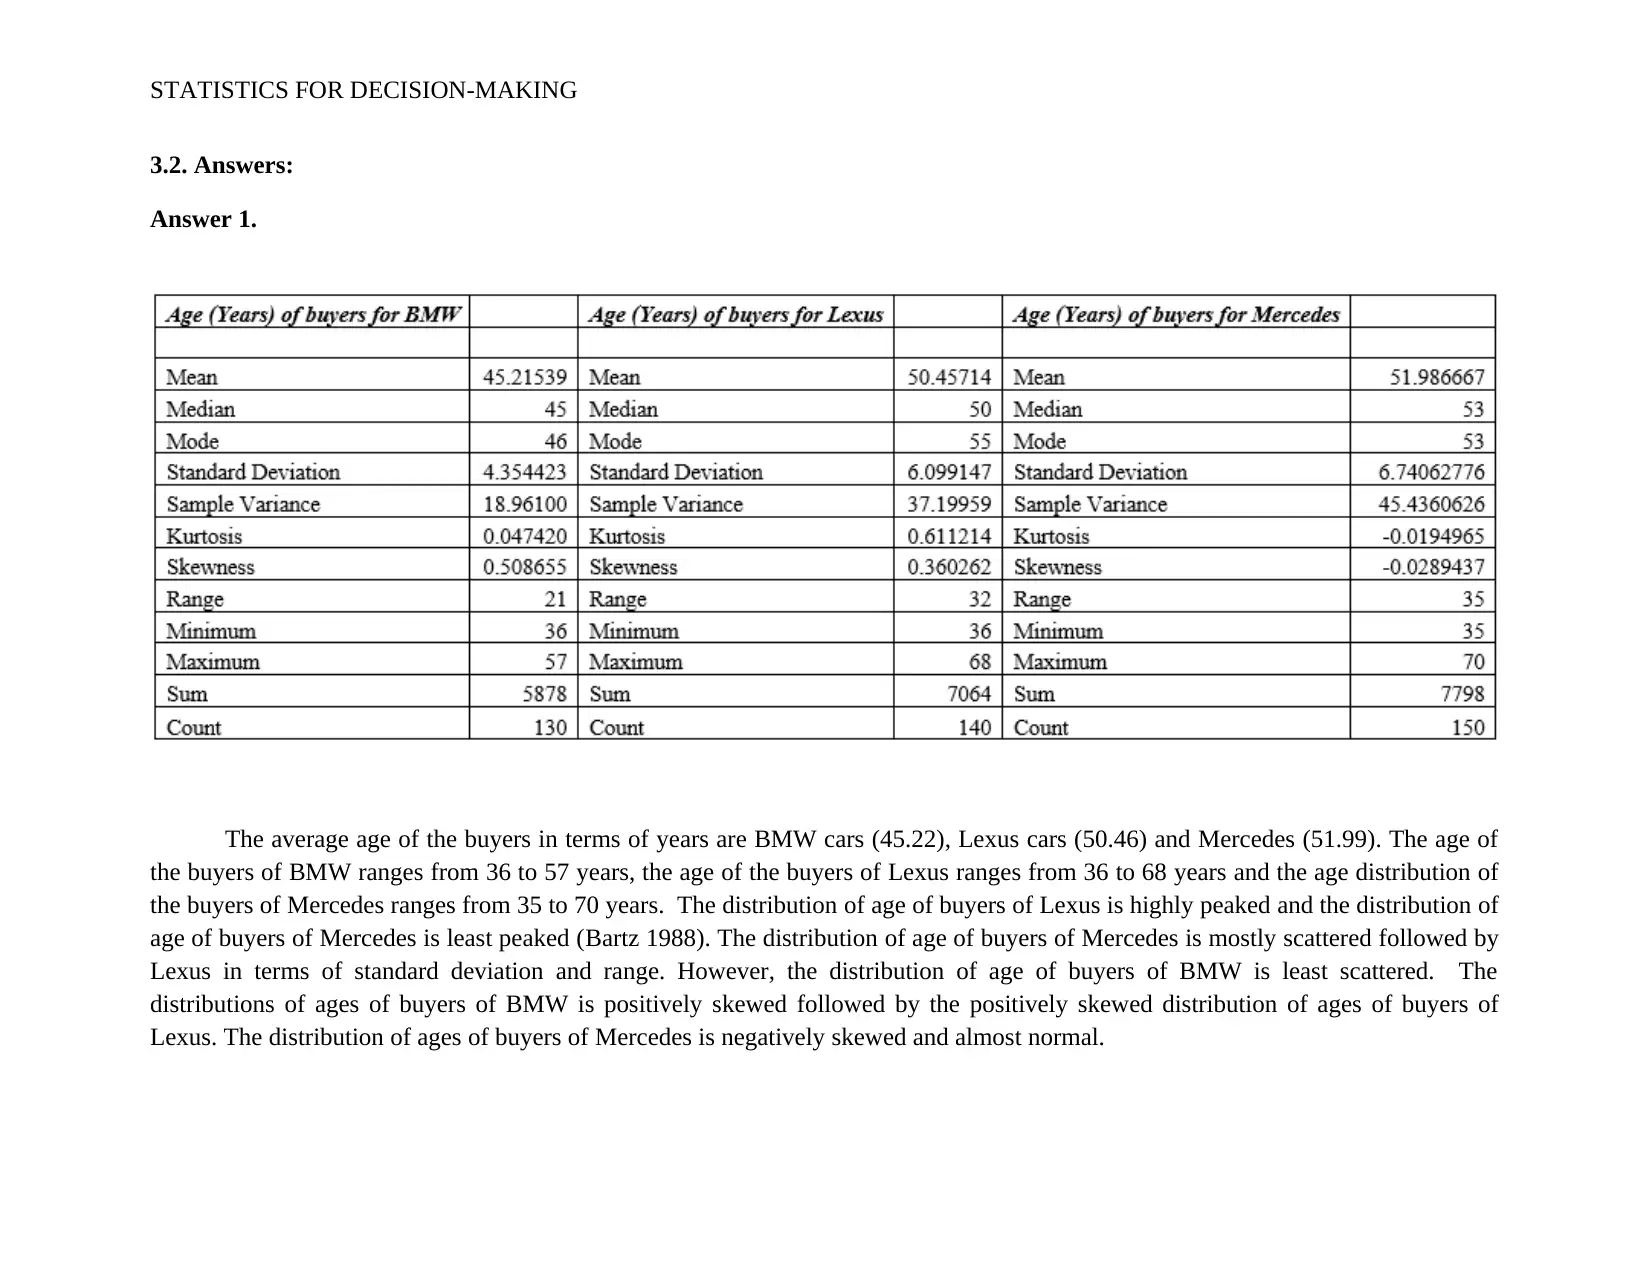
The average age of the buyers in terms of years are BMW cars (45.22), Lexus cars (50.46) and Mercedes (51.99). The age of
the buyers of BMW ranges from 36 to 57 years, the age of the buyers of Lexus ranges from 36 to 68 years and the age distribution of
the buyers of Mercedes ranges from 35 to 70 years. The distribution of age of buyers of Lexus is highly peaked and the distribution of
age of buyers of Mercedes is least peaked (Bartz 1988). The distribution of age of buyers of Mercedes is mostly scattered followed by
Lexus in terms of standard deviation and range. However, the distribution of age of buyers of BMW is least scattered. The
distributions of ages of buyers of BMW is positively skewed followed by the positively skewed distribution of ages of buyers of
Lexus. The distribution of ages of buyers of Mercedes is negatively skewed and almost normal.
3.2. Answers:
Answer 1.
The average age of the buyers in terms of years are BMW cars (45.22), Lexus cars (50.46) and Mercedes (51.99). The age of
the buyers of BMW ranges from 36 to 57 years, the age of the buyers of Lexus ranges from 36 to 68 years and the age distribution of
the buyers of Mercedes ranges from 35 to 70 years. The distribution of age of buyers of Lexus is highly peaked and the distribution of
age of buyers of Mercedes is least peaked (Bartz 1988). The distribution of age of buyers of Mercedes is mostly scattered followed by
Lexus in terms of standard deviation and range. However, the distribution of age of buyers of BMW is least scattered. The
distributions of ages of buyers of BMW is positively skewed followed by the positively skewed distribution of ages of buyers of
Lexus. The distribution of ages of buyers of Mercedes is negatively skewed and almost normal.
⊘ This is a preview!⊘
Do you want full access?
Subscribe today to unlock all pages.
Trusted by 1+ million students worldwide
STATISTICS FOR DECISION-MAKING
Paraphrase This Document
Need a fresh take? Get an instant paraphrase of this document with our AI Paraphraser
STATISTICS FOR DECISION-MAKING
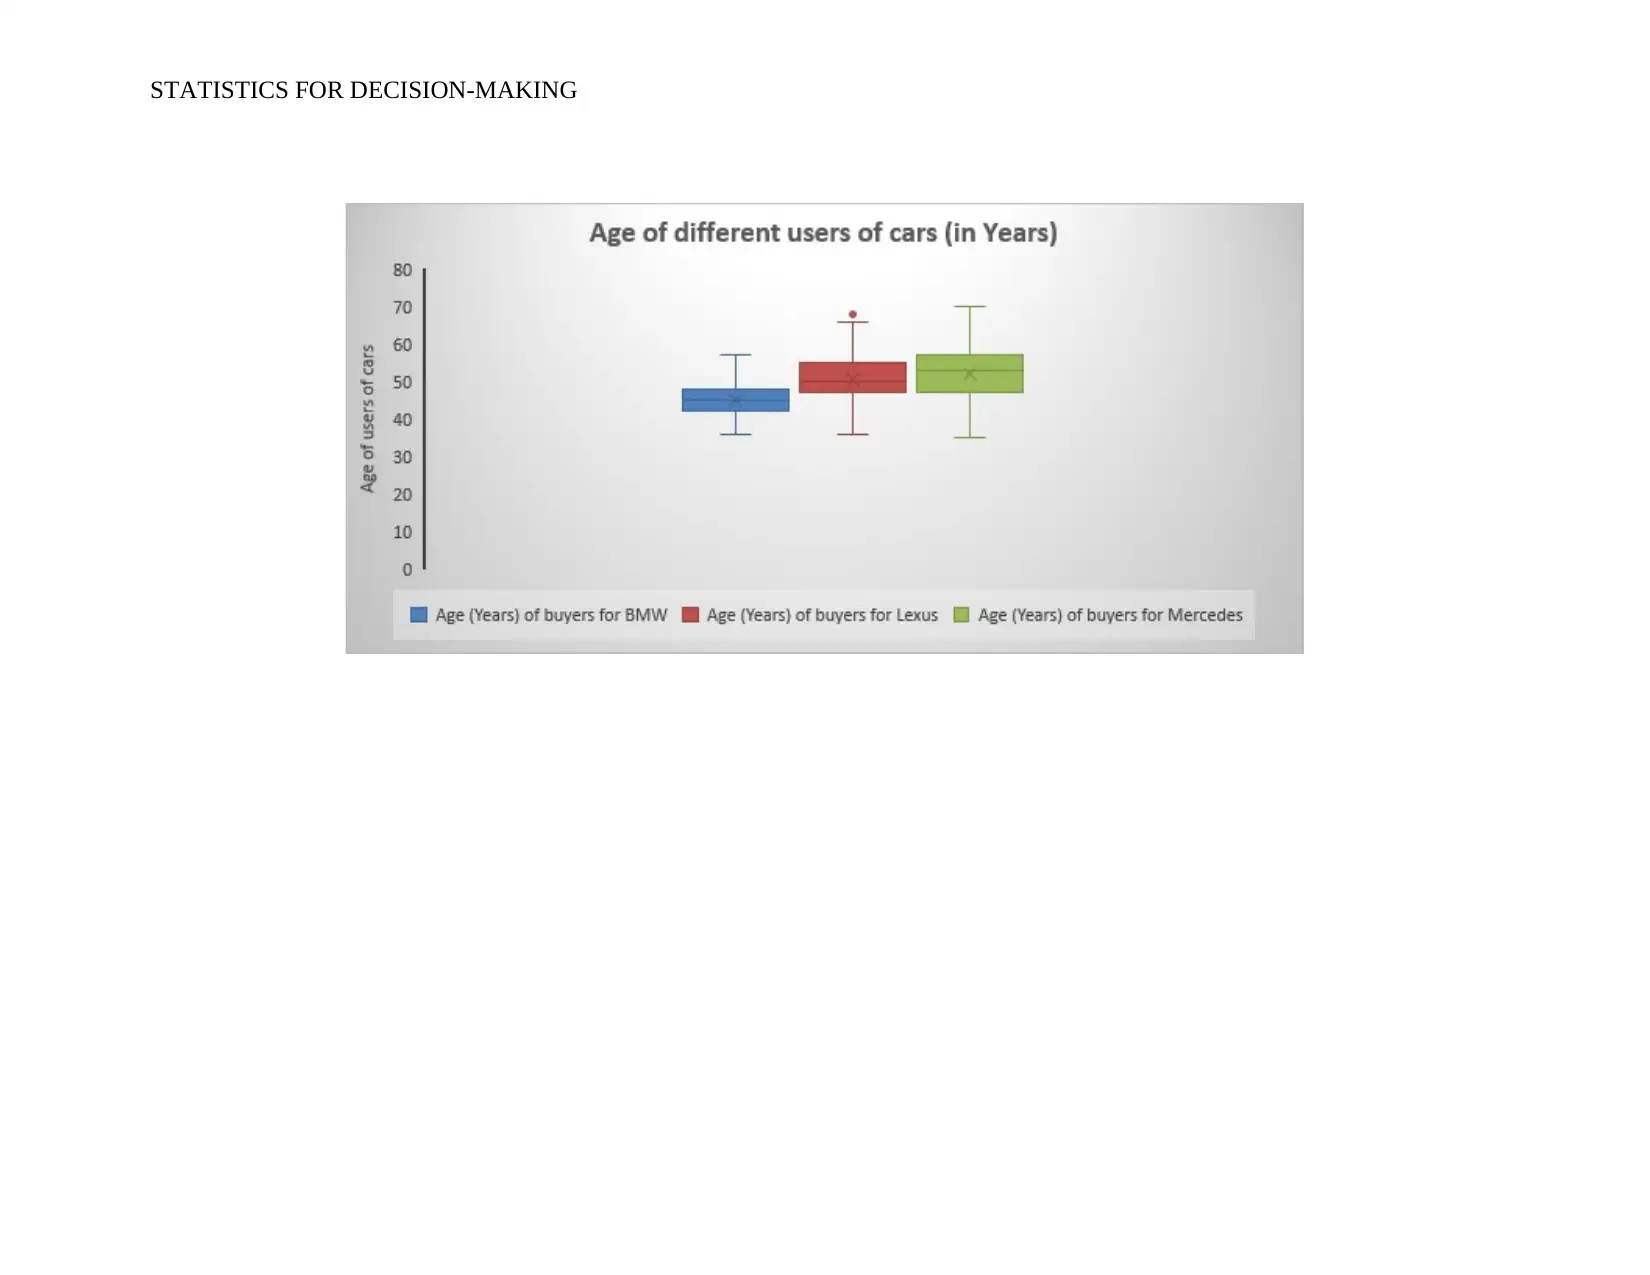
The distribution of ages of various buyers of cars is symmetric for BMW cars and an outlier is observed in the distribution of
ages of different buyers of Lexus cars. The median of the distribution of ages of Mercedes cars is highest and median of the
distribution of ages of BMW cars is lowest.
30 35 40 45 50 55 60 65 70 More
0
10
20
30
40
50
60
Histogram of Age of buyers of BMW
Bin Range
Frequency
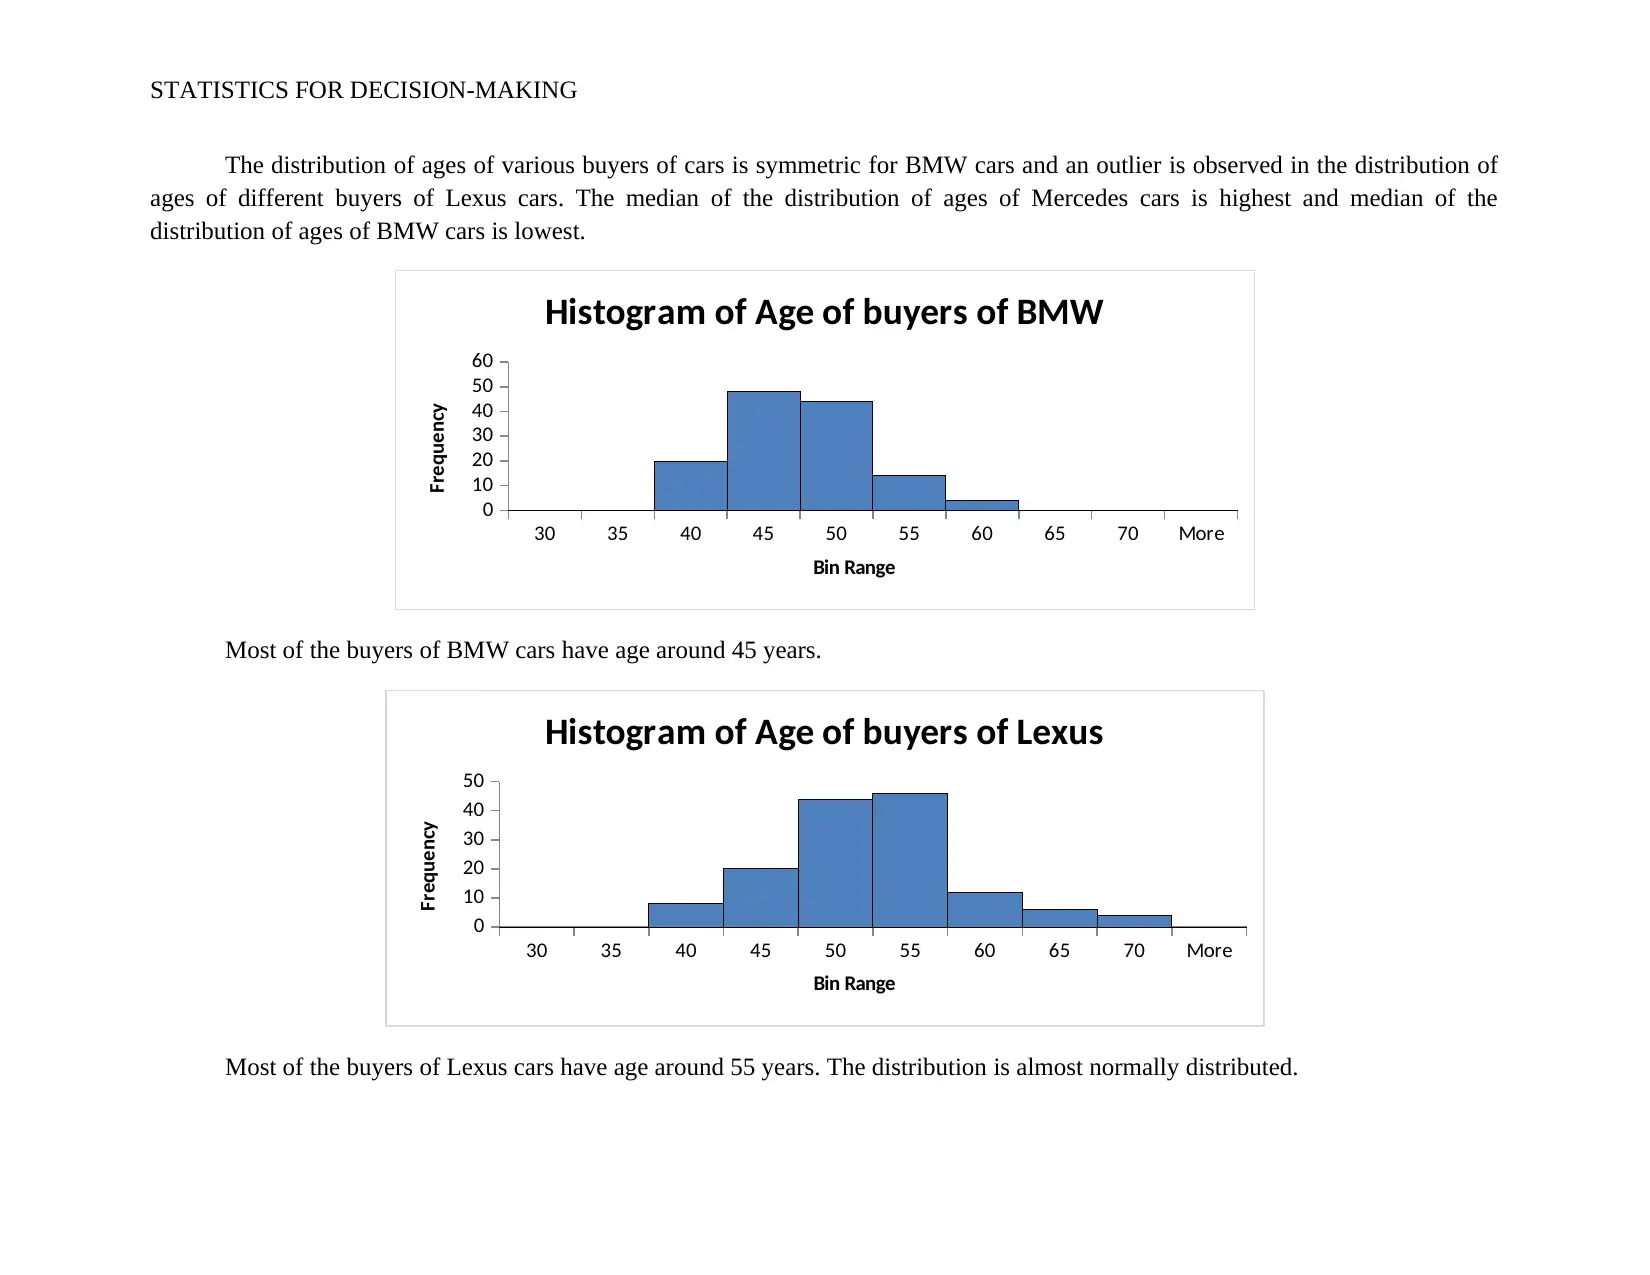
Most of the buyers of BMW cars have age around 45 years.
30 35 40 45 50 55 60 65 70 More
0
10
20
30
40
50
Histogram of Age of buyers of Lexus
Bin Range
Frequency
Most of the buyers of Lexus cars have age around 55 years. The distribution is almost normally distributed.
The distribution of ages of various buyers of cars is symmetric for BMW cars and an outlier is observed in the distribution of
ages of different buyers of Lexus cars. The median of the distribution of ages of Mercedes cars is highest and median of the
distribution of ages of BMW cars is lowest.
30 35 40 45 50 55 60 65 70 More
0
10
20
30
40
50
60
Histogram of Age of buyers of BMW
Bin Range
Frequency
Most of the buyers of BMW cars have age around 45 years.
30 35 40 45 50 55 60 65 70 More
0
10
20
30
40
50
Histogram of Age of buyers of Lexus
Bin Range
Frequency
Most of the buyers of Lexus cars have age around 55 years. The distribution is almost normally distributed.
STATISTICS FOR DECISION-MAKING
30 35 40 45 50 55 60 65 70 More
0
10
20
30
40
50
Histogram of Age of buyers of Mercedes
Bin Range
Frequency
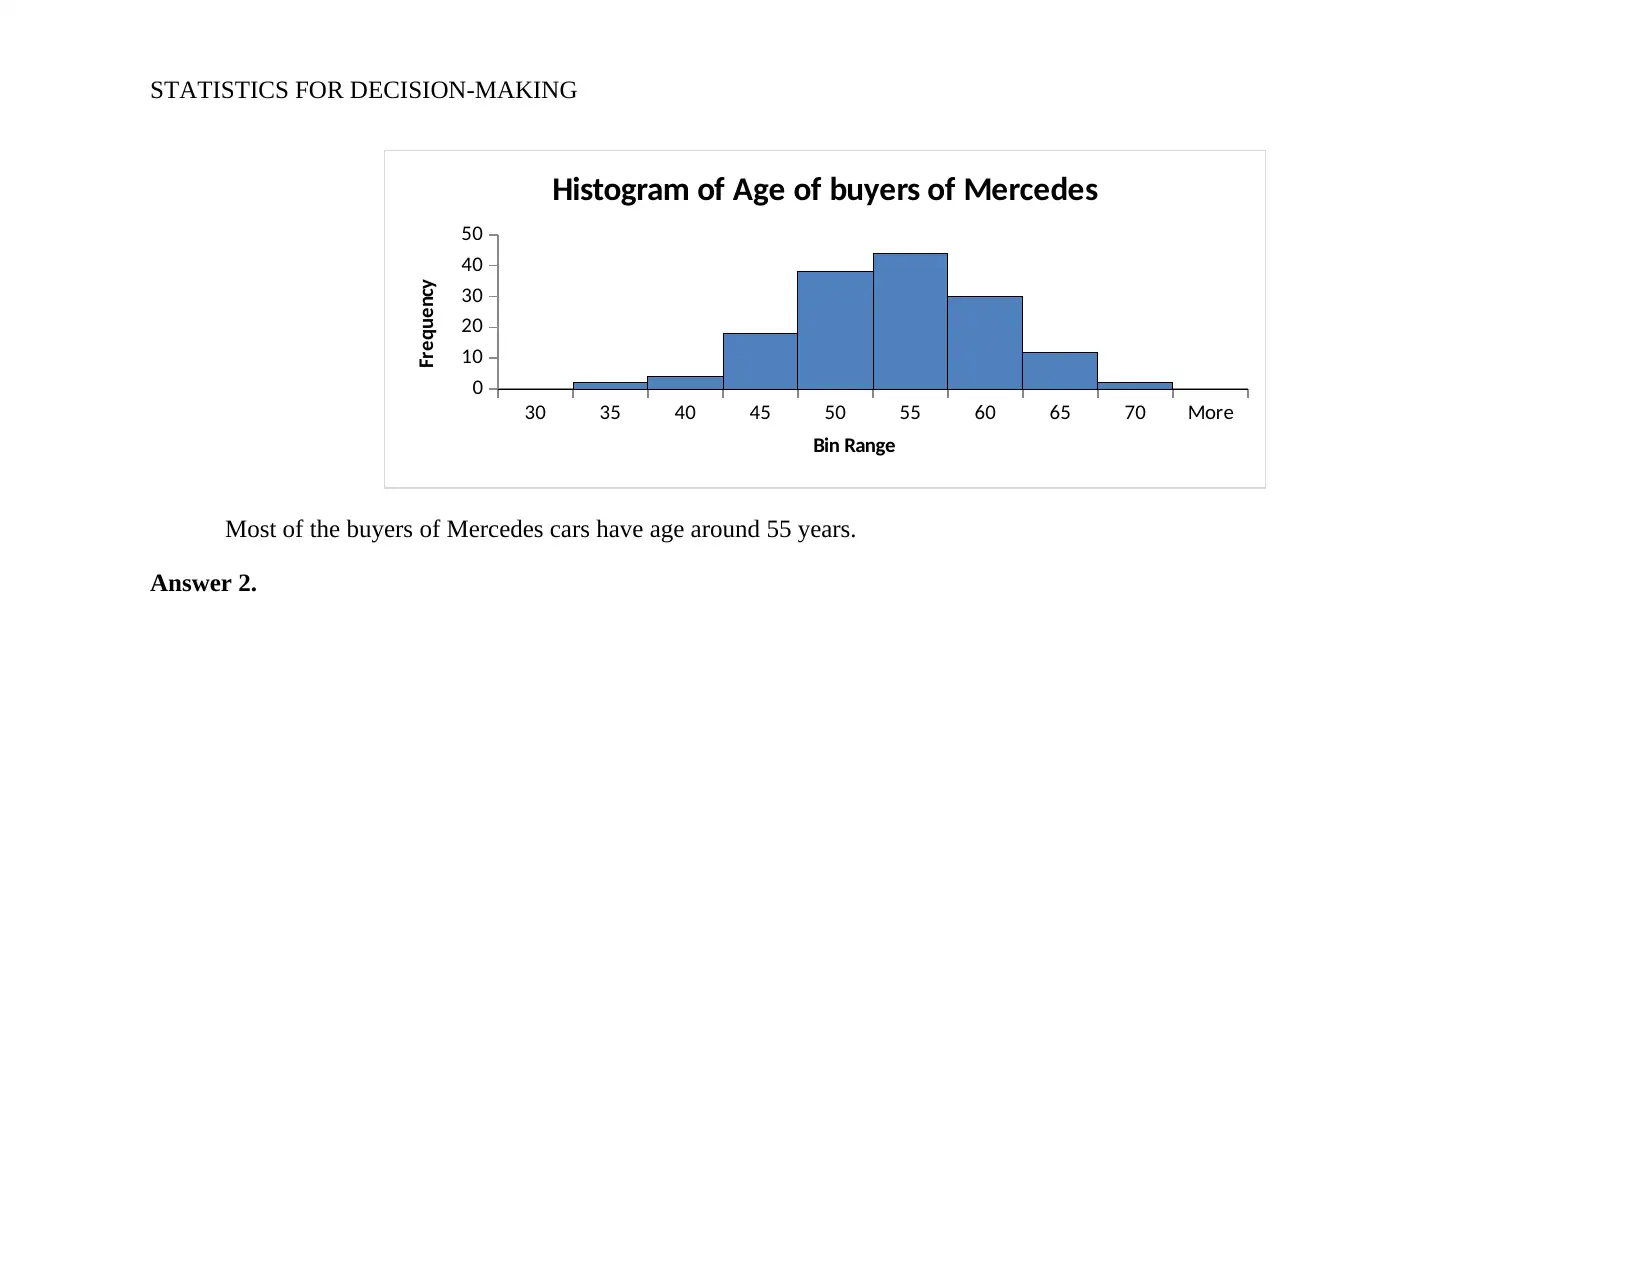
Most of the buyers of Mercedes cars have age around 55 years.
Answer 2.
30 35 40 45 50 55 60 65 70 More
0
10
20
30
40
50
Histogram of Age of buyers of Mercedes
Bin Range
Frequency
Most of the buyers of Mercedes cars have age around 55 years.
Answer 2.
⊘ This is a preview!⊘
Do you want full access?
Subscribe today to unlock all pages.
Trusted by 1+ million students worldwide
STATISTICS FOR DECISION-MAKING
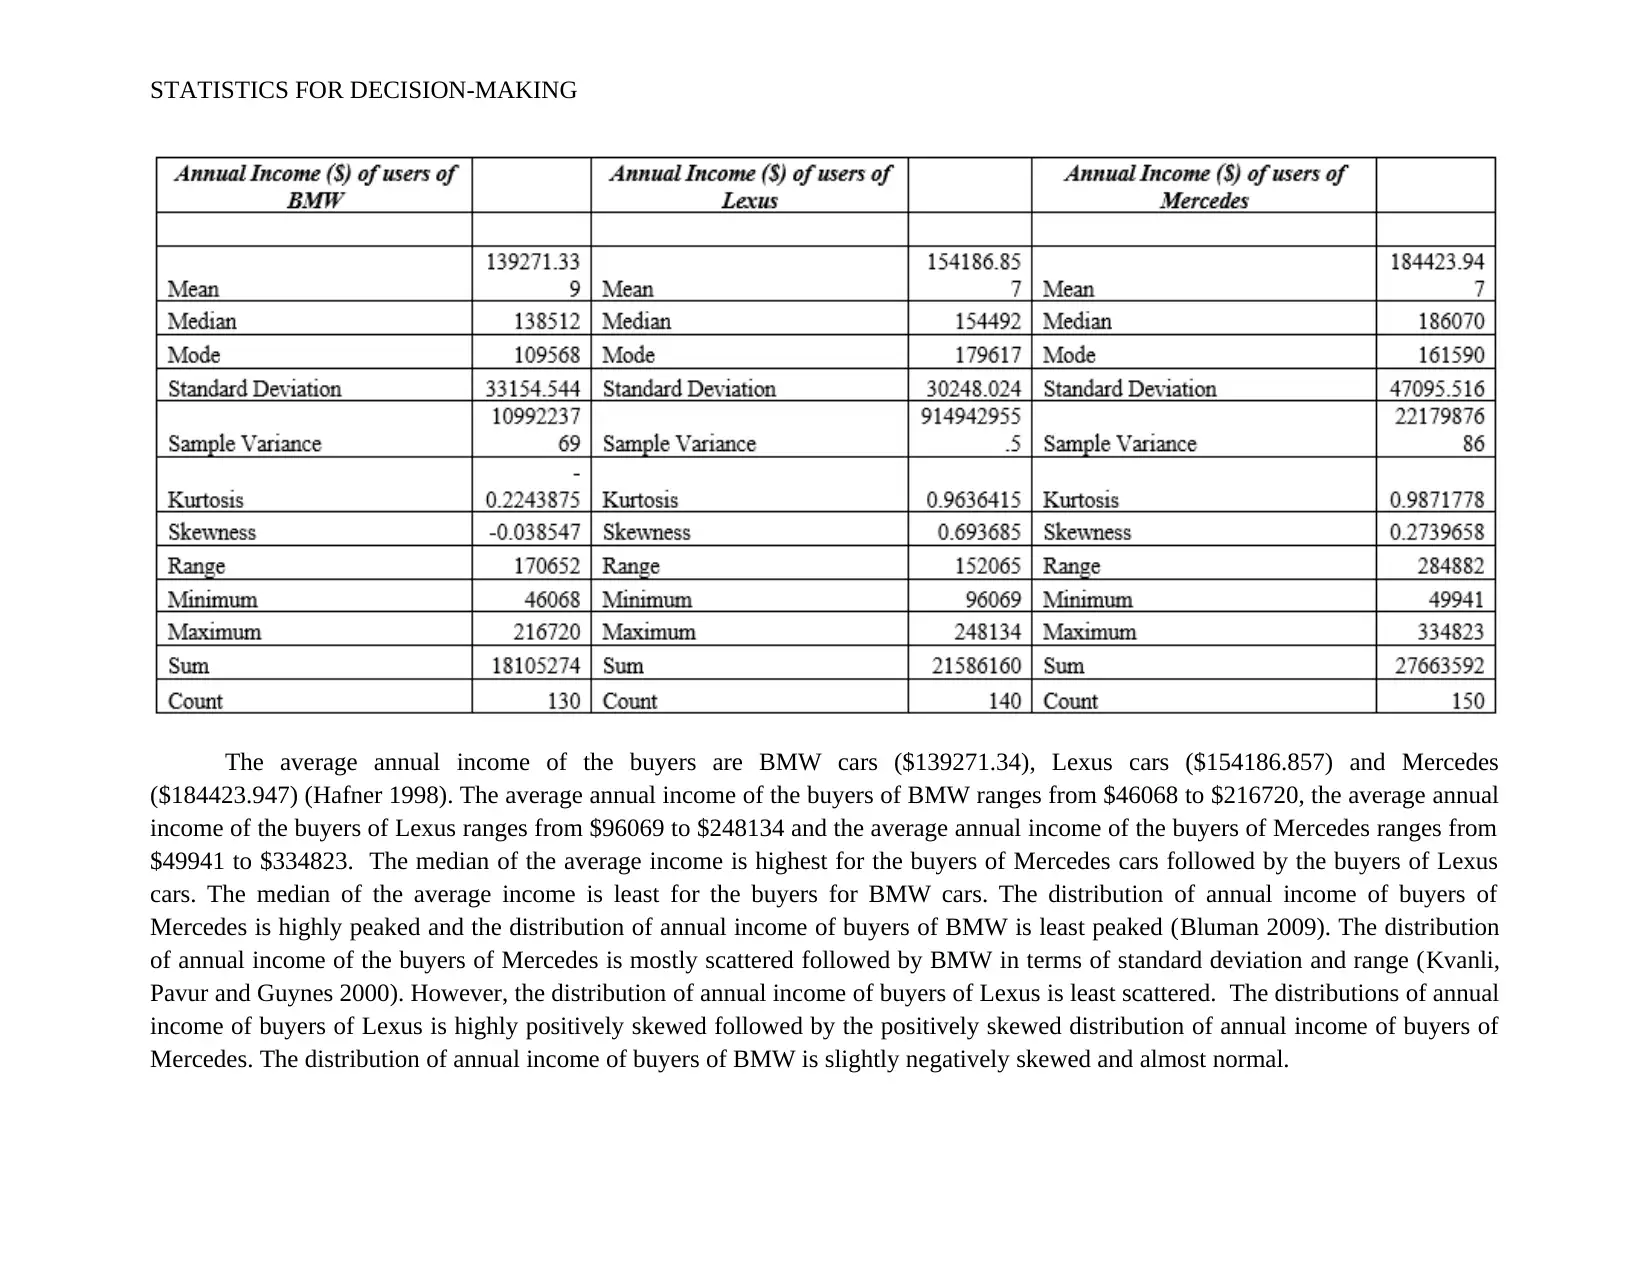
The average annual income of the buyers are BMW cars ($139271.34), Lexus cars ($154186.857) and Mercedes
($184423.947) (Hafner 1998). The average annual income of the buyers of BMW ranges from $46068 to $216720, the average annual
income of the buyers of Lexus ranges from $96069 to $248134 and the average annual income of the buyers of Mercedes ranges from
$49941 to $334823. The median of the average income is highest for the buyers of Mercedes cars followed by the buyers of Lexus
cars. The median of the average income is least for the buyers for BMW cars. The distribution of annual income of buyers of
Mercedes is highly peaked and the distribution of annual income of buyers of BMW is least peaked (Bluman 2009). The distribution
of annual income of the buyers of Mercedes is mostly scattered followed by BMW in terms of standard deviation and range (Kvanli,
Pavur and Guynes 2000). However, the distribution of annual income of buyers of Lexus is least scattered. The distributions of annual
income of buyers of Lexus is highly positively skewed followed by the positively skewed distribution of annual income of buyers of
Mercedes. The distribution of annual income of buyers of BMW is slightly negatively skewed and almost normal.
Paraphrase This Document
Need a fresh take? Get an instant paraphrase of this document with our AI Paraphraser
STATISTICS FOR DECISION-MAKING
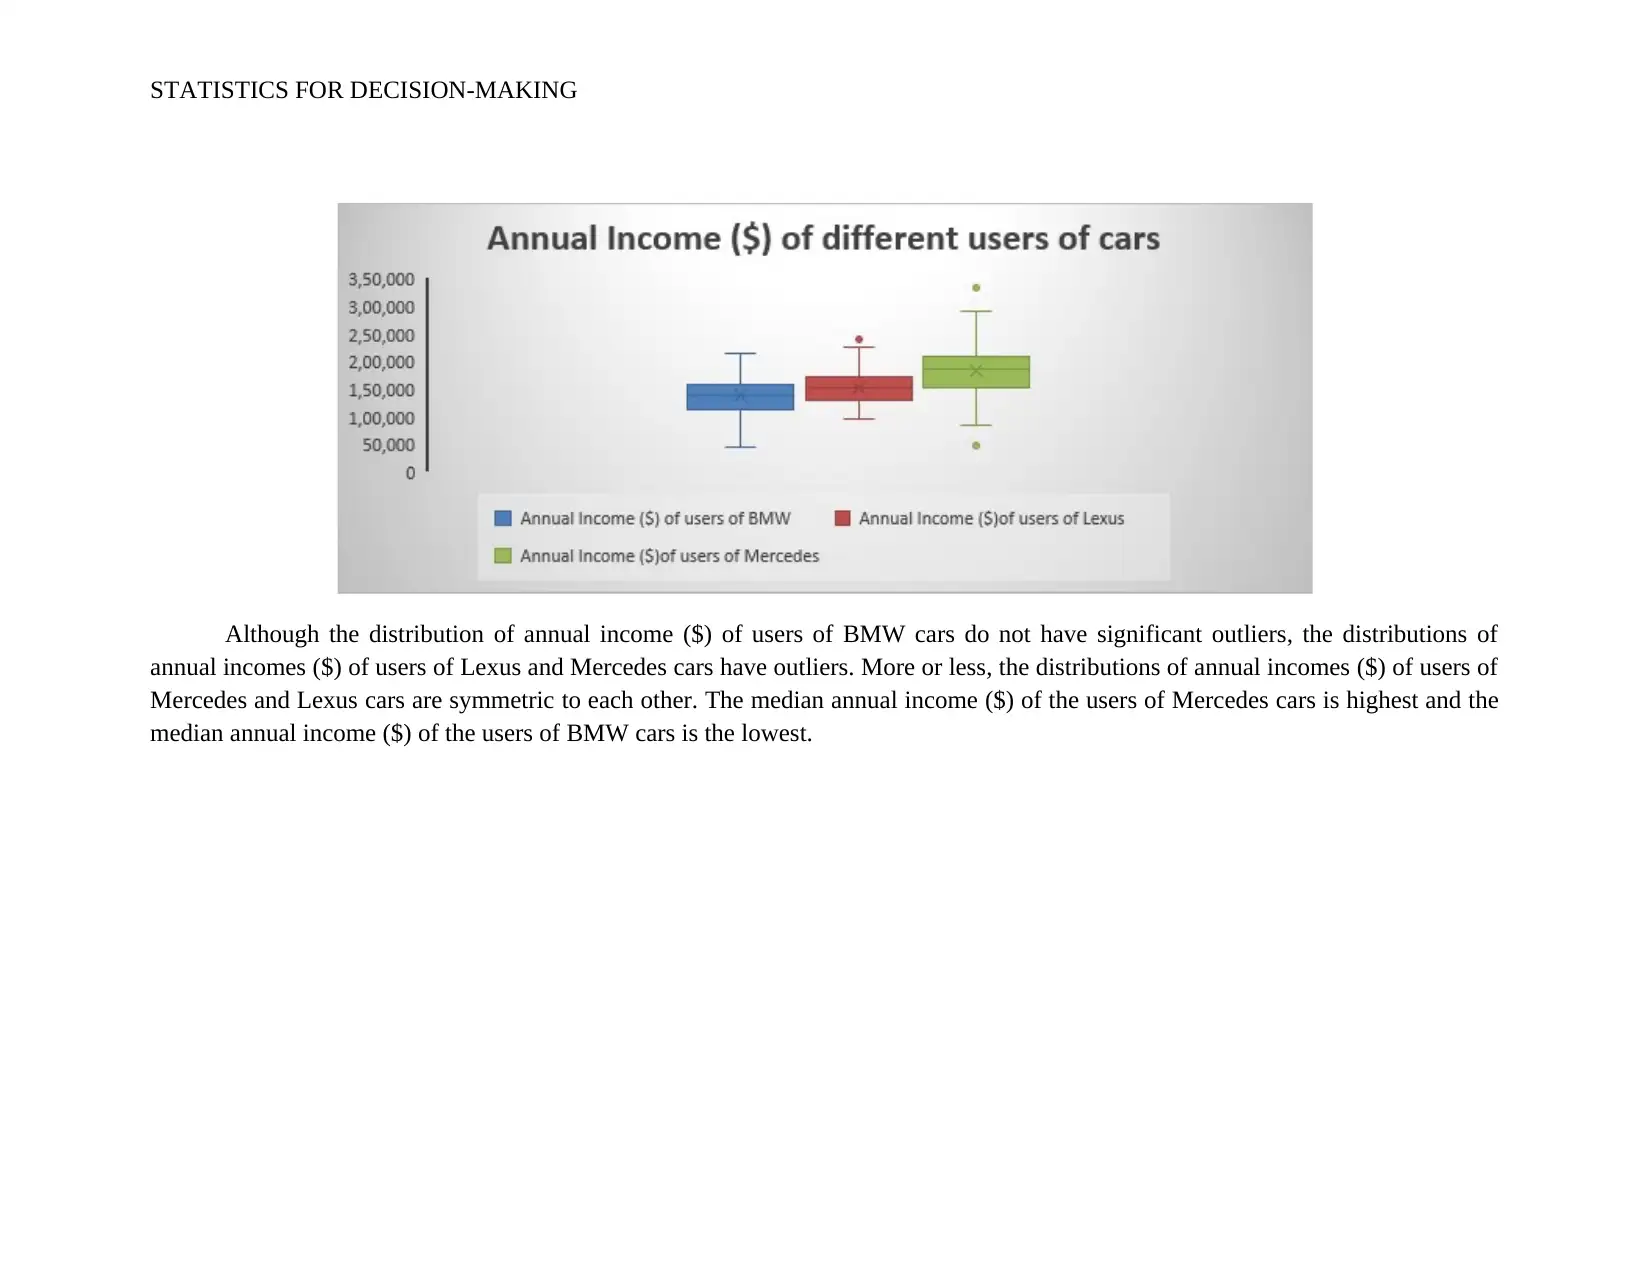
Although the distribution of annual income ($) of users of BMW cars do not have significant outliers, the distributions of
annual incomes ($) of users of Lexus and Mercedes cars have outliers. More or less, the distributions of annual incomes ($) of users of
Mercedes and Lexus cars are symmetric to each other. The median annual income ($) of the users of Mercedes cars is highest and the
median annual income ($) of the users of BMW cars is the lowest.
STATISTICS FOR DECISION-MAKING
50000 100000 150000 200000 250000 300000 350000 More
0
10
20
30
40
50
60
70
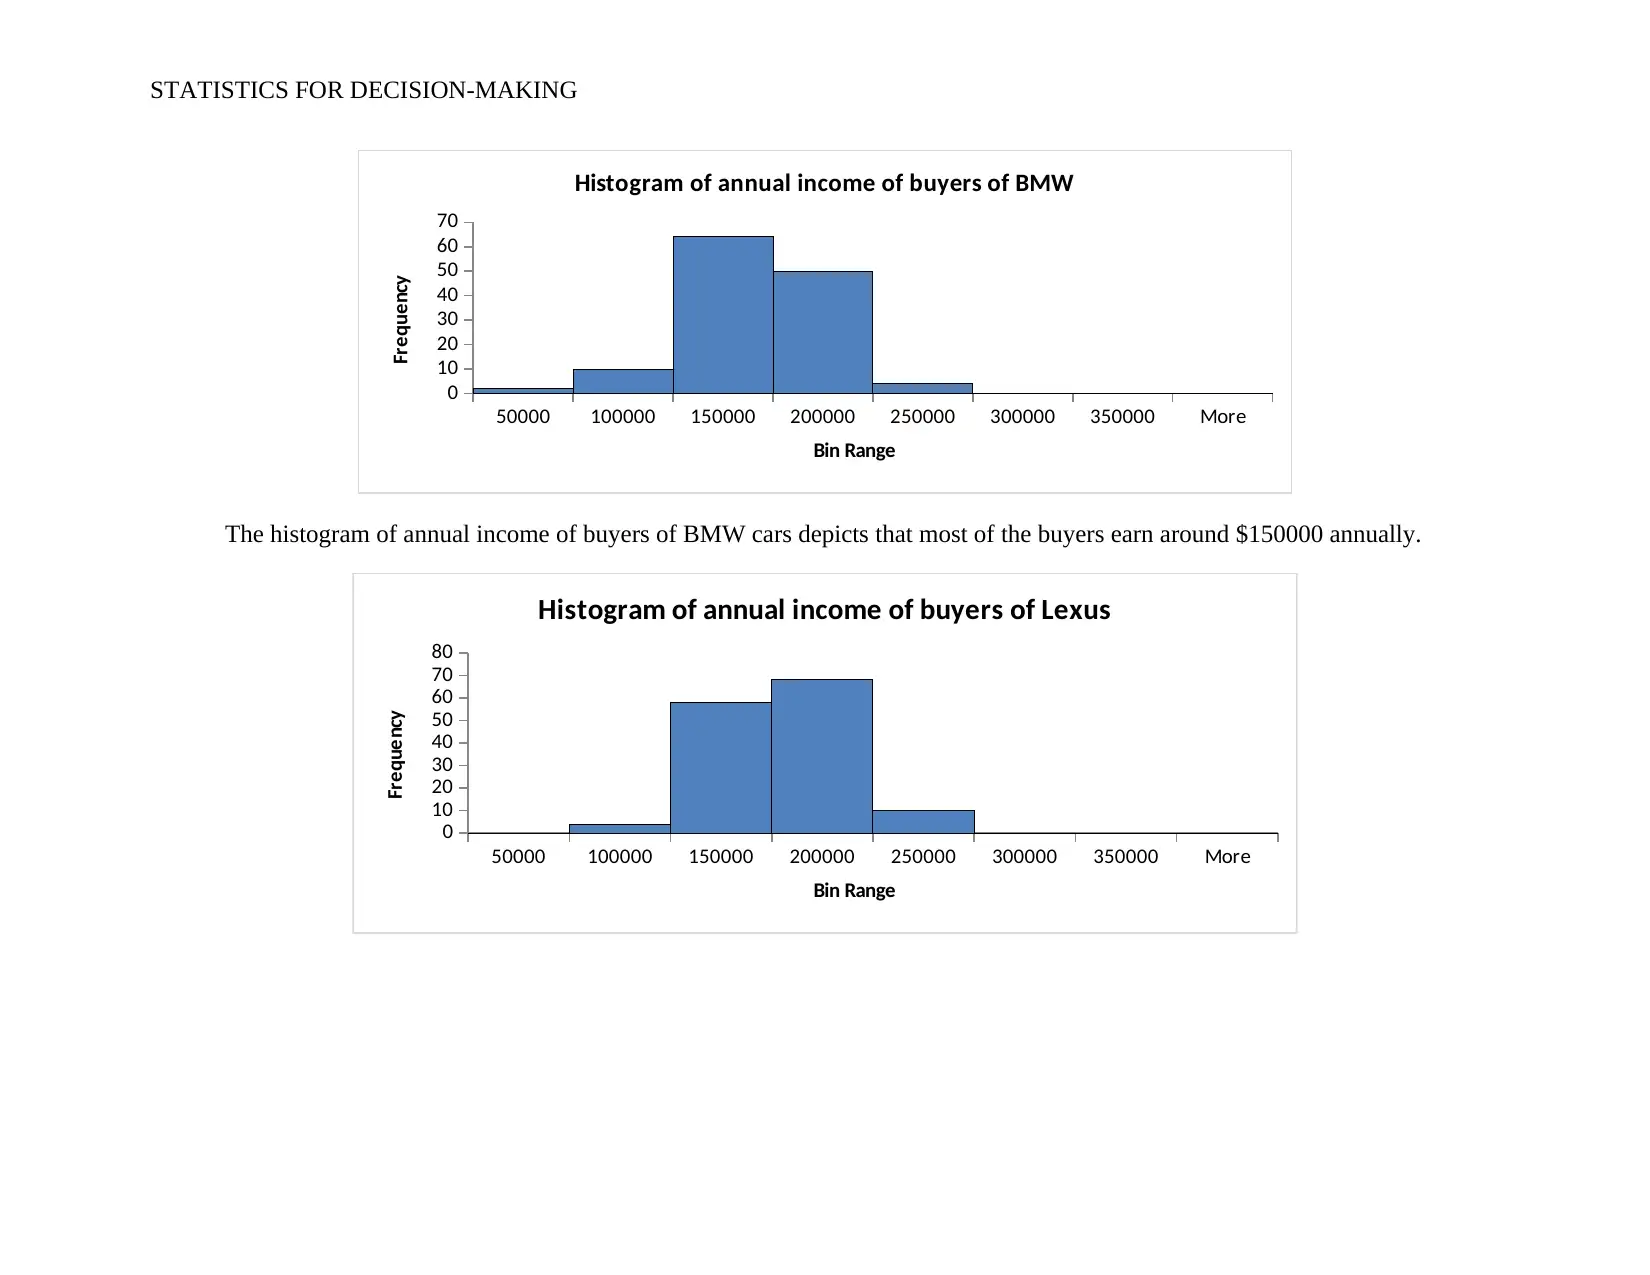
Histogram of annual income of buyers of BMW
Bin Range
Frequency
The histogram of annual income of buyers of BMW cars depicts that most of the buyers earn around $150000 annually.
50000 100000 150000 200000 250000 300000 350000 More
0
10
20
30
40
50
60
70
80
Histogram of annual income of buyers of Lexus
Bin Range
Frequency
50000 100000 150000 200000 250000 300000 350000 More
0
10
20
30
40
50
60
70
Histogram of annual income of buyers of BMW
Bin Range
Frequency
The histogram of annual income of buyers of BMW cars depicts that most of the buyers earn around $150000 annually.
50000 100000 150000 200000 250000 300000 350000 More
0
10
20
30
40
50
60
70
80
Histogram of annual income of buyers of Lexus
Bin Range
Frequency
⊘ This is a preview!⊘
Do you want full access?
Subscribe today to unlock all pages.
Trusted by 1+ million students worldwide
1 out of 27
Related Documents


Your All-in-One AI-Powered Toolkit for Academic Success.
+13062052269
info@desklib.com
Available 24*7 on WhatsApp / Email
![[object Object]](/_next/static/media/star-bottom.7253800d.svg)
Unlock your academic potential
Copyright © 2020–2026 A2Z Services. All Rights Reserved. Developed and managed by ZUCOL.