Statistics Report: Descriptive Analysis and Hypothesis Testing

Verified

Added on  2023/01/19

|18
|1122
|41
Report
AI Summary
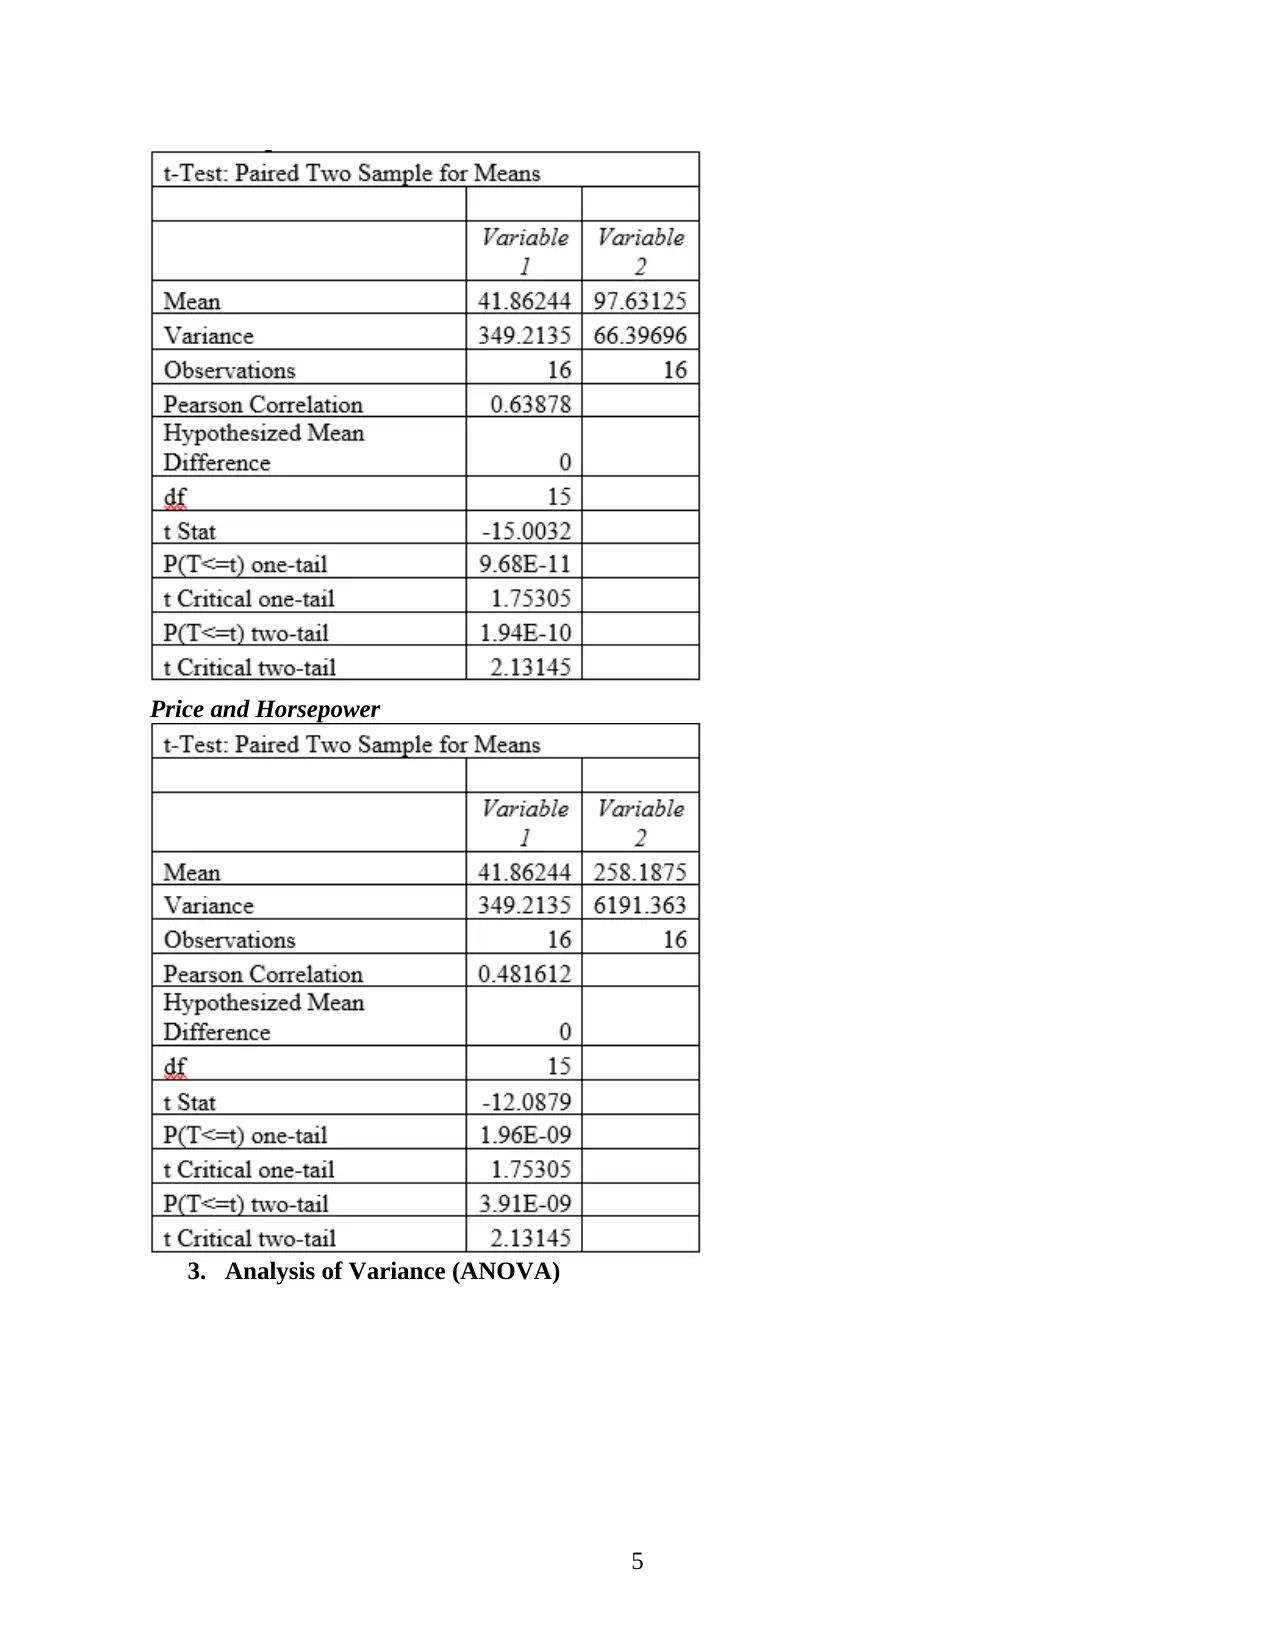
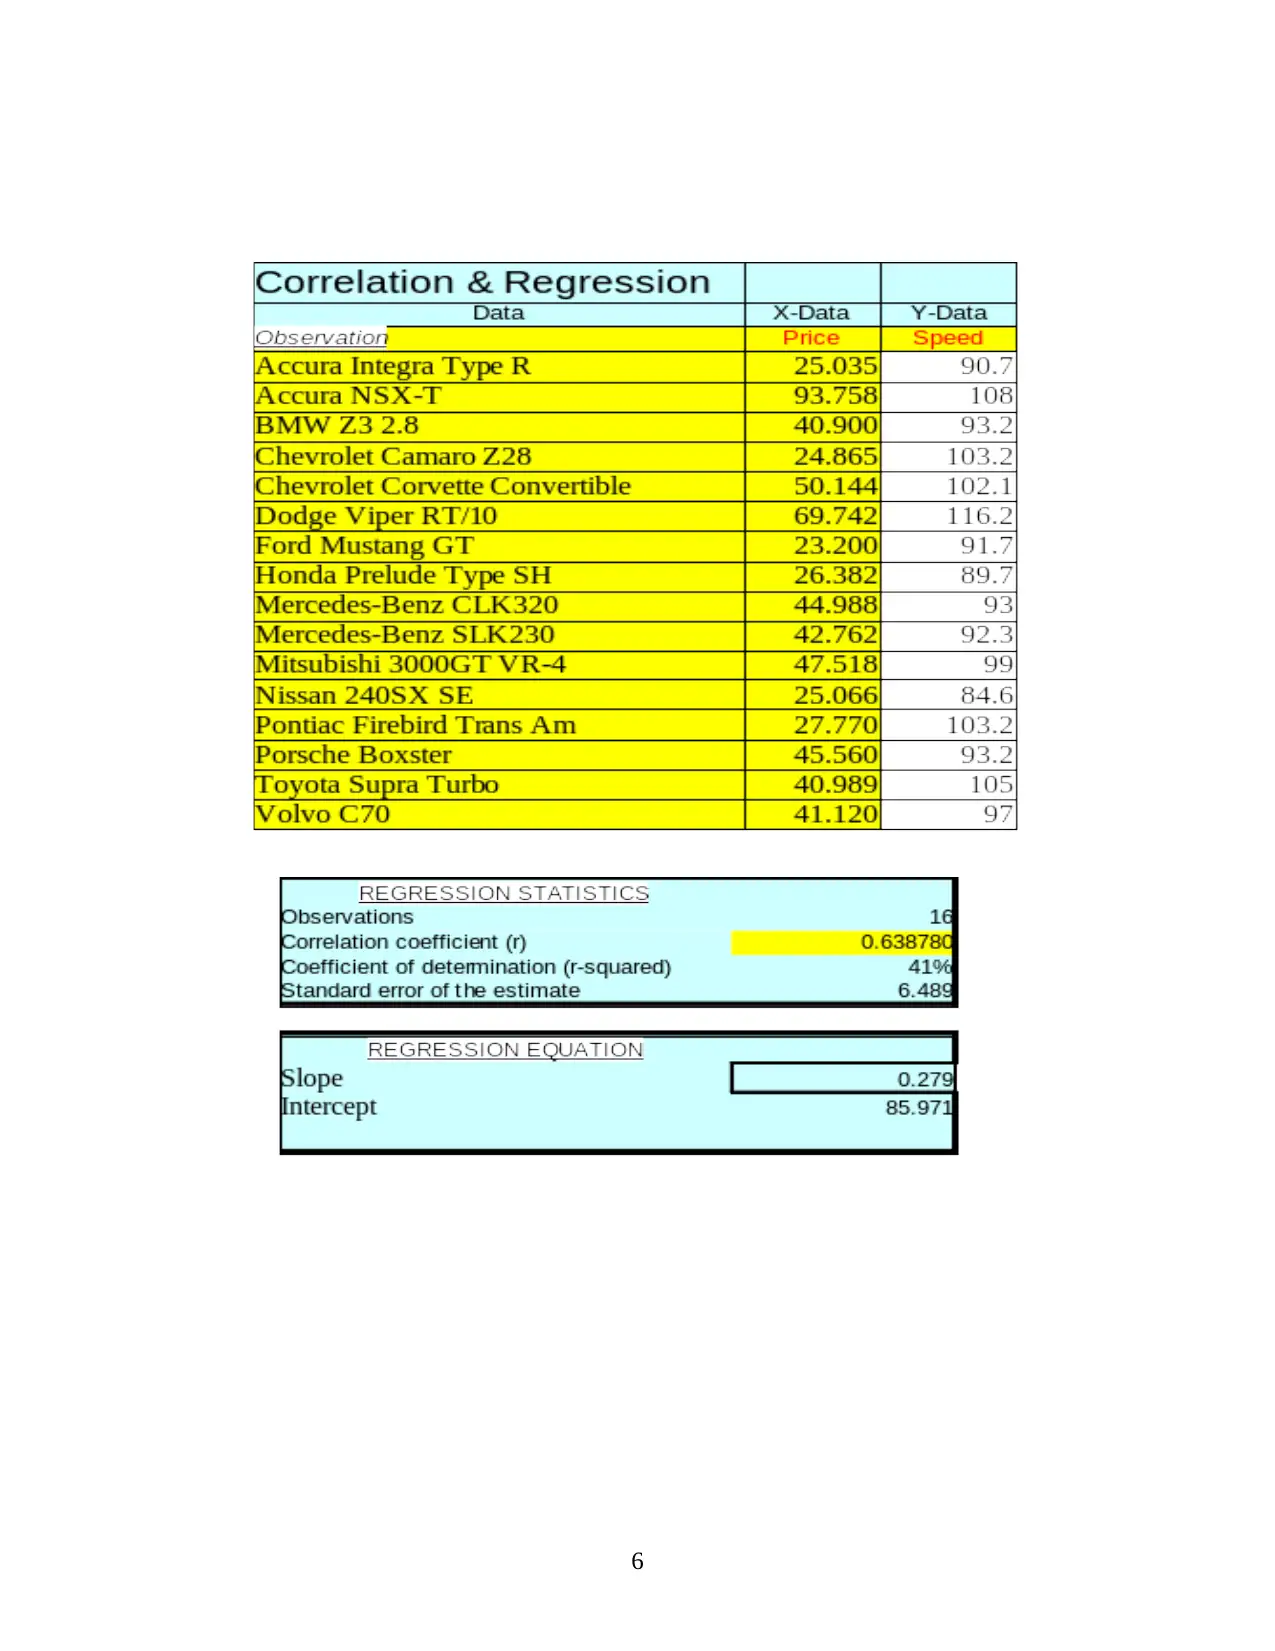
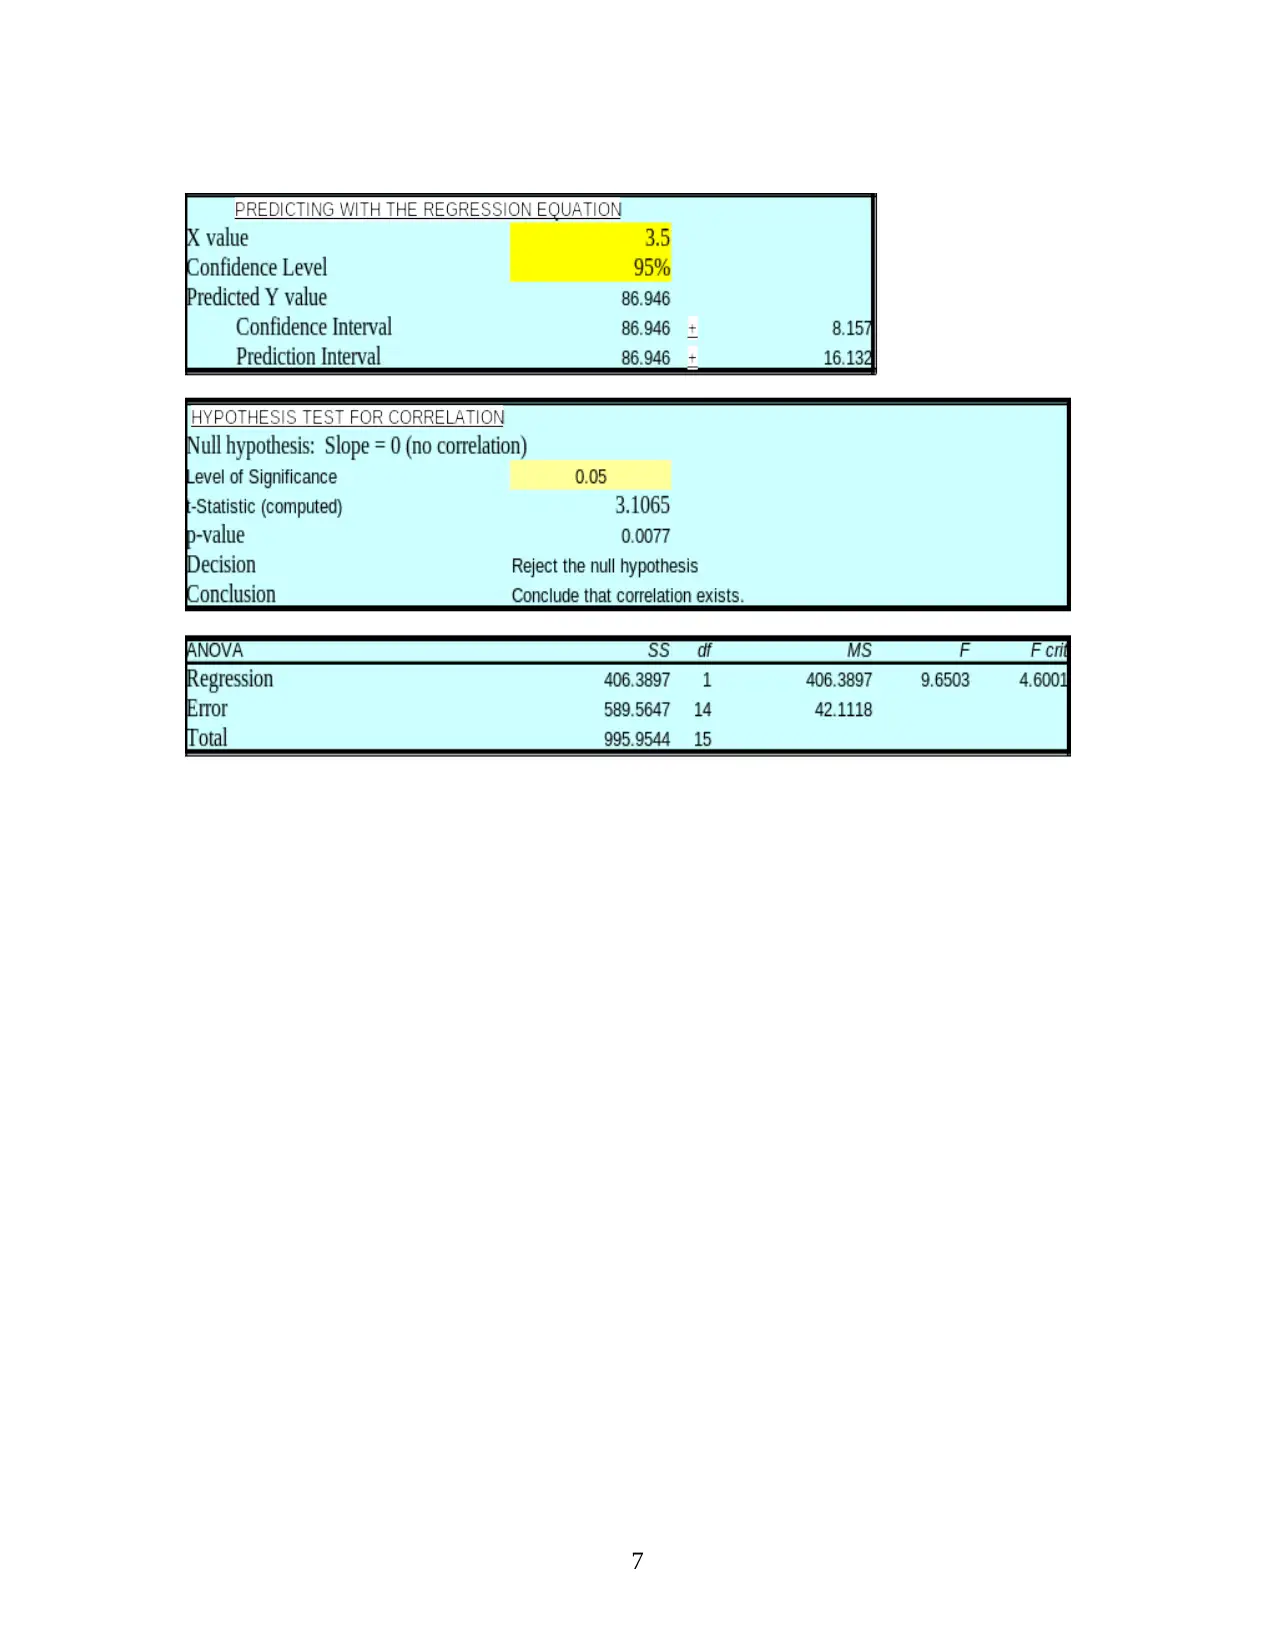
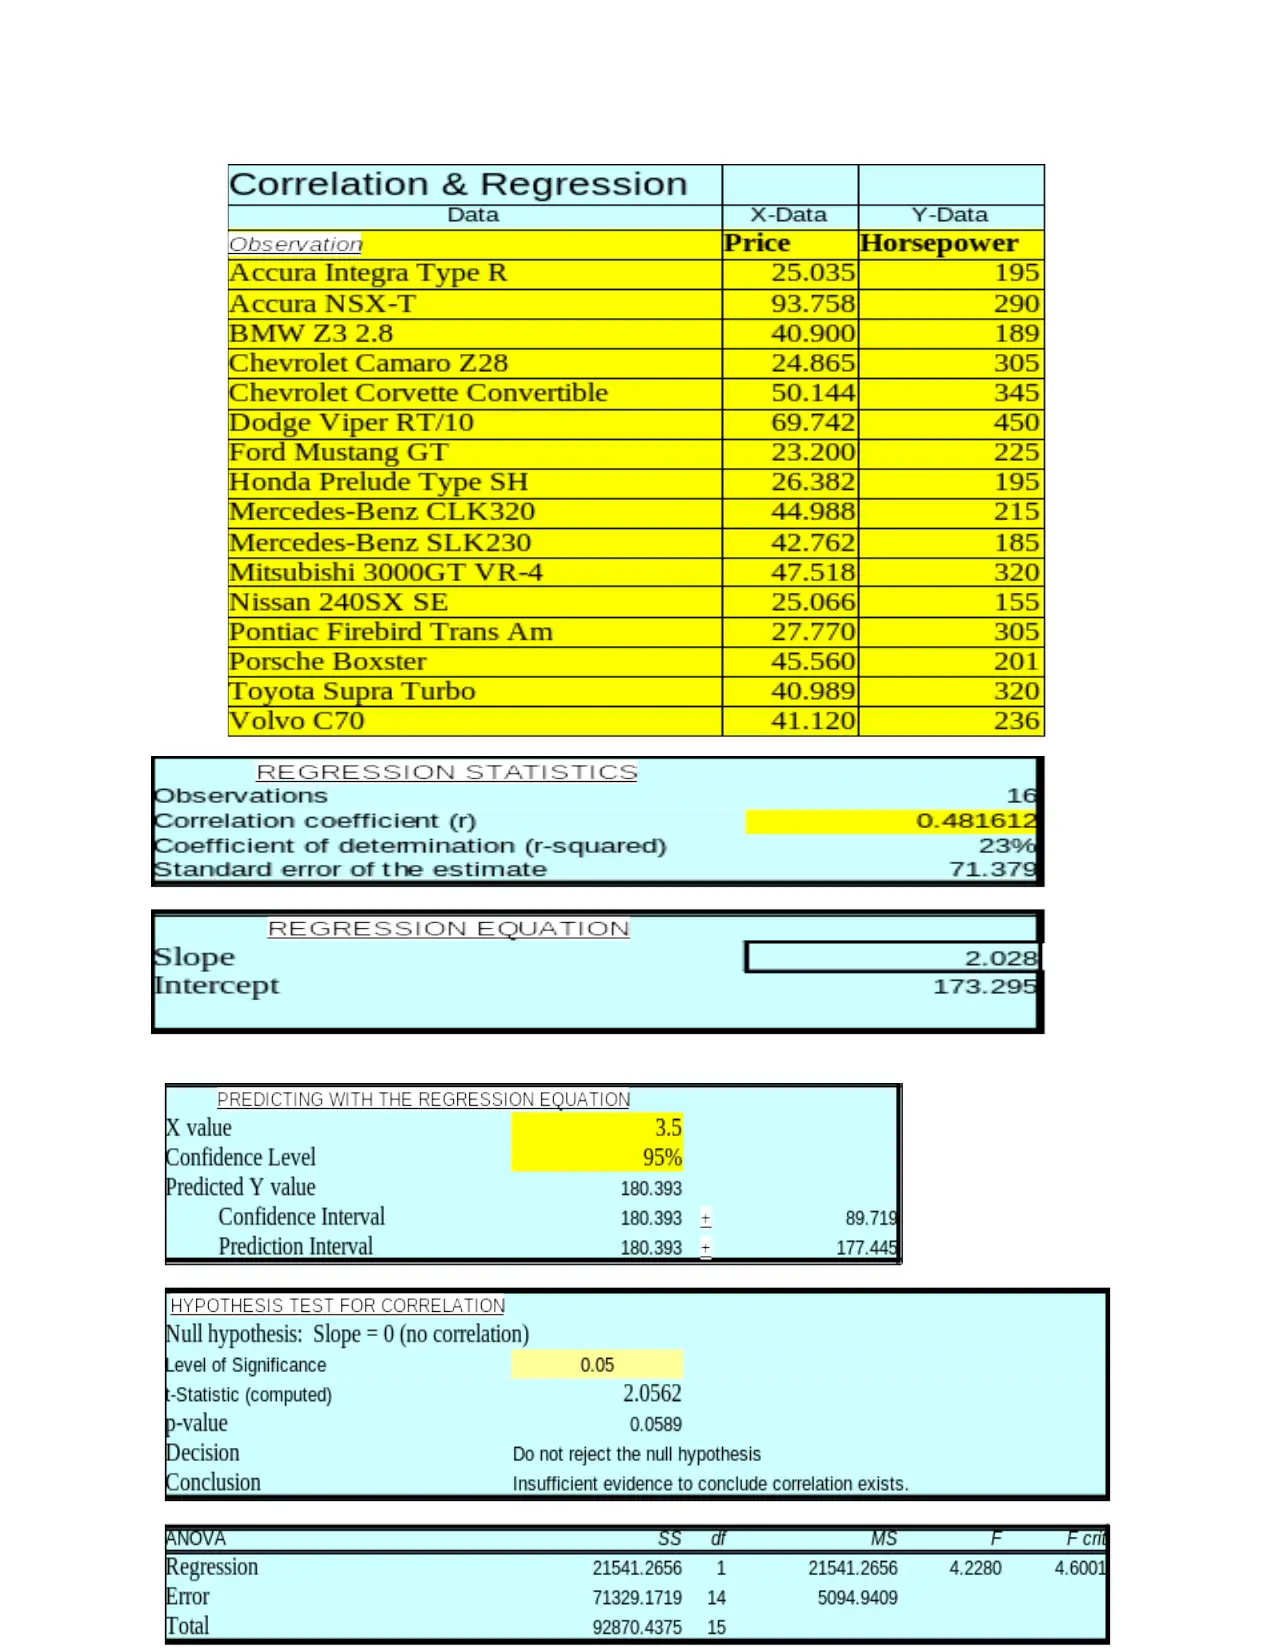
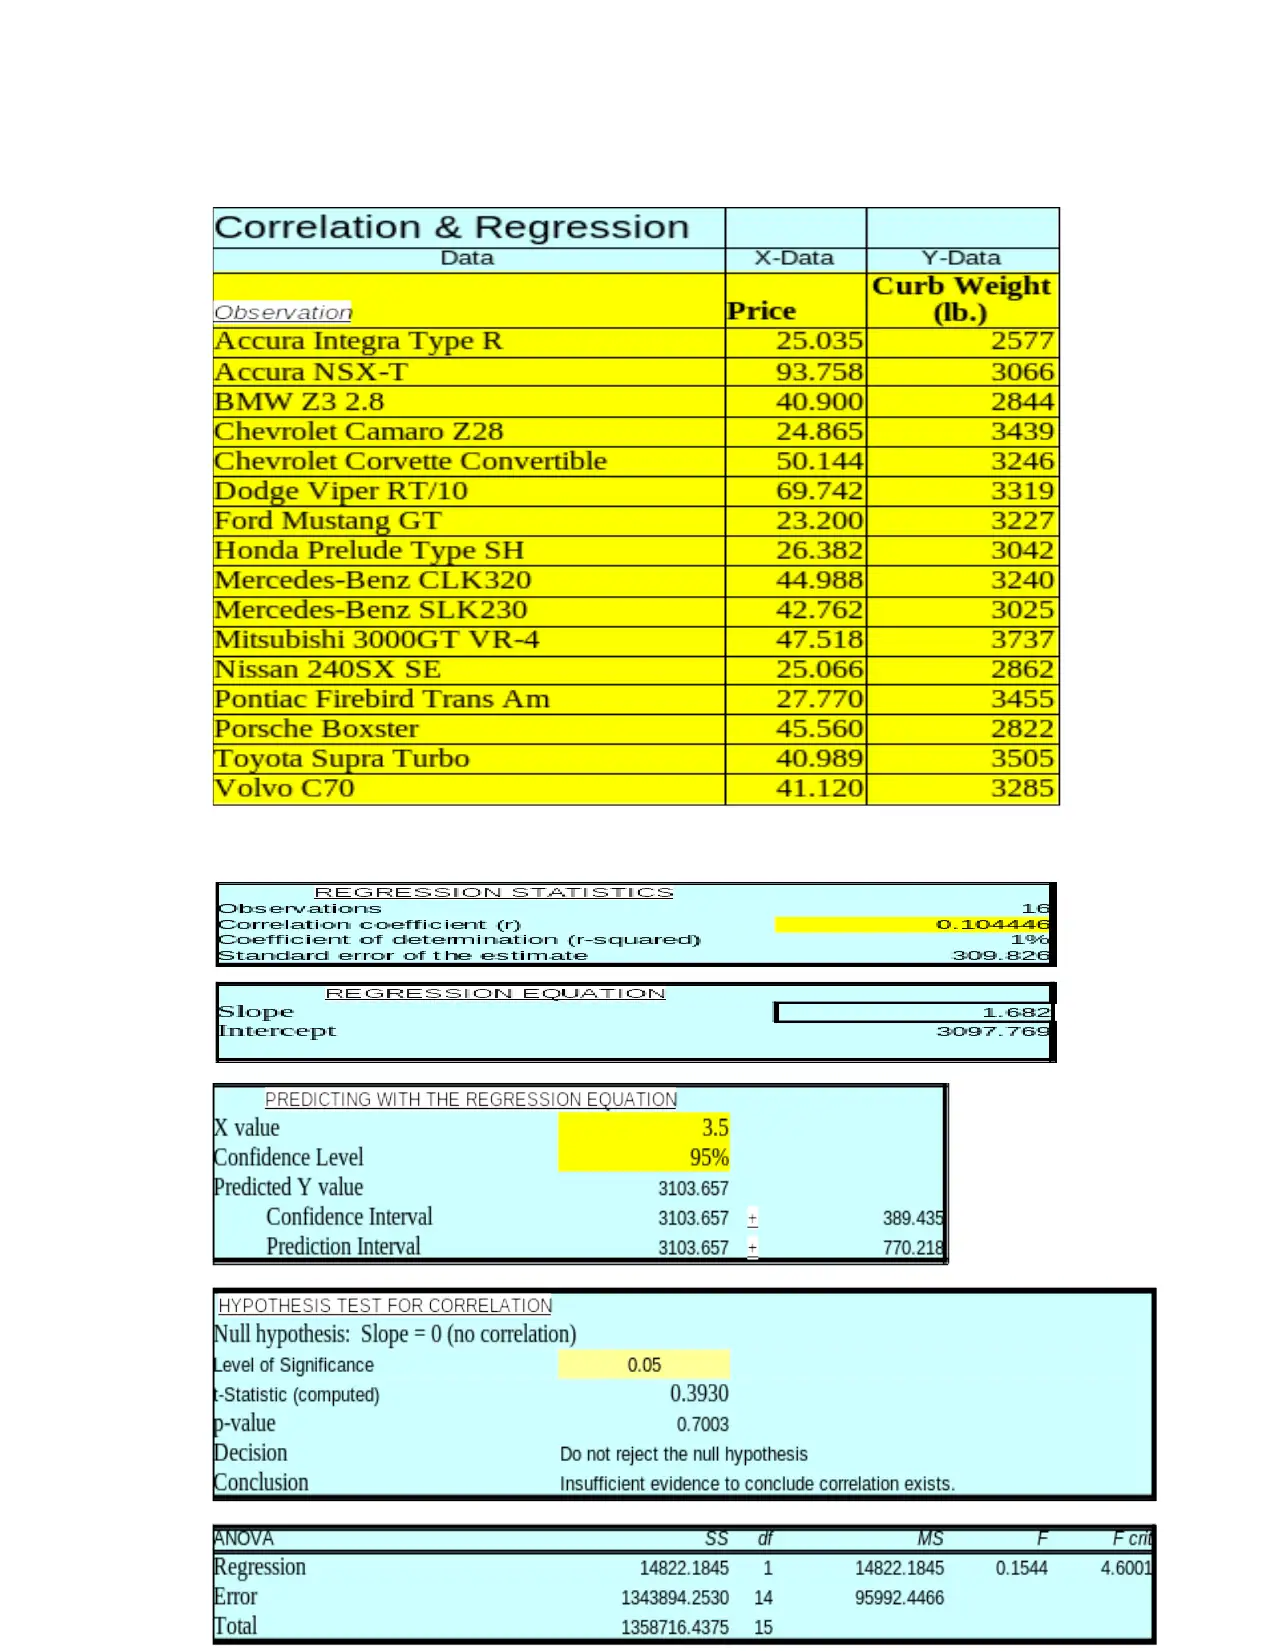
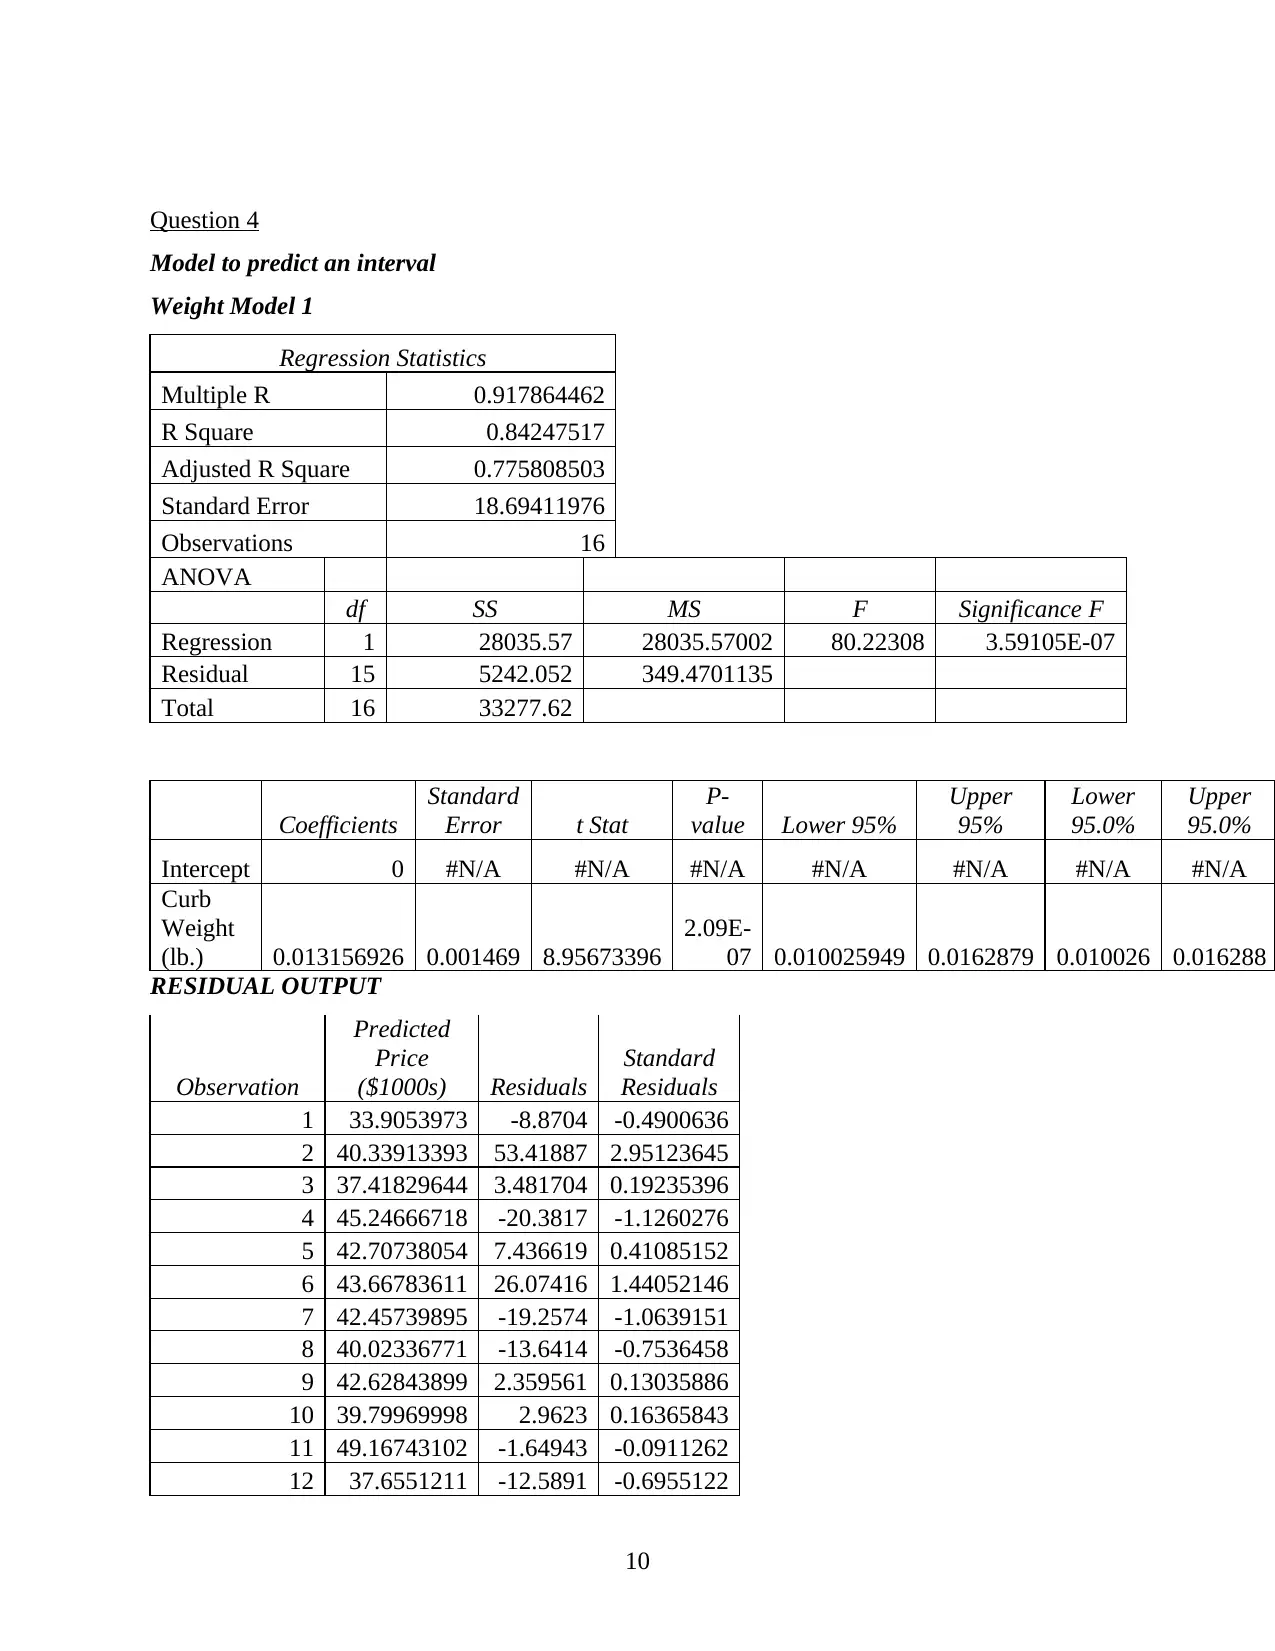
This report presents a comprehensive statistical analysis of car data, focusing on descriptive analysis, hypothesis testing, and model building. The report begins with an introduction to statistics and the variables used in the analysis: price, horsepower, curb weight, and speed. Descriptive analysis is performed on price and speed. The report then explores three types of hypothesis tests: Chi-square, t-test, and ANOVA, although the specific results for each test are not fully detailed. Finally, the report presents three regression models to predict the price of cars based on curb weight, horsepower, and speed. The report provides regression statistics, ANOVA tables, and residual outputs for each model, offering insights into the relationships between the variables and the models' predictive capabilities. The conclusion summarizes the key findings regarding the systematic process of gathering, collecting, analysing and developing results for different dependent and independent variables.
Document Page
Statistics
tabler-icon-diamond-filled.svg

Paraphrase This Document

Need a fresh take? Get an instant paraphrase of this document with our AI Paraphraser
Document Page
Contents
INTRODUCTION...........................................................................................................................1
TASK...............................................................................................................................................1
Question 1...............................................................................................................................1
Question 2...............................................................................................................................1
Question 3...............................................................................................................................2
Question 4.............................................................................................................................10
Conclusion.....................................................................................................................................14
Document Page
INTRODUCTION
In data analysis, a division of mathematics that is related with gathering classifying,
analysing and interpreting of numerical figures in order to make meaningful conclusions as per
the probability is known as statistic. The basic statistics includes descriptive analysis, correlation,
hypothesis test for dependent and independent variable which help in extracting suitable results
from large group of numeric information. In this report, descriptive analysis on any 2 interval 3
different hypothesis tests and model to predict an interval are discussed.
TASK
Question 1
In given assessment data of Sport and GT cars is given along with different variables like
price, horsepower, curb weight, speed, manufacture, V8 and GM Product. Here in assessment
major variables Price, Horsepower, Curb weight and Speed. All significant calculations and test
in assessment are conducted by using selected variables. Following are explanation and
relevance of these variables, as discussed below:
Price: This refers to market price or value of different car models.
Horsepower: It relates to power a car's engine produces.
Curb weight: Curb weight is aggregate weight of car with all standard equipments along
with essential operating consumables like transmission oil, motor oil, air
conditioning refrigerant, coolant and often full-tank fuel, while unloaded.
Speed: Car's speed at 1/4 mile (mph).
Question 2
Descriptive analysis
The first and most important part for conducting statistical analyses is descriptive
analysis that gives a detail idea about the distribution of data which support in detecting mistakes
and outliers and ensure to determine the connection among different variables. From the data
available the two variable that are selected for descriptive analysis are Price and Speed at ¼ mile
(mph).
1
Document Page
Question 3
Different type of Hypothesis test
2
tabler-icon-diamond-filled.svg

Paraphrase This Document

Need a fresh take? Get an instant paraphrase of this document with our AI Paraphraser
Document Page
1. Chi-square test
Price and Horsepower
a. 208 cells (100.0%) have expected count less than 5. The minimum
expected count is .06.
Price and Curb weight
a. 256 cells (100.0%) have expected count less than 5. The minimum
expected count is .06.
Price and Speed
3
Document Page
a. 224 cells (100.0%) have expected count less than 5. The minimum
expected count is .06.
2. t-test
Price and Curb weight
Price and speed
4
Document Page
Price and Horsepower
3. Analysis of Variance (ANOVA)
5
tabler-icon-diamond-filled.svg

Paraphrase This Document

Need a fresh take? Get an instant paraphrase of this document with our AI Paraphraser
Document Page
6
Document Page
7
Document Page
8
tabler-icon-diamond-filled.svg

Paraphrase This Document

Need a fresh take? Get an instant paraphrase of this document with our AI Paraphraser
Document Page
9
Document Page
Question 4
Model to predict an interval
Weight Model 1
Coefficients
Standard
Error t Stat
P-
value Lower 95%
Upper
95%
Lower
95.0%
Upper
95.0%
Intercept 0 #N/A #N/A #N/A #N/A #N/A #N/A #N/A
Curb
Weight
(lb.) 0.013156926 0.001469 8.95673396
2.09E-
07 0.010025949 0.0162879 0.010026 0.016288
RESIDUAL OUTPUT
Observation
Predicted
Price
($1000s) Residuals
Standard
Residuals
1 33.9053973 -8.8704 -0.4900636
2 40.33913393 53.41887 2.95123645
3 37.41829644 3.481704 0.19235396
4 45.24666718 -20.3817 -1.1260276
5 42.70738054 7.436619 0.41085152
6 43.66783611 26.07416 1.44052146
7 42.45739895 -19.2574 -1.0639151
8 40.02336771 -13.6414 -0.7536458
9 42.62843899 2.359561 0.13035886
10 39.79969998 2.9623 0.16365843
11 49.16743102 -1.64943 -0.0911262
12 37.6551211 -12.5891 -0.6955122
10
Regression Statistics
Multiple R 0.917864462
R Square 0.84247517
Adjusted R Square 0.775808503
Standard Error 18.69411976
Observations 16
ANOVA
df SS MS F Significance F
Regression 1 28035.57 28035.57002 80.22308 3.59105E-07
Residual 15 5242.052 349.4701135
Total 16 33277.62
chevron_up_icon
1 out of 18
circle_padding
hide_on_mobile
zoom_out_icon
[object Object]