MGT723 Research: Climate Change, Carbon Emission & Company Size
VerifiedAdded on 2023/06/06
|15
|3336
|369
Report
AI Summary
This research report investigates the relationship between company size (measured by energy consumption) and carbon emissions, considering the influence of climate change policies. It uses data from the CDP survey, focusing on companies in Canada, the United States of America, and Brazil. The study examines variables such as climate change integration, percentage investment in energy, and carbon emission reduction, using descriptive statistical analysis to test the hypothesis that a relationship exists between company size and carbon emissions. The conceptual model highlights the interplay between these variables, with the aim of providing insights applicable to companies across various industries in the Americas, while acknowledging potential limitations due to regional specificities. The report also touches upon stakeholder theory, emphasizing the role of stakeholders in influencing corporate environmental responsibility.
MGT723 Research Project
Semester 2 2018
Assessment Task 2: Data Collection
Student Name: Sai paneendar reddy
Draft Research Question: “Is Carbon emission directly proportional to size of
the company (in terms of energy consumption)?”
Title: Significance of climate change amongst stakeholders of different
companies
Submission Date:
Acknowledgement:
I certify that I have carefully reviewed the university’s academic misconduct policy. I understand that
the source of ideas must be referenced and that quotation marks and a reference are required when
directly quoting anyone else’s words.
Note that you are permitted to change your research question and hypothesis as your research
project develops over the semester. If you make changes you should note, however, that you will
need to update your conceptual model, hypothesis, theoretical constructs and proxy measures
accordingly. Although these not assessed directly, your submission in Task 2 and Task 3 will be
evaluated in the context of your stated conceptual model etc.
Paraphrase This Document
Need a fresh take? Get an instant paraphrase of this document with our AI Paraphraser
INTRODUCTION
Various governments around the globe have passed legislation touching on the issue of
climate change. These legislations are expected to reflect on the reduction in the amount of
carbon emissions in the respective countries. The legislations are however dependent on
the implementation by the relevant governments’ agencies and most importantly
compliance from the stakeholders in the climate change agenda.
The size of the company, measured in terms of the energy consumption is a key indicator of
the company’s role in Climate Change. The higher the energy consumption the bigger the
company’s role in climate change.
This research paper investigates the roles that legislation and size of a company in terms of
energy consumption, have in climate change. This is done by citing the case of three
countries in the Americas; Canada, United States of America and Brazil.
2 | P a g e
LITERATURE REVIEW - SUMMARY
Industrial contribution to activities that have fuelled this fast change in ecological conditions
leading to catastrophic implications for the future generations have been since then widely
discussed and addressed across all spheres. Industrial role in curbing climate change is
therefore pose to be one of the prime challenges today (Liesen et al. 2015).
Taking into cognizance the social awareness as well as the real threat to the future
implications, companies have been drawing up strategic policies that work to curb activities
which are identified as the sources of the problem and committing to report on their
activities as checks to such behaviour (Bebbington and Larrinaga 2014).
Greenhouse and carbon emission are one of the main information that many organizations
are expected and encouraged to disclose as per of the carbon disclosure project (CDP). This
is done with the motivation to reveal the strategies and commitment of the firms to reduce
their carbon output which is one of the main avenues by which industries have affected
climate (Hahn, Reimsbach and Schiemann 2015.).
Stakeholder theory deals with the ethical aspect of the managerial division of a business or
any other organization. It is a conceptual frame work for policy making that considers the
moral accountability of the organization and its management (R Edward freeman).
According to the normative theory of identifying stakeholders, any person or a group of
people or another organisation who may or may not be an internal member of the
organization with whom the organization’s interest ally is a stakeholder. They include
consu3mers, shareholders as well as competitors and partners. The first people who come
to mind when considering who holds the stakes at an organization are the shareholders.
However beside the obvious, stakeholders include all whose actions and contributions
influence company performance, like employees, customers and business associates other
than shareholders (Bridoux and Stoelhorst 2014). These people hold the position to
continuously challenge the organisation in how they manage and allocate their resources
thus influencing their operational policies (Herold, Lee and Gunarathne 2018).
The stakeholder salience theory speaks about how stakeholders influence the management
in their decision making process. They argue that stakeholders such as the consumers,
shareholders as well as competitors and partners who may build pressure on certain issues
could influence management to come up with the disclosure data as a testament to their
commitment (de Aguiar and Bebbington 2014).
This can be attributed to the fact that this issues touches all of society including the
stakeholders and the rising concern about climate change and the perceived accountability
of the organizations by the stakeholders places certain expectations from stakeholders onto
the company. The organization in response to these expectations would give first priority to
its stakeholders and align their operational strategy along the interest of the stakeholders
(Herold, Lee, and Gunarathne 2018).
3 | P a g e
⊘ This is a preview!⊘
Do you want full access?
Subscribe today to unlock all pages.
Trusted by 1+ million students worldwide

However, none of those have been seen to be consistent. Again, existing research, notable
among which is Schreck and Raithel (2018) shows that firms commit to reporting on
emissions out of the belief that by doing so they would establish image as environmentally
conscious and therefore cater to the growing environmentally conscious consumers in the
market. Liesen (2015). This study in particular makes use of stakeholder theory and
statistical data analysis to explore the problem using empirical research.
The following section shows the conceptual model of the study. The control variable for this
case focuses on the market pressures from consumers that is experienced by the firms and
how they may interact with the size of the firm.
4 | P a g e
Paraphrase This Document
Need a fresh take? Get an instant paraphrase of this document with our AI Paraphraser
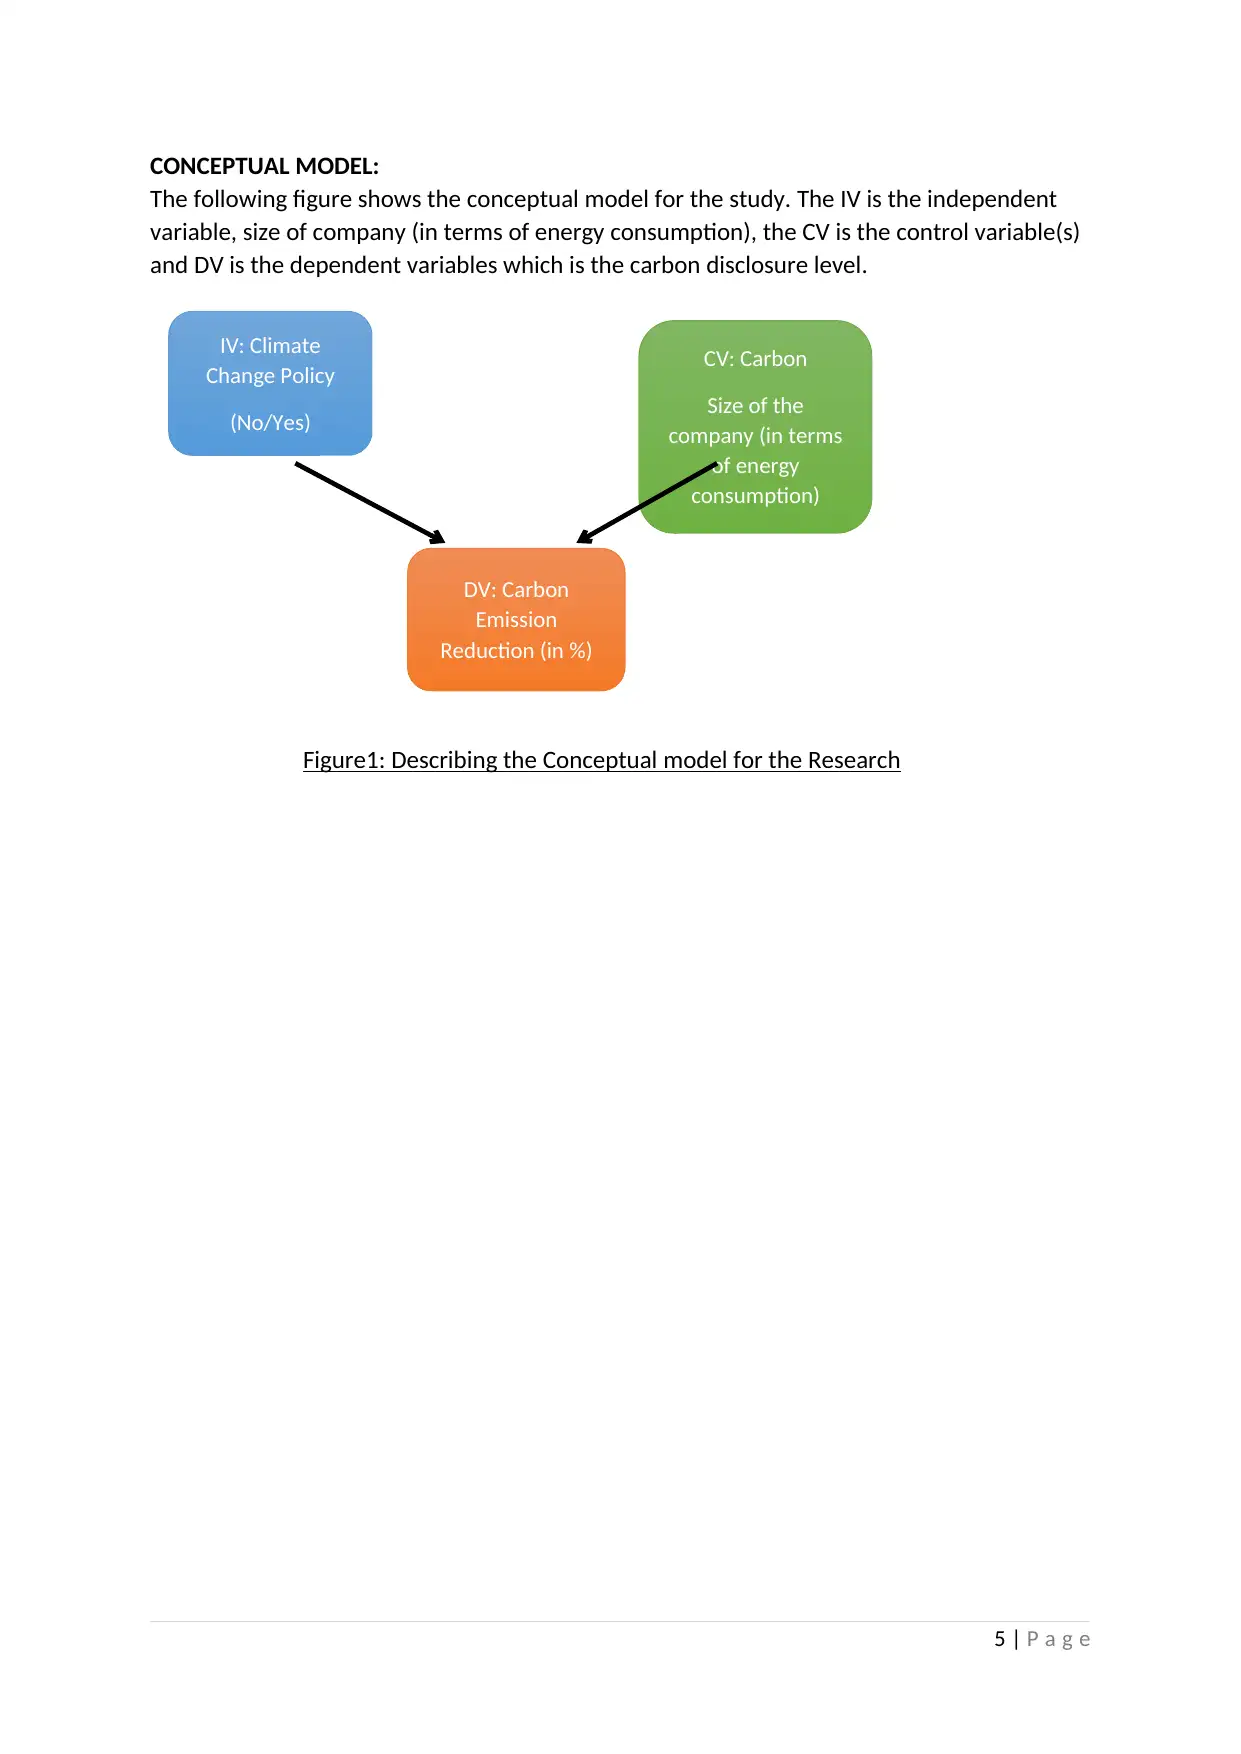
CONCEPTUAL MODEL:
The following figure shows the conceptual model for the study. The IV is the independent
variable, size of company (in terms of energy consumption), the CV is the control variable(s)
and DV is the dependent variables which is the carbon disclosure level.
Figure1: Describing the Conceptual model for the Research
5 | P a g e
IV: Climate
Change Policy
(No/Yes)
CV: Carbon
Size of the
company (in terms
of energy
consumption)
DV: Carbon
Emission
Reduction (in %)
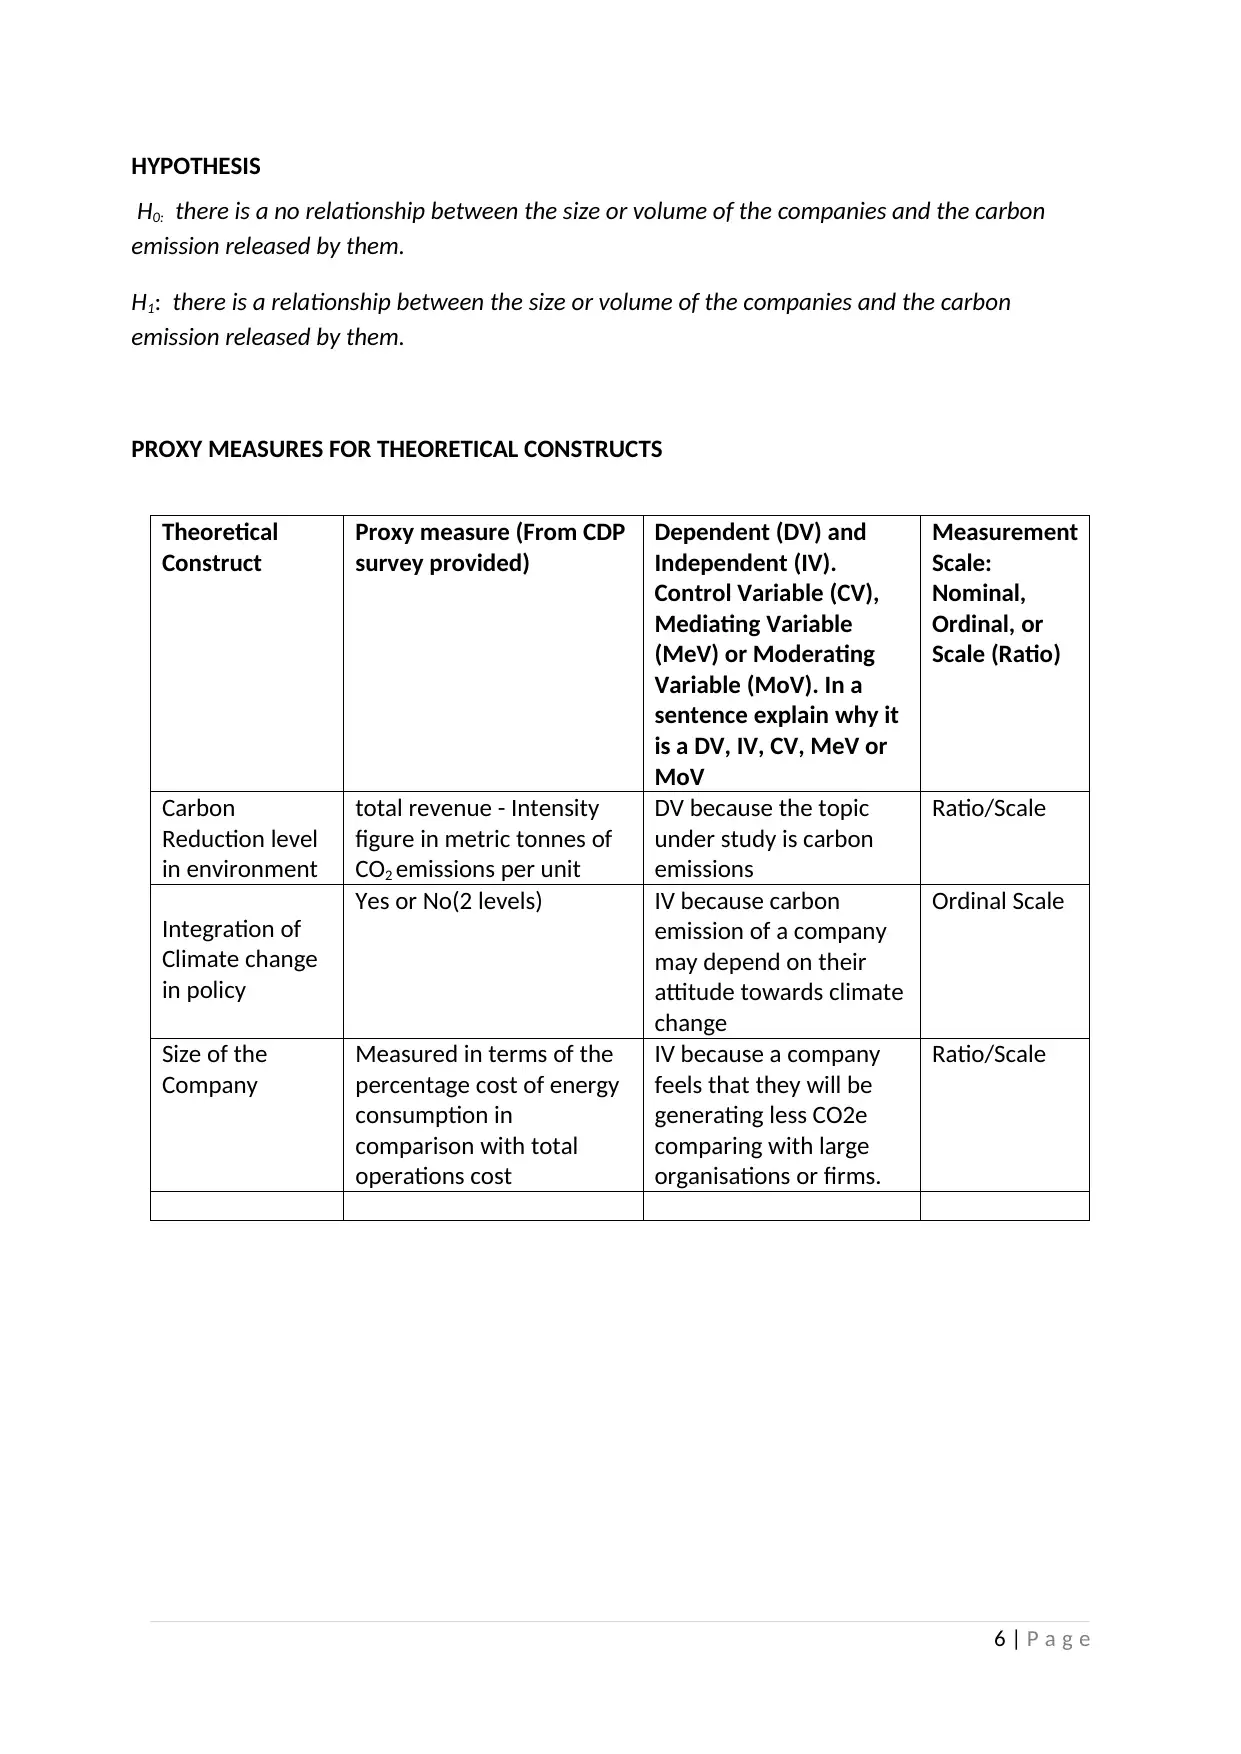
HYPOTHESIS
H0: there is a no relationship between the size or volume of the companies and the carbon
emission released by them.
H1: there is a relationship between the size or volume of the companies and the carbon
emission released by them.
PROXY MEASURES FOR THEORETICAL CONSTRUCTS
Theoretical
Construct
Proxy measure (From CDP
survey provided)
Dependent (DV) and
Independent (IV).
Control Variable (CV),
Mediating Variable
(MeV) or Moderating
Variable (MoV). In a
sentence explain why it
is a DV, IV, CV, MeV or
MoV
Measurement
Scale:
Nominal,
Ordinal, or
Scale (Ratio)
Carbon
Reduction level
in environment
total revenue - Intensity
figure in metric tonnes of
CO2 emissions per unit
DV because the topic
under study is carbon
emissions
Ratio/Scale
Integration of
Climate change
in policy
Yes or No(2 levels) IV because carbon
emission of a company
may depend on their
attitude towards climate
change
Ordinal Scale
Size of the
Company
Measured in terms of the
percentage cost of energy
consumption in
comparison with total
operations cost
IV because a company
feels that they will be
generating less CO2e
comparing with large
organisations or firms.
Ratio/Scale
6 | P a g e
⊘ This is a preview!⊘
Do you want full access?
Subscribe today to unlock all pages.
Trusted by 1+ million students worldwide
DATA ANALYSIS - DESCRIPTIVE
The sample data contains information on firms from all the industries that were available in
the original dataset of the CDP Survey. The decision to include all the available industries
was informed by the acknowledgement that every industry is a contributor to climate
change.
An industry might be at the final stage in the cycle of a product, such as at a shopping mall,
but the industry remains responsible for the other stages that the product has gone
through. These stages start from the raw material stage all through to the supply chain.
Therefore this research considers all the firms form all the available industries in the
analysis.
The sample data has six different variables; Account Name, Country, GRI, Climate Change
Integration, Percentage Investment in Energy and Carbon Emission Reduction.
The Account Name Variable represents the name of the firm or company whose data is
being collected for analysis. In this research, this variable will be a control variable (CV).
The Country Variable represent the country in which the firm or company is located. For the
purpose of this research paper, consideration has been given to the Americas. The data was
collected for countries that are located in the following countries in the Americas; Canada,
United States of America and Brazil. These four countries represent the four biggest
economies in the Americas. The countries are high industrialized, hence making climate
change an issue of interest in these countries. In this research, this variable will be a control
variable (CV).
The GRI variable represents the nature of industry in which the firm operates. The research
covers all the available industries from the CDP Survey dataset. This is aimed at get the net
effect on all industries. In this research, this variable will be a control variable (CV).
The Climate Change Integration variable represents the integration of the climate change
agenda and policies into the operations of the firm or company in question. This variable
represents information on whether this has been done or not. In this research, this variable
will be an Independent Variable (IV)
The Percentage Investment in Energy is variable that is representative of the size of the firm
or company. This variable measures the size of the company by its rate of energy
consumption. The higher the rate energy consumption of the company the larger the part
the company has to play in climate change. The variable represents the percentage of the
company’s total operational cost was spent on energy. In this research, this variable will be
an Independent Variable (IV).
The Carbon Emission Reduction variable represents the percentage reduction in carbon
emissions between for the year 2012. The research considers one year as the period of
study for the trend in carbon emissions for the firms and company’s in question. In this
research, this variable will be the Dependent Variable (DV).
The results from the analysis represented in this paper can generally be considered as
reliable and applicable for all the firms and companies in the Americas regardless of which
industry the fall. The conclusions are however limited to the Americas and can only be
applied to other regions in the world with extreme caution. The Americas may have political
7 | P a g e
Paraphrase This Document
Need a fresh take? Get an instant paraphrase of this document with our AI Paraphraser
environment, social environment or economic environment that is specific for that region
and significantly different from other regions globally.
However, the choice of countries (that is: Canada, United States of America and Brazil) does
represent both Developed and Developing worlds. This can therefore allow the conclusions
from the analysis in this research paper to be applicable globally to some extent.
The sample data had no missing values. The data was collected for 60 firms from the three
countries; Canada, United States of America and Brazil.
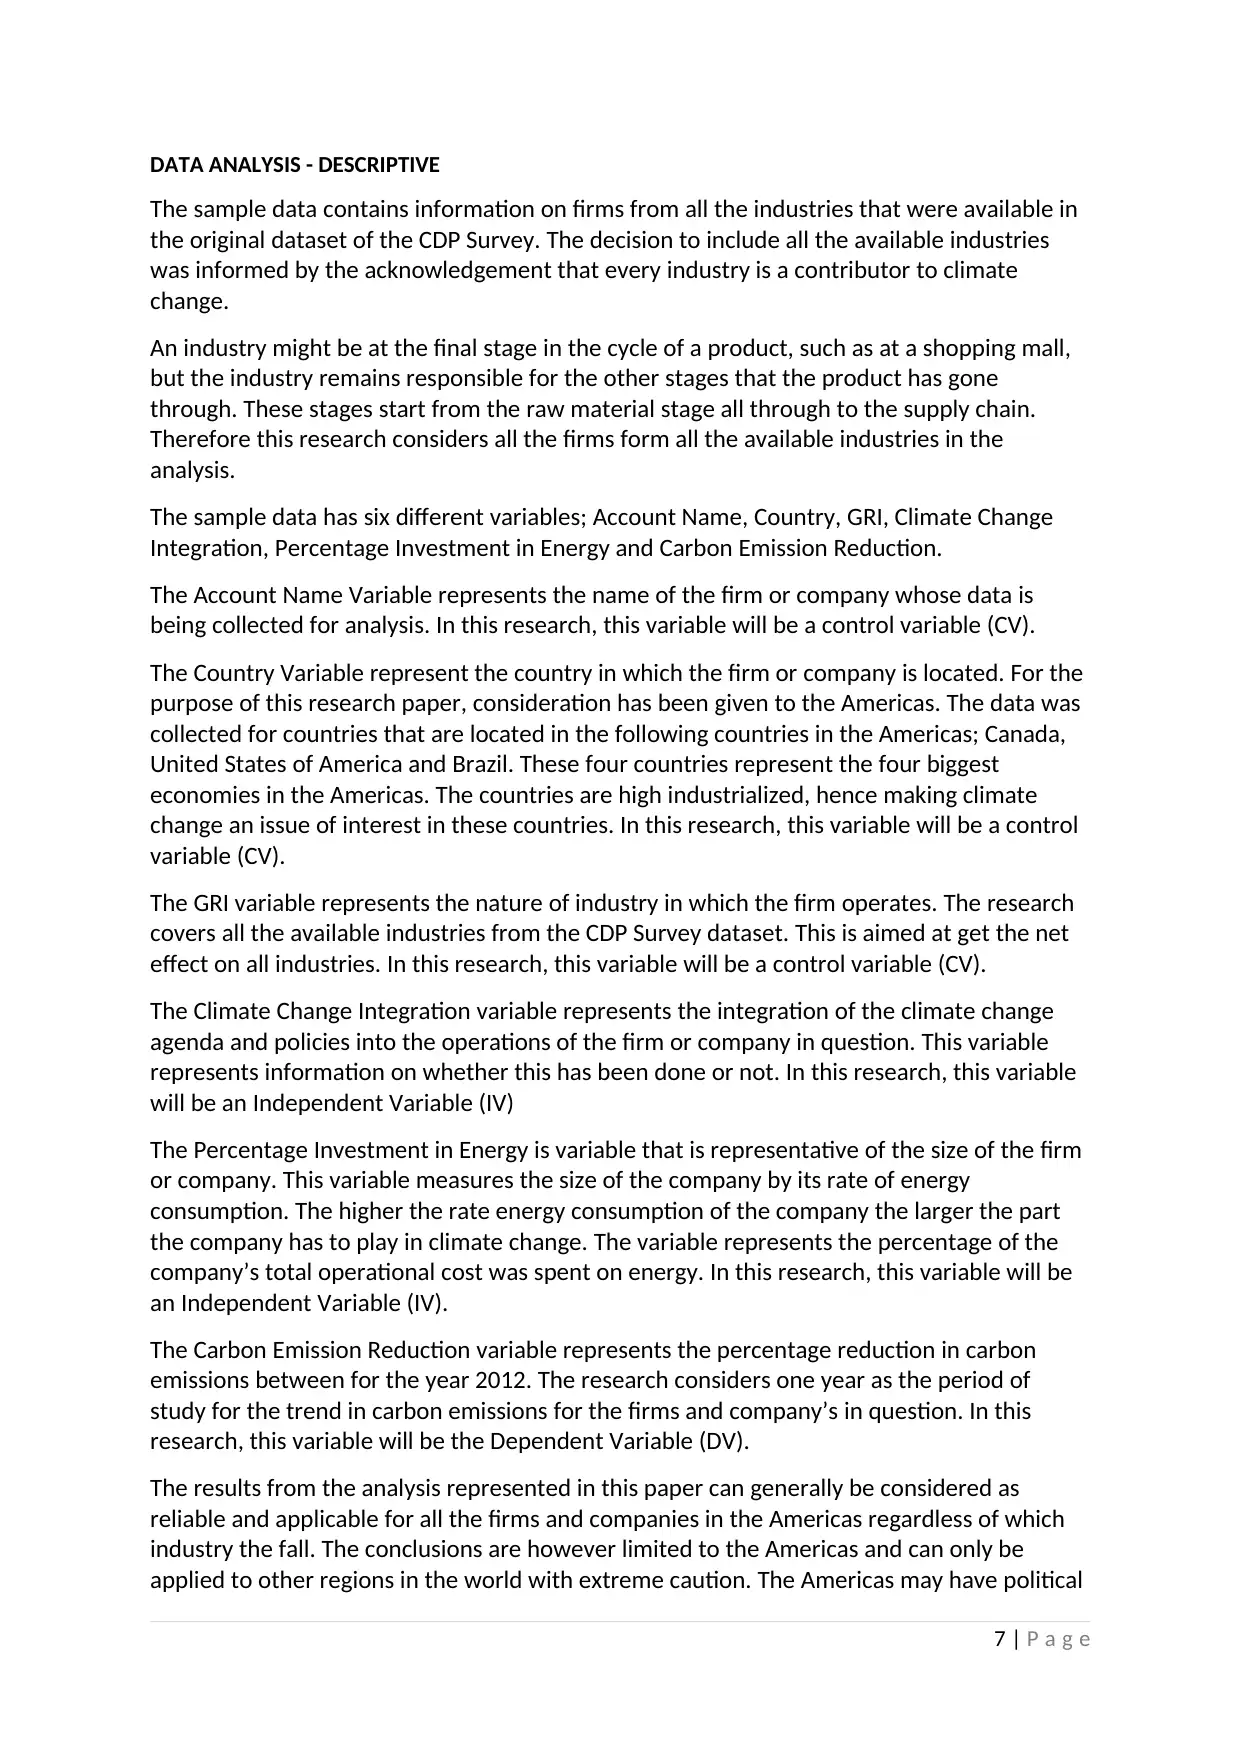
The summary of the descriptive statistics of the independent variable, Climate Change
Integration, is given in Error: Reference source not found and Error: Reference source not
found below:
Statistics
Integration of Climate Change
Agenda into Company Operations
N Valid 60
Missing 0
Table 1: (Source SPSS)
Table 2: (Source SPSS)
The analysis Error: Reference source not found and Error: Reference source not found above
show that the Climate Change variable had a total of 60 entries with no missing values. We
also observe that of the 60 entries, 30 represented companies that have integrated climate
change into their operations which is equivalent to 50% of the observations. The other 30
entries represented companies that have not integrated climate change into their
operations which is equivalent to 50% of the observations.
8 | P a g e
and significantly different from other regions globally.
However, the choice of countries (that is: Canada, United States of America and Brazil) does
represent both Developed and Developing worlds. This can therefore allow the conclusions
from the analysis in this research paper to be applicable globally to some extent.
The sample data had no missing values. The data was collected for 60 firms from the three
countries; Canada, United States of America and Brazil.
The summary of the descriptive statistics of the independent variable, Climate Change
Integration, is given in Error: Reference source not found and Error: Reference source not
found below:
Statistics
Integration of Climate Change
Agenda into Company Operations
N Valid 60
Missing 0
Table 1: (Source SPSS)
Table 2: (Source SPSS)
The analysis Error: Reference source not found and Error: Reference source not found above
show that the Climate Change variable had a total of 60 entries with no missing values. We
also observe that of the 60 entries, 30 represented companies that have integrated climate
change into their operations which is equivalent to 50% of the observations. The other 30
entries represented companies that have not integrated climate change into their
operations which is equivalent to 50% of the observations.
8 | P a g e
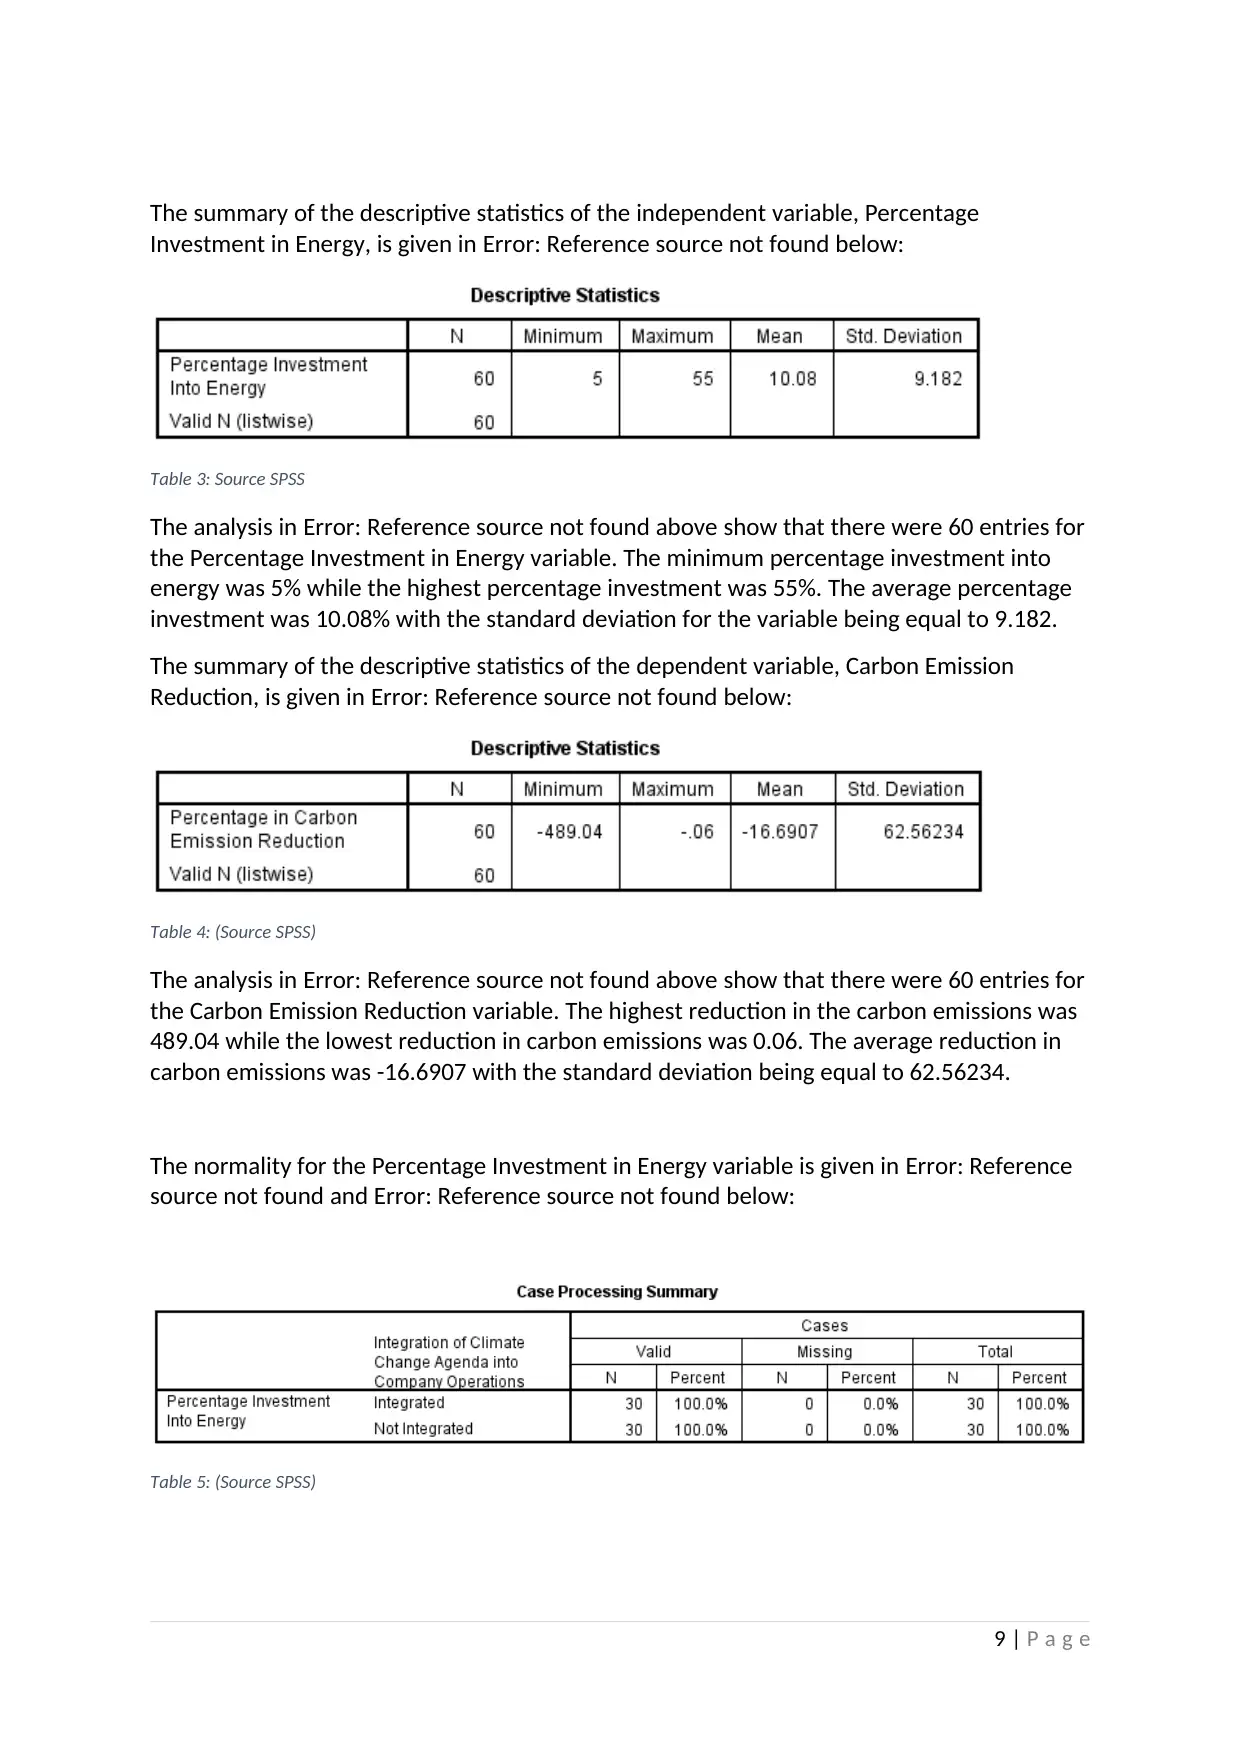
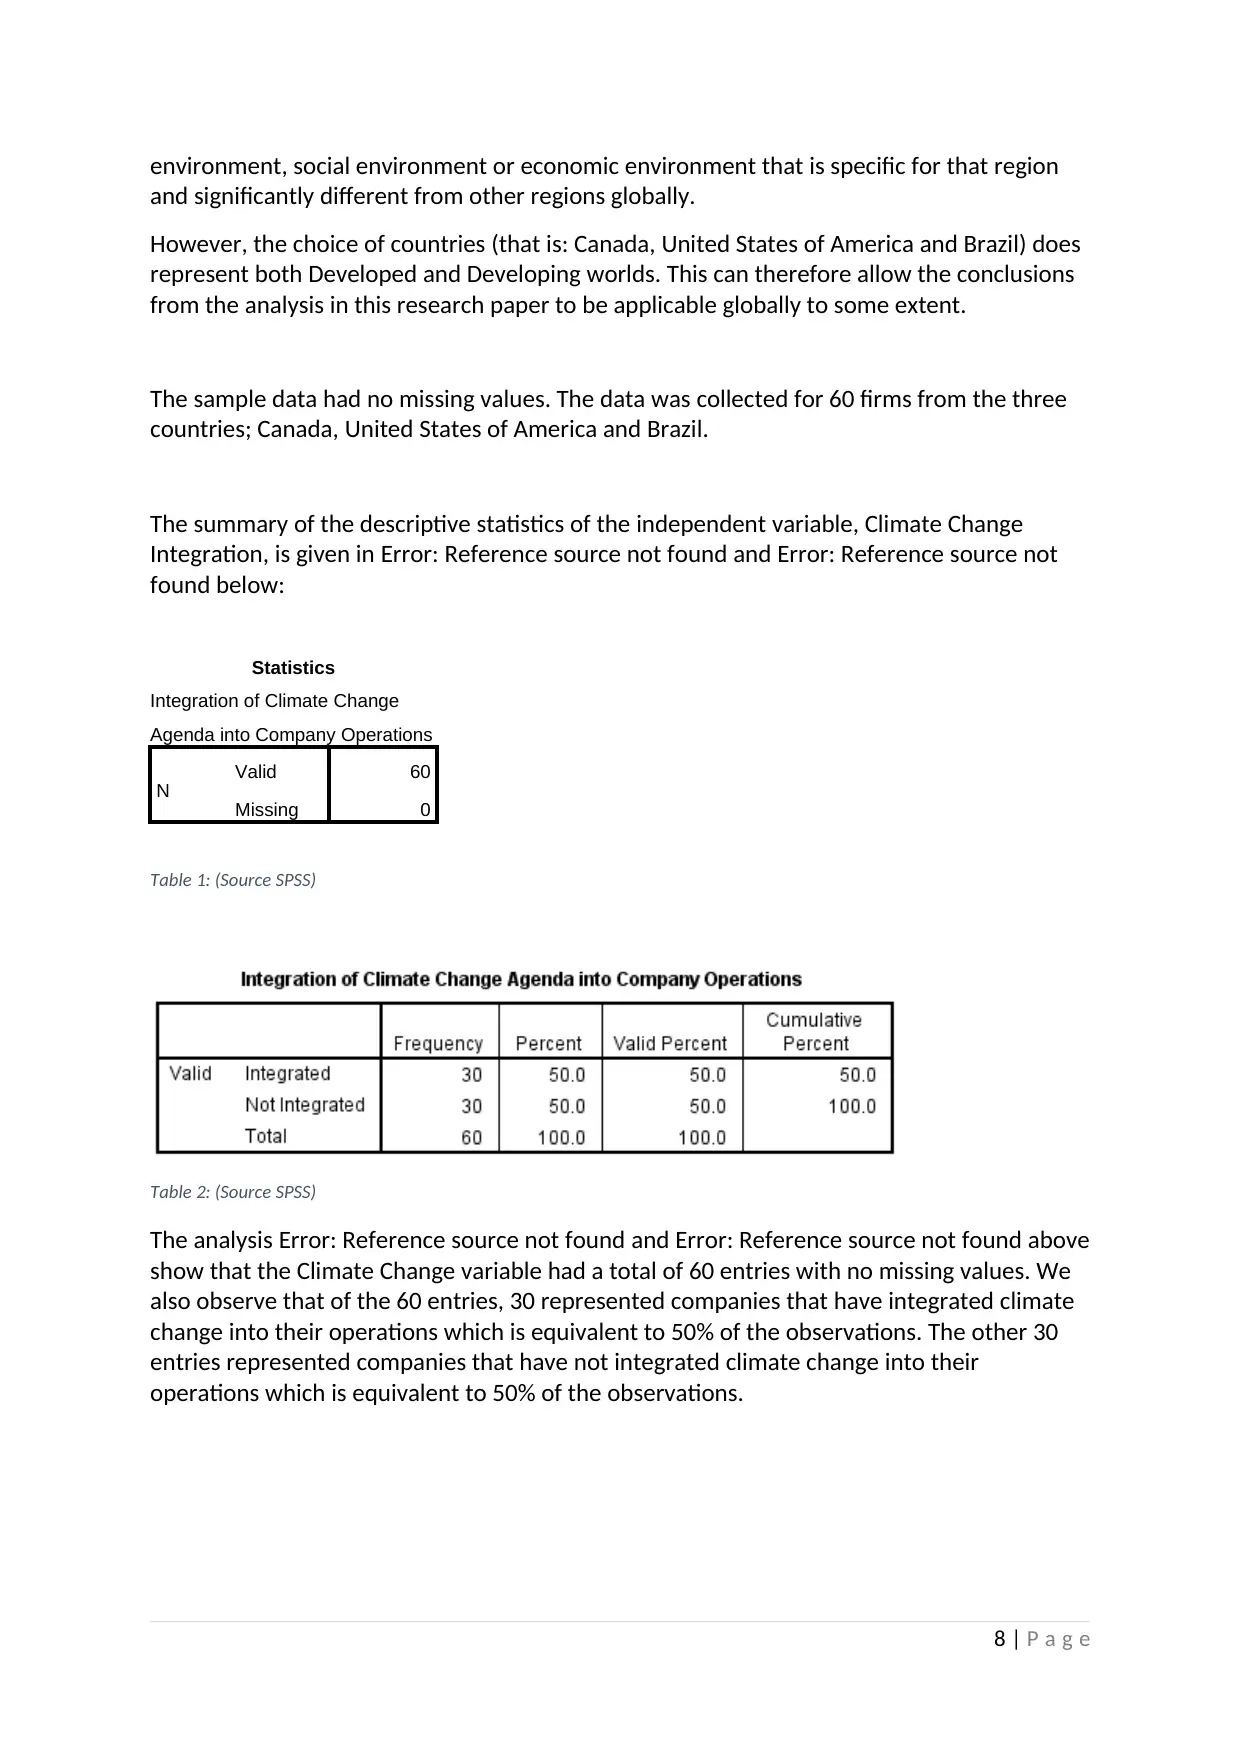
The summary of the descriptive statistics of the independent variable, Percentage
Investment in Energy, is given in Error: Reference source not found below:
Table 3: Source SPSS
The analysis in Error: Reference source not found above show that there were 60 entries for
the Percentage Investment in Energy variable. The minimum percentage investment into
energy was 5% while the highest percentage investment was 55%. The average percentage
investment was 10.08% with the standard deviation for the variable being equal to 9.182.
The summary of the descriptive statistics of the dependent variable, Carbon Emission
Reduction, is given in Error: Reference source not found below:
Table 4: (Source SPSS)
The analysis in Error: Reference source not found above show that there were 60 entries for
the Carbon Emission Reduction variable. The highest reduction in the carbon emissions was
489.04 while the lowest reduction in carbon emissions was 0.06. The average reduction in
carbon emissions was -16.6907 with the standard deviation being equal to 62.56234.
The normality for the Percentage Investment in Energy variable is given in Error: Reference
source not found and Error: Reference source not found below:
Table 5: (Source SPSS)
9 | P a g e
⊘ This is a preview!⊘
Do you want full access?
Subscribe today to unlock all pages.
Trusted by 1+ million students worldwide
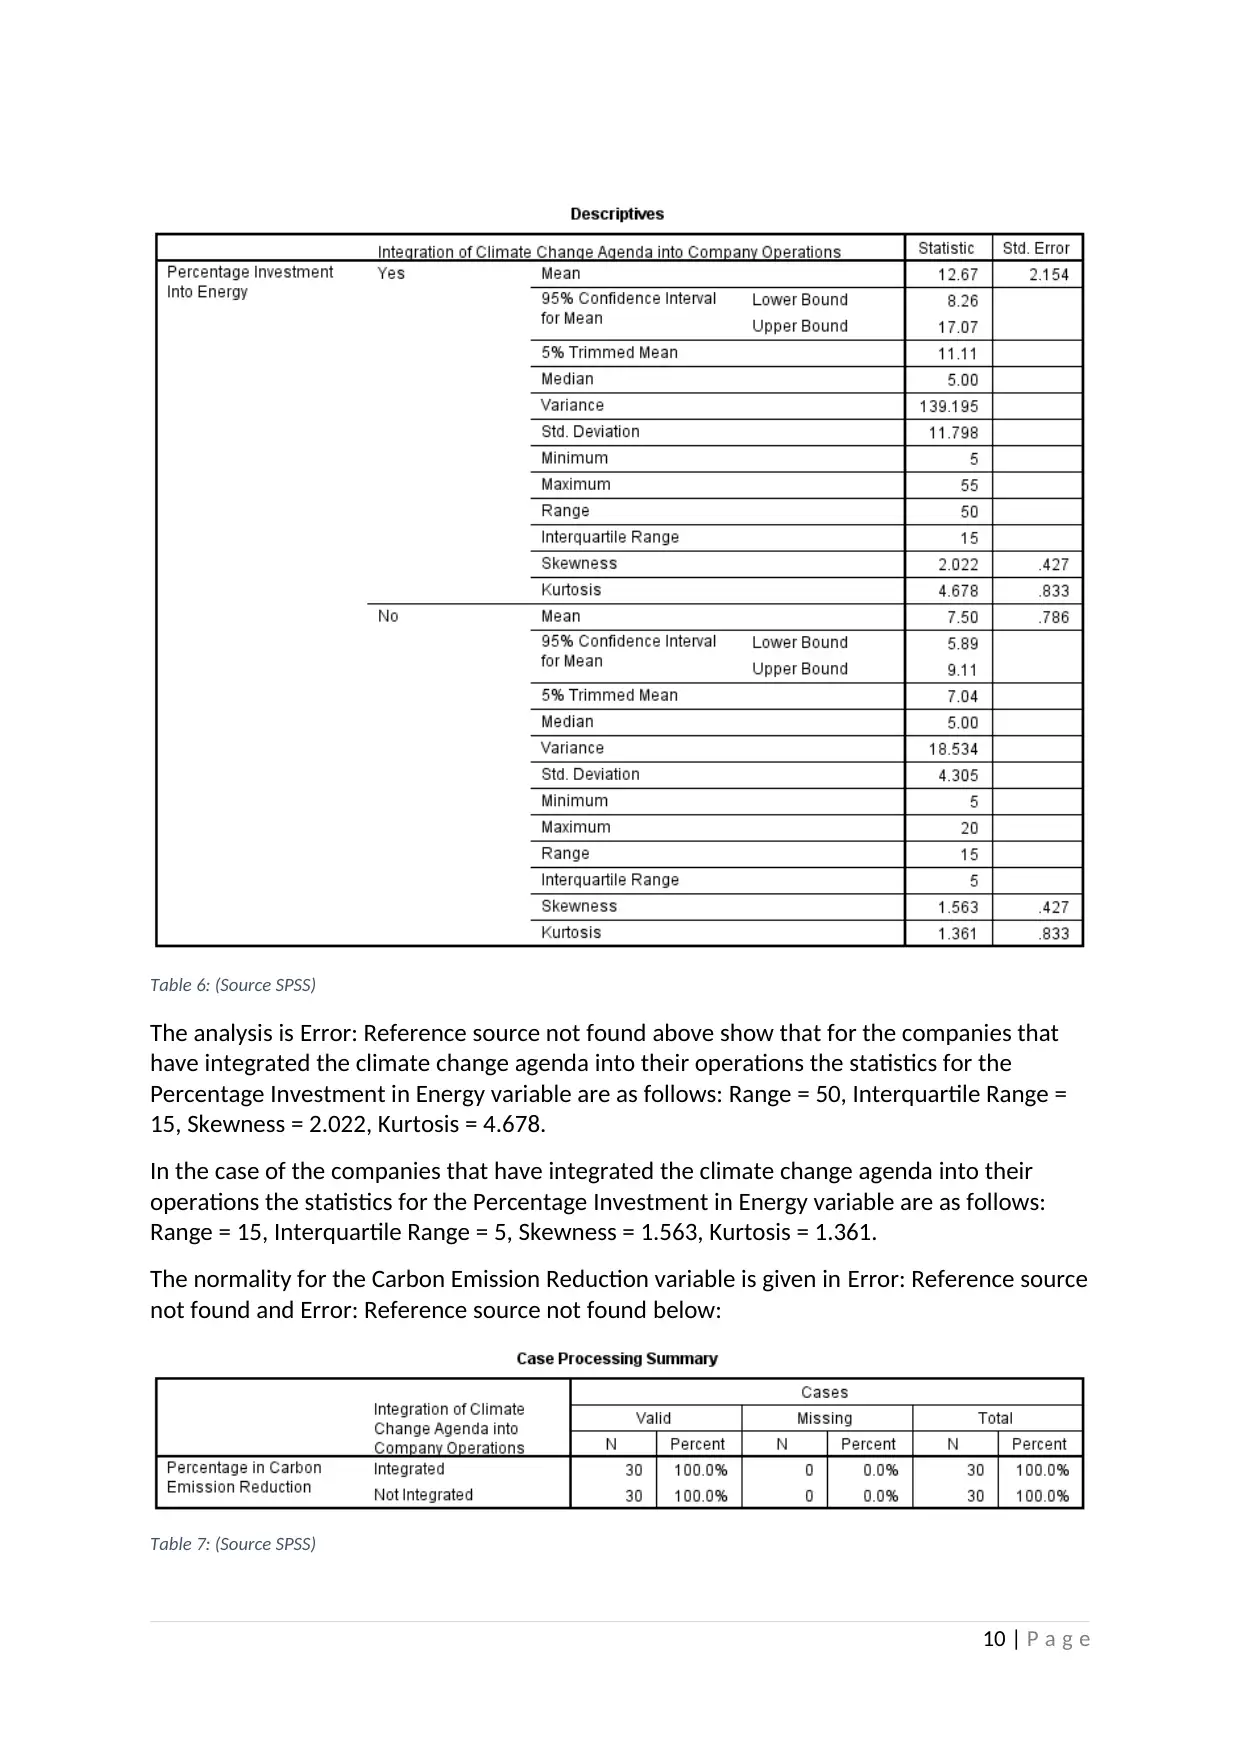
Table 6: (Source SPSS)
The analysis is Error: Reference source not found above show that for the companies that
have integrated the climate change agenda into their operations the statistics for the
Percentage Investment in Energy variable are as follows: Range = 50, Interquartile Range =
15, Skewness = 2.022, Kurtosis = 4.678.
In the case of the companies that have integrated the climate change agenda into their
operations the statistics for the Percentage Investment in Energy variable are as follows:
Range = 15, Interquartile Range = 5, Skewness = 1.563, Kurtosis = 1.361.
The normality for the Carbon Emission Reduction variable is given in Error: Reference source
not found and Error: Reference source not found below:
Table 7: (Source SPSS)
10 | P a g e
Paraphrase This Document
Need a fresh take? Get an instant paraphrase of this document with our AI Paraphraser
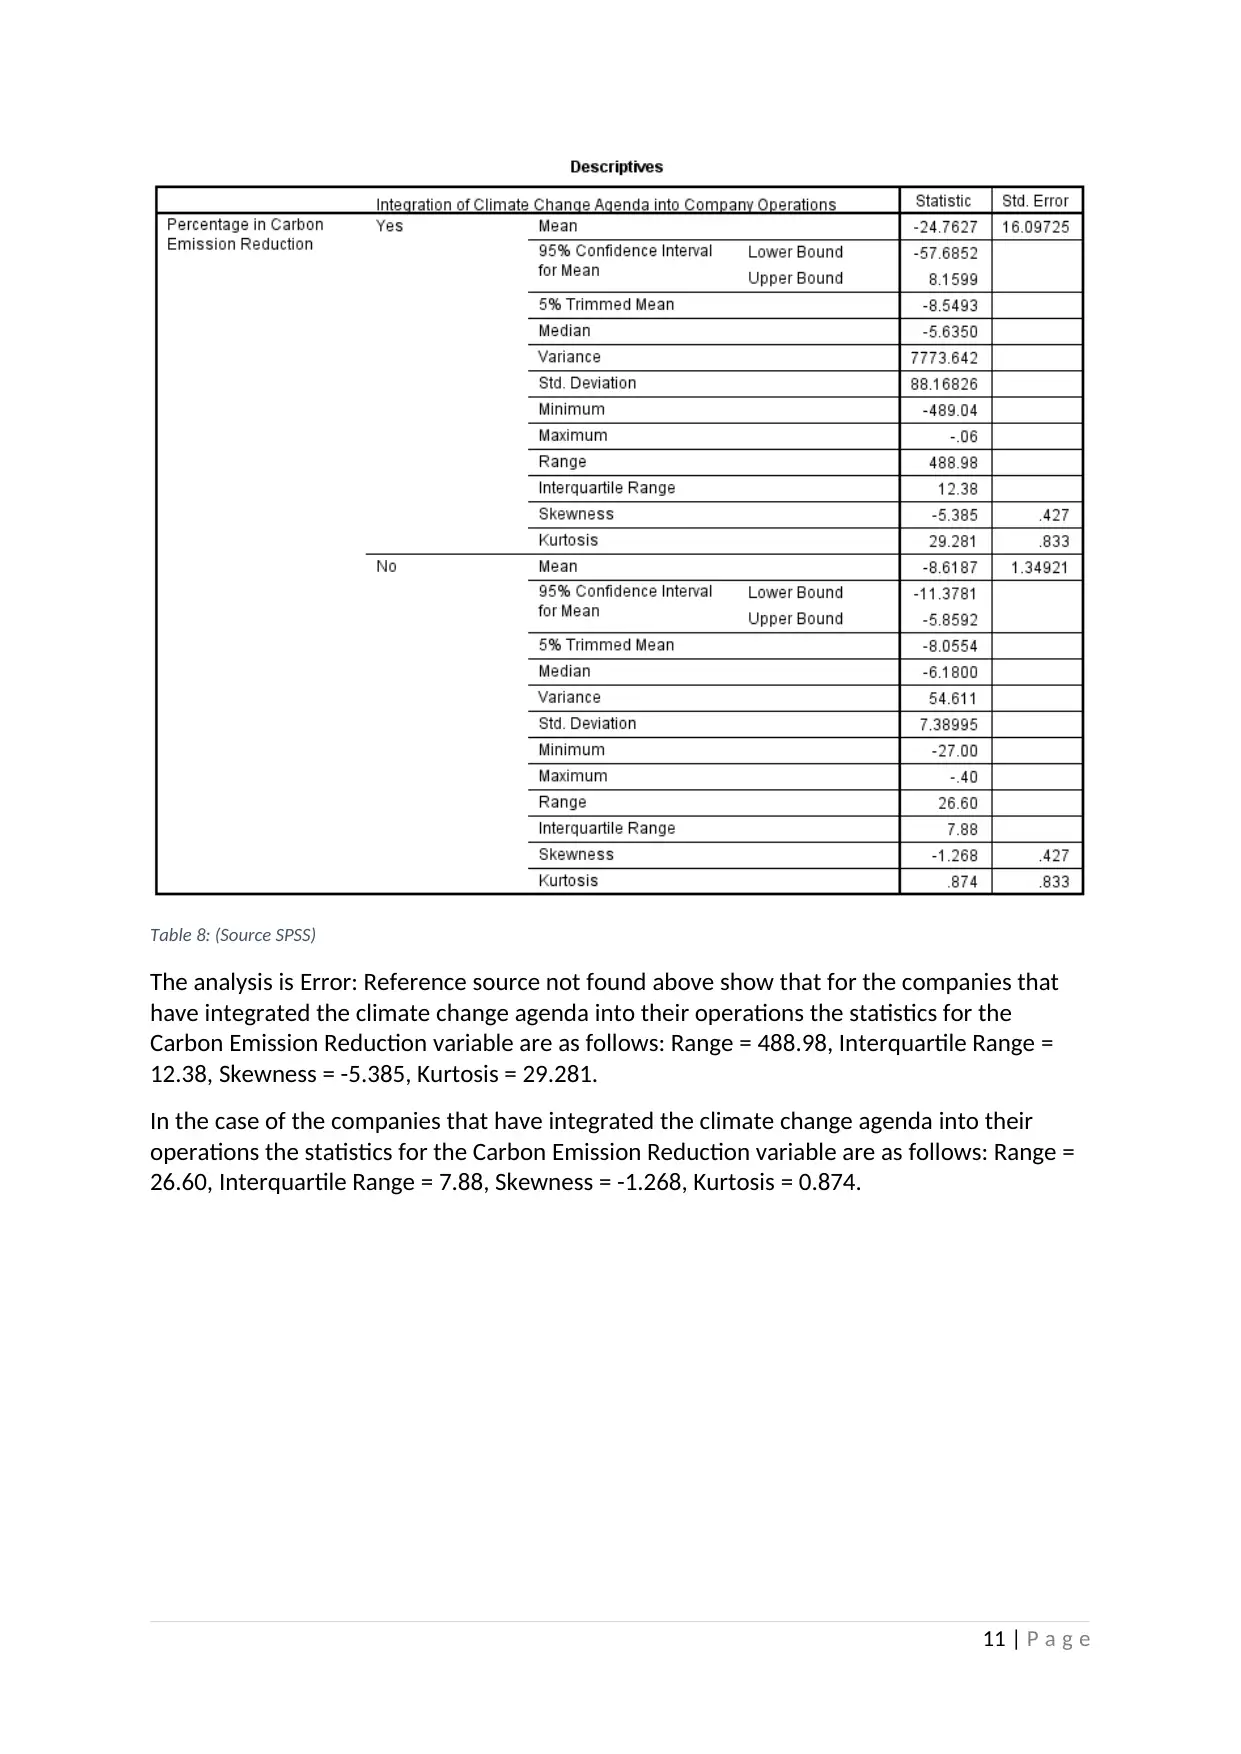
Table 8: (Source SPSS)
The analysis is Error: Reference source not found above show that for the companies that
have integrated the climate change agenda into their operations the statistics for the
Carbon Emission Reduction variable are as follows: Range = 488.98, Interquartile Range =
12.38, Skewness = -5.385, Kurtosis = 29.281.
In the case of the companies that have integrated the climate change agenda into their
operations the statistics for the Carbon Emission Reduction variable are as follows: Range =
26.60, Interquartile Range = 7.88, Skewness = -1.268, Kurtosis = 0.874.
11 | P a g e
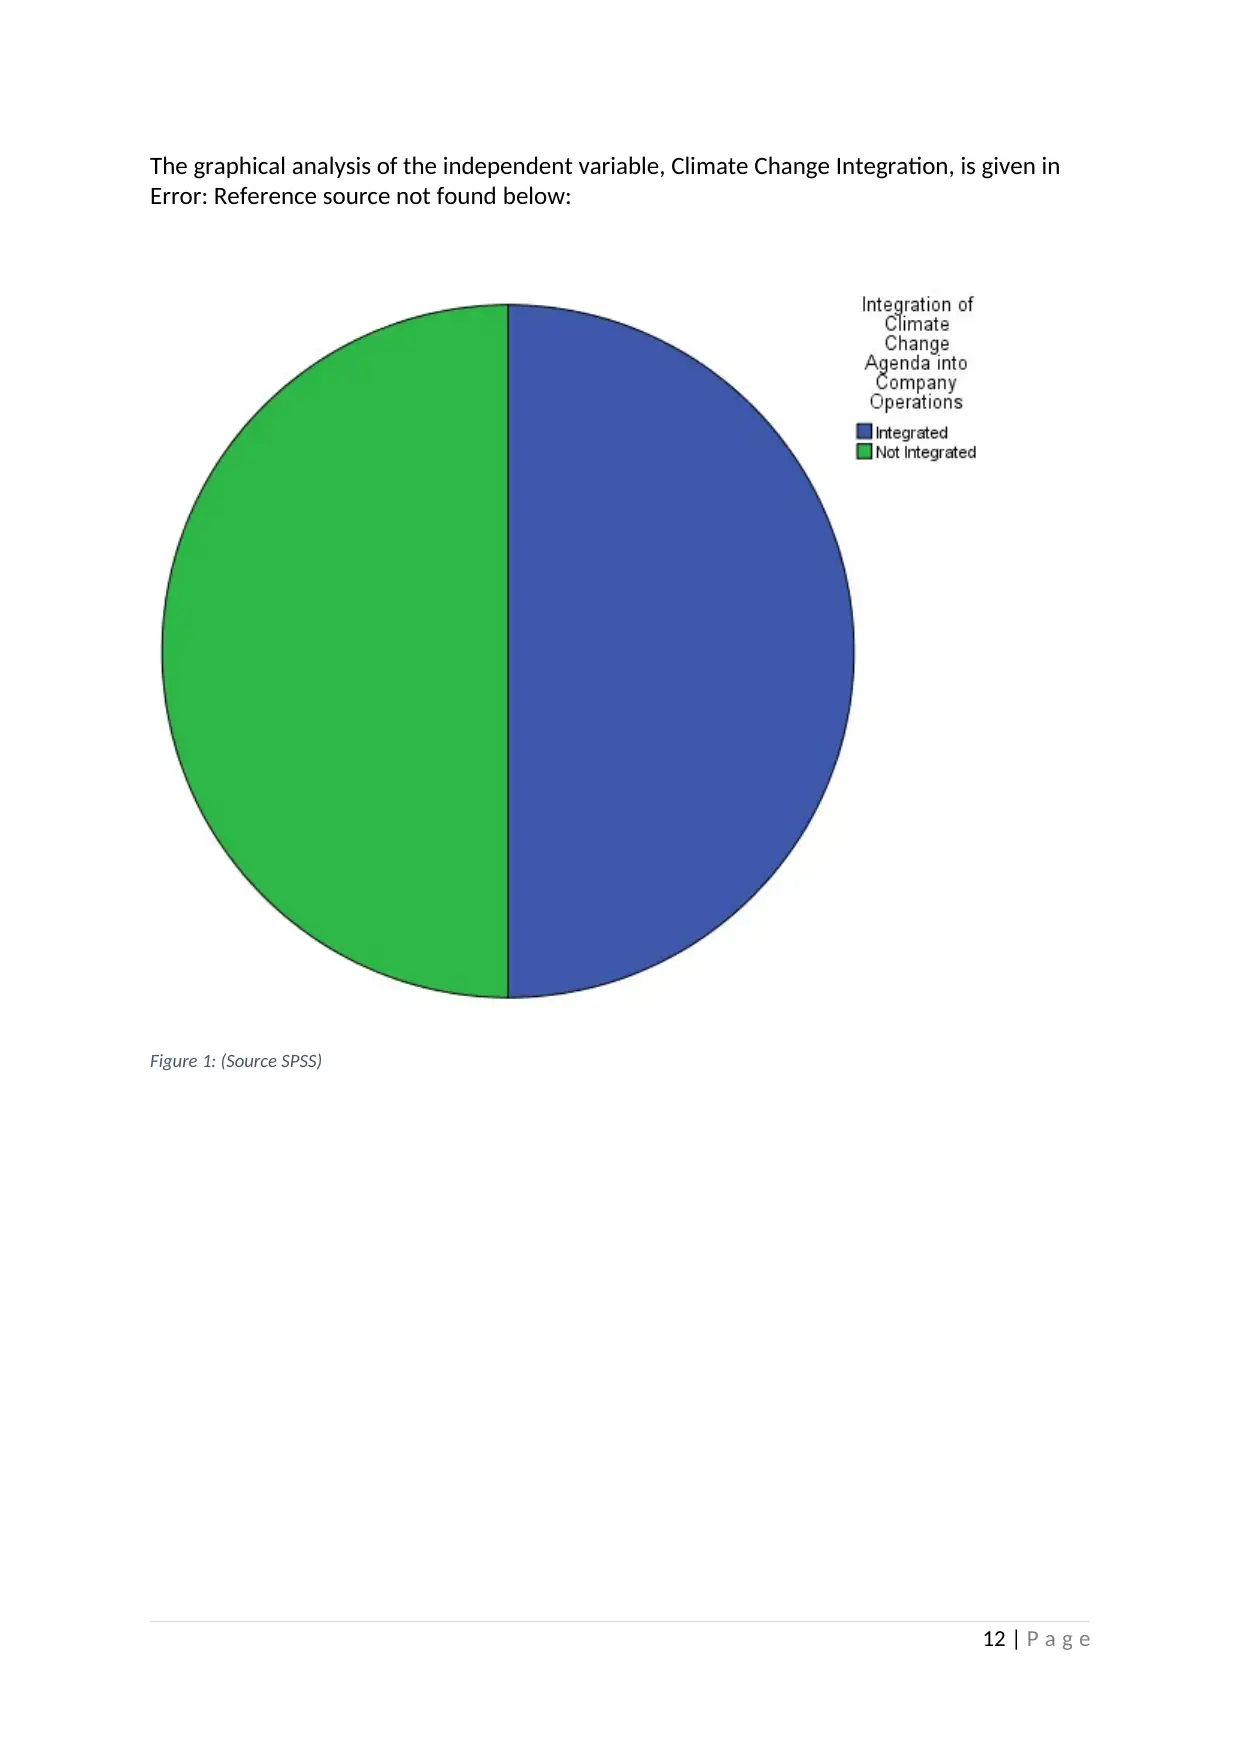
The graphical analysis of the independent variable, Climate Change Integration, is given in
Error: Reference source not found below:
Figure 1: (Source SPSS)
12 | P a g e
Error: Reference source not found below:
Figure 1: (Source SPSS)
12 | P a g e
⊘ This is a preview!⊘
Do you want full access?
Subscribe today to unlock all pages.
Trusted by 1+ million students worldwide
1 out of 15
Related Documents


Your All-in-One AI-Powered Toolkit for Academic Success.
+13062052269
info@desklib.com
Available 24*7 on WhatsApp / Email
![[object Object]](/_next/static/media/star-bottom.7253800d.svg)
Unlock your academic potential
Copyright © 2020–2026 A2Z Services. All Rights Reserved. Developed and managed by ZUCOL.