MGT 723 Research Project: Incentives and Carbon Emission Report, 2018
VerifiedAdded on 2023/06/04
|18
|4256
|313
Report
AI Summary
This research report investigates the impact of incentives on corporate carbon emissions, focusing on companies in the USA and Australia. It uses data from the Carbon Disclosure Project (CDP) to analyze the relationship between incentives provided to management for climate change initiatives and the resulting changes in Scope 1 and Scope 2 carbon emissions. The report includes a literature review, theoretical framework, conceptual model, and hypothesis testing using statistical analysis. The findings discuss the implications for both practice and theory, while also acknowledging the limitations of the study and suggesting avenues for further research. The analysis utilizes SPSS software to generate descriptive and inferential statistics, ultimately aiming to determine if a significant relationship exists between carbon emission rates and the incentives offered by companies.
University of Sunshine Coast
At
Australian Technical and Management College
(ATMC)
MGT 723 Research Project
Assessment Task 3: Report
Semester 2, 2018
At
Australian Technical and Management College
(ATMC)
MGT 723 Research Project
Assessment Task 3: Report
Semester 2, 2018
Paraphrase This Document
Need a fresh take? Get an instant paraphrase of this document with our AI Paraphraser

MGT 723 Research Project
Assignment 3
Acknowledgement:
I certify that I have carefully reviewed the university’s academic misconduct policy. I understand that
the source of ideas must be referenced and that quotation marks and a reference are required when
directly quoting anyone else’s words.
Ashish Tiwari 1113814 2 | P a g e
MGT 723 Research Project
Assignment 3
Table of Contents
Acknowledgement:................................................................................................................................2
Introduction...........................................................................................................................................4
Literature Review..................................................................................................................................5
Theoretical Framework.........................................................................................................................6
Conceptual Model.................................................................................................................................6
Hypotheses............................................................................................................................................8
Data Analysis – Descriptive....................................................................................................................9
Data Analysis – Inferential...................................................................................................................11
Hypothesis testing...............................................................................................................................12
Discussion............................................................................................................................................13
Limitations...........................................................................................................................................14
Further Research.................................................................................................................................14
References...........................................................................................................................................15
Ashish Tiwari 1113814 3 | P a g e
⊘ This is a preview!⊘
Do you want full access?
Subscribe today to unlock all pages.
Trusted by 1+ million students worldwide
MGT 723 Research Project
Assignment 3
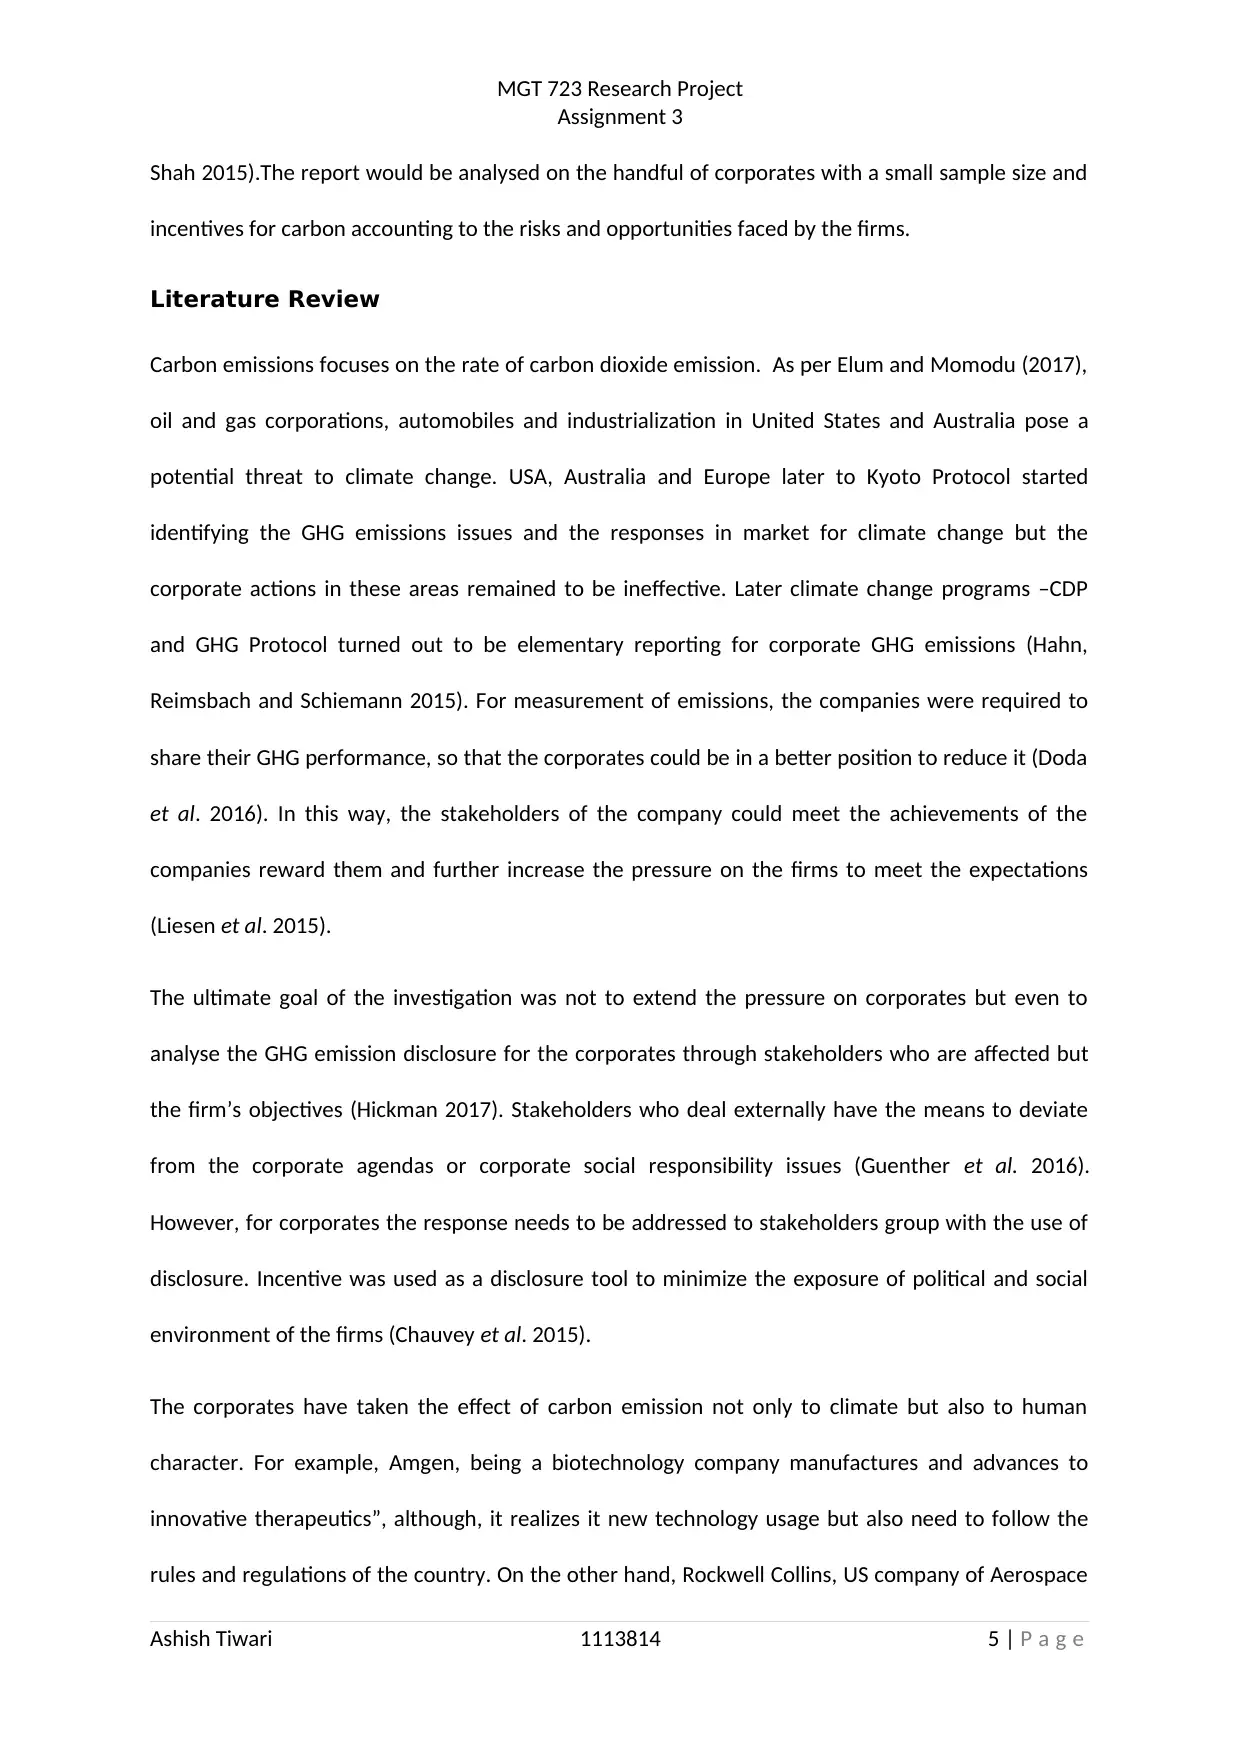
Introduction
Corporate responses and the climate changes because of carbon emissions have shifted over for the
last 20 years. In 1990’s, business neglected the concern but recently, greenhouse gases are the main
apprehension towards the environmental degradation. This has not only affected the environment
on a whole but has even affected the climate change issues but with many misconceptions, the
entire issue has fallen back to global warming (Besio and Pronzini 2014). Whether it is burning fossil
fuels or industrial chemicals, the gases trapped creates a radiation and hangs on the overall
temperature. Although, the largest producer of carbon emission is electricity source which is aligned
to 32% of greenhouse emission posing a substantial threat; followed by transportation i.e. 28% of
GHG (Huaman and Jun 2014).
The United States data shows that the total emission has been growing since the 20th century by an
increase of 5%, even though there is a drop but it still rising as a whole for other countries. Carbon
emissions have been the primary root for industrial development (Andrew and Cortese 2011).
Hence, it is important that the nature of carbon emission needs to be examined on a corporate level
as 17% constitute for the GHG threat.
Towards the carbon constrained future, strategies have been developed by corporates for
measuring, assessing, managing and reporting carbon emissions. The threat of climate change has
emerged as a basic response from carbon emissions that has not only intensified the management
and accounting capabilities of GHG but has also, established budgets, baselines and incentivization
for the measurement of actual emissions (Lau and Eng 2014).
The research report studies the carbon emission from the GHG with the use of incentives for urging
the firms to further reveal the extensive information for climate changes. The CDP (Carbon
Disclosure Project) report instil the investors of the present scenario with carbon emission and the
way it would be benefitting the overall financial preformation of the corporates (Caritte, Acha and
Ashish Tiwari 1113814 4 | P a g e
Assignment 3
Introduction
Corporate responses and the climate changes because of carbon emissions have shifted over for the
last 20 years. In 1990’s, business neglected the concern but recently, greenhouse gases are the main
apprehension towards the environmental degradation. This has not only affected the environment
on a whole but has even affected the climate change issues but with many misconceptions, the
entire issue has fallen back to global warming (Besio and Pronzini 2014). Whether it is burning fossil
fuels or industrial chemicals, the gases trapped creates a radiation and hangs on the overall
temperature. Although, the largest producer of carbon emission is electricity source which is aligned
to 32% of greenhouse emission posing a substantial threat; followed by transportation i.e. 28% of
GHG (Huaman and Jun 2014).
The United States data shows that the total emission has been growing since the 20th century by an
increase of 5%, even though there is a drop but it still rising as a whole for other countries. Carbon
emissions have been the primary root for industrial development (Andrew and Cortese 2011).
Hence, it is important that the nature of carbon emission needs to be examined on a corporate level
as 17% constitute for the GHG threat.
Towards the carbon constrained future, strategies have been developed by corporates for
measuring, assessing, managing and reporting carbon emissions. The threat of climate change has
emerged as a basic response from carbon emissions that has not only intensified the management
and accounting capabilities of GHG but has also, established budgets, baselines and incentivization
for the measurement of actual emissions (Lau and Eng 2014).
The research report studies the carbon emission from the GHG with the use of incentives for urging
the firms to further reveal the extensive information for climate changes. The CDP (Carbon
Disclosure Project) report instil the investors of the present scenario with carbon emission and the
way it would be benefitting the overall financial preformation of the corporates (Caritte, Acha and
Ashish Tiwari 1113814 4 | P a g e
Paraphrase This Document
Need a fresh take? Get an instant paraphrase of this document with our AI Paraphraser
MGT 723 Research Project
Assignment 3
Shah 2015).The report would be analysed on the handful of corporates with a small sample size and
incentives for carbon accounting to the risks and opportunities faced by the firms.
Literature Review
Carbon emissions focuses on the rate of carbon dioxide emission. As per Elum and Momodu (2017),
oil and gas corporations, automobiles and industrialization in United States and Australia pose a
potential threat to climate change. USA, Australia and Europe later to Kyoto Protocol started
identifying the GHG emissions issues and the responses in market for climate change but the
corporate actions in these areas remained to be ineffective. Later climate change programs –CDP
and GHG Protocol turned out to be elementary reporting for corporate GHG emissions (Hahn,
Reimsbach and Schiemann 2015). For measurement of emissions, the companies were required to
share their GHG performance, so that the corporates could be in a better position to reduce it (Doda
et al. 2016). In this way, the stakeholders of the company could meet the achievements of the
companies reward them and further increase the pressure on the firms to meet the expectations
(Liesen et al. 2015).
The ultimate goal of the investigation was not to extend the pressure on corporates but even to
analyse the GHG emission disclosure for the corporates through stakeholders who are affected but
the firm’s objectives (Hickman 2017). Stakeholders who deal externally have the means to deviate
from the corporate agendas or corporate social responsibility issues (Guenther et al. 2016).
However, for corporates the response needs to be addressed to stakeholders group with the use of
disclosure. Incentive was used as a disclosure tool to minimize the exposure of political and social
environment of the firms (Chauvey et al. 2015).
The corporates have taken the effect of carbon emission not only to climate but also to human
character. For example, Amgen, being a biotechnology company manufactures and advances to
innovative therapeutics”, although, it realizes it new technology usage but also need to follow the
rules and regulations of the country. On the other hand, Rockwell Collins, US company of Aerospace
Ashish Tiwari 1113814 5 | P a g e
MGT 723 Research Project
Assignment 3
and defence has been reducing its carbon footprint to an all time low of 26% GHG with continuous
support from Chicago Climate Exchange and data analysis using Lean/ Six Sigma (rockwellcollins.com
2018).
USA and Australia have been actively dealing with the carbon emission problem and aims to reduce
the carbon footprint further in the upcoming years. As the companies in these countries constitutes
to be the mainstay of the people for employment but with the existing approaches, a common
agreement needs to be devised for corresponding assessments. Here, primarily it is to test the
theory of carbon emission with incentives undertaken by the company to the management.
Theoretical Framework
USA and Australia have used the CDP questionnaire with Scope 1 (target) and Scope 2 (reporting)
emissions to analyse the companies emission record on a yearly basis. This reduction initiative has
upstaged the new rules and regulations reducing carbon dioxide emissions. This data will be
examined to revise the rules based on the reduction action performed in metric tonnes CO2e per
unit currency. This environmental strategy will help the regulators to not only set binding limits but
will also help the companies in buying permits to emit when exceeding those set “caps” (Song and
Leng 2012). This research design keeps a tap on the comparison based on the companies carbon
emission reduction rate from different companies of Australia and USA from the industries of
aerospace, mining, electrical, biotechnology, banks and so on.
Conceptual Model
The model used for the study highlights the concepts and the variables that are used to identify the
relationship between them and the way it can be underlined with the research presented. Here, the
model specifies the relationship of independent and dependent variable with the effect of control
variable such that the control variable does not change and keeping it constant its effect can be seen
in explanatory and response variables. The model for the report can be given as:
Ashish Tiwari 1113814 6 | P a g e
⊘ This is a preview!⊘
Do you want full access?
Subscribe today to unlock all pages.
Trusted by 1+ million students worldwide
INDEPENDENT VARIABLE
Incentives provided by the company (Rewards)
DEPENDENT VARIABLE
Scope 1 and Scope 2 Carbon Emission
CONTROL VARIABLE
Countries and Global Reporting Initiative (GRI)
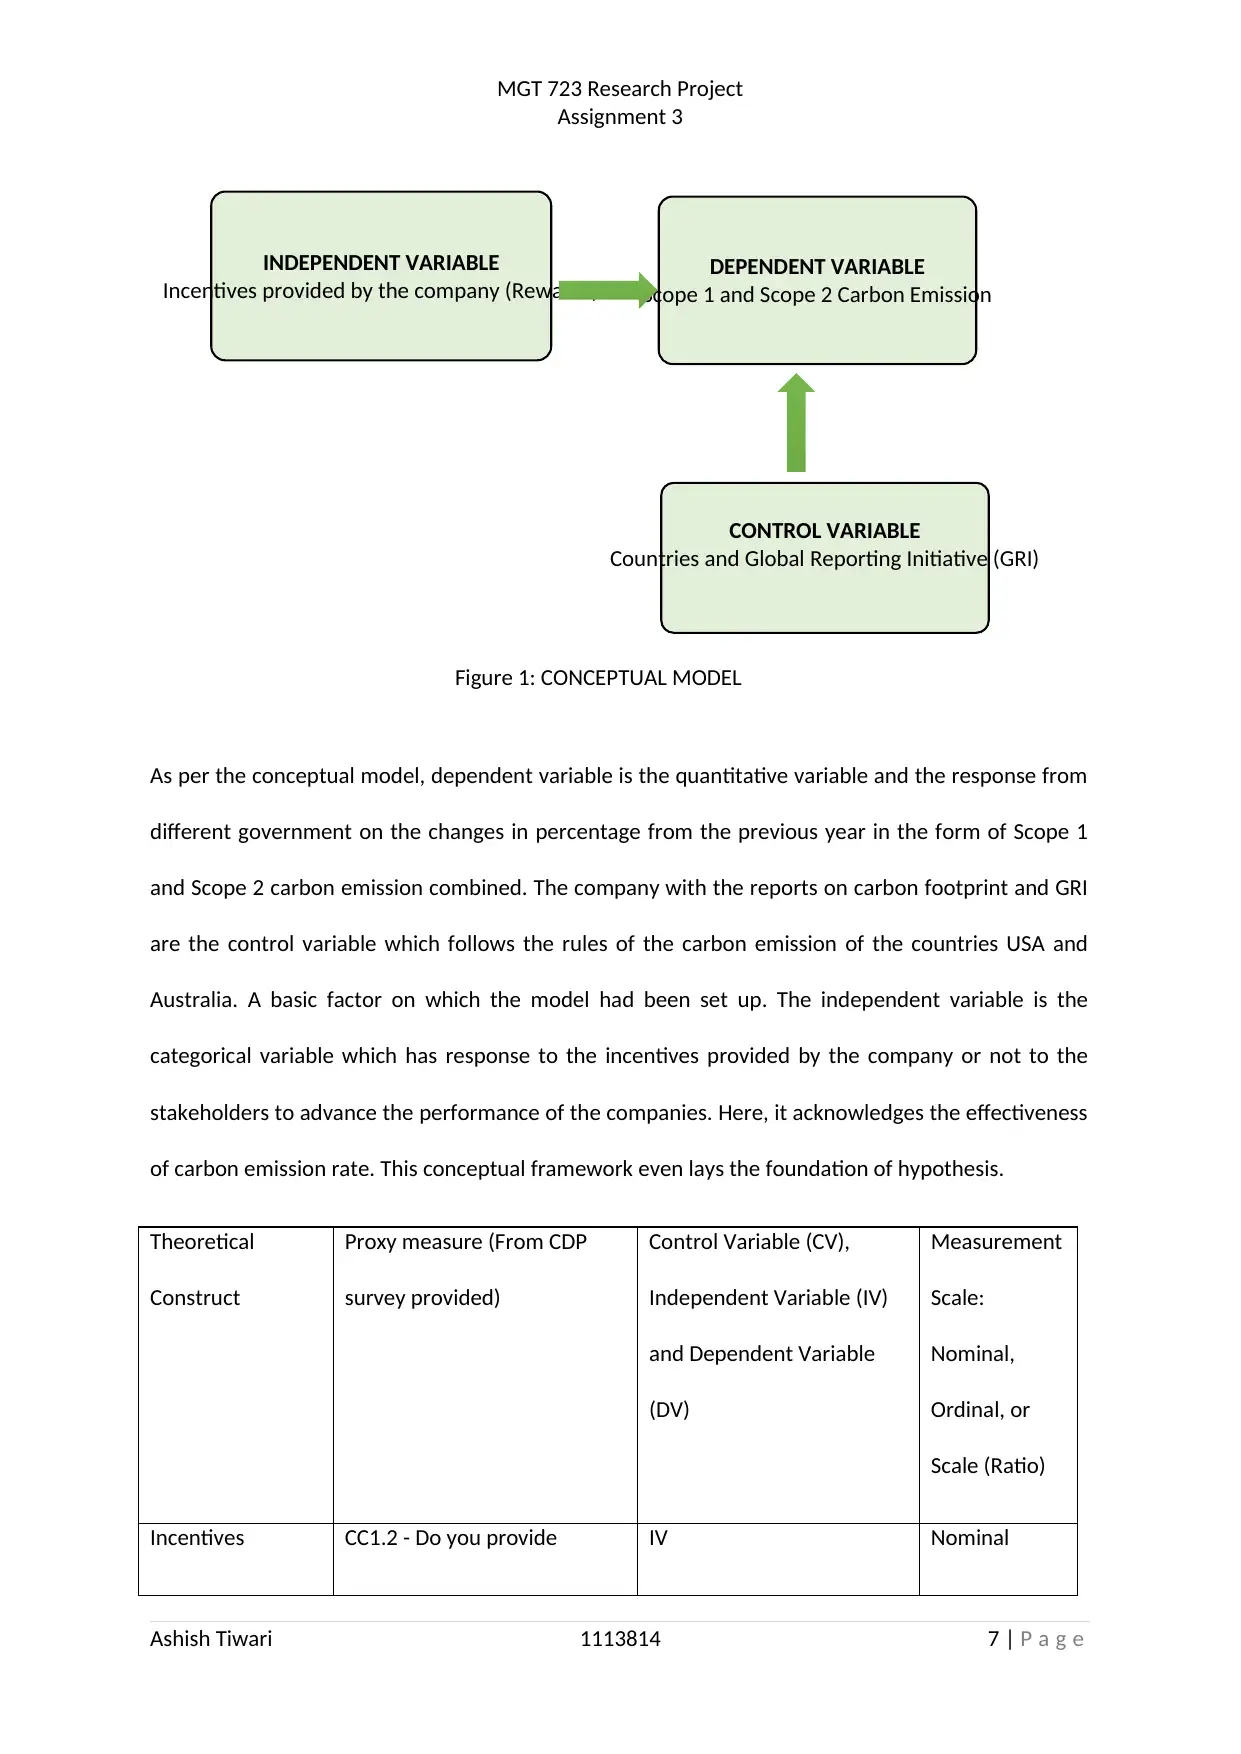
Figure 1: CONCEPTUAL MODEL
MGT 723 Research Project
Assignment 3
As per the conceptual model, dependent variable is the quantitative variable and the response from
different government on the changes in percentage from the previous year in the form of Scope 1
and Scope 2 carbon emission combined. The company with the reports on carbon footprint and GRI
are the control variable which follows the rules of the carbon emission of the countries USA and
Australia. A basic factor on which the model had been set up. The independent variable is the
categorical variable which has response to the incentives provided by the company or not to the
stakeholders to advance the performance of the companies. Here, it acknowledges the effectiveness
of carbon emission rate. This conceptual framework even lays the foundation of hypothesis.
Theoretical
Construct
Proxy measure (From CDP
survey provided)
Control Variable (CV),
Independent Variable (IV)
and Dependent Variable
(DV)
Measurement
Scale:
Nominal,
Ordinal, or
Scale (Ratio)
Incentives CC1.2 - Do you provide IV Nominal
Ashish Tiwari 1113814 7 | P a g e
Incentives provided by the company (Rewards)
DEPENDENT VARIABLE
Scope 1 and Scope 2 Carbon Emission
CONTROL VARIABLE
Countries and Global Reporting Initiative (GRI)
Figure 1: CONCEPTUAL MODEL
MGT 723 Research Project
Assignment 3
As per the conceptual model, dependent variable is the quantitative variable and the response from
different government on the changes in percentage from the previous year in the form of Scope 1
and Scope 2 carbon emission combined. The company with the reports on carbon footprint and GRI
are the control variable which follows the rules of the carbon emission of the countries USA and
Australia. A basic factor on which the model had been set up. The independent variable is the
categorical variable which has response to the incentives provided by the company or not to the
stakeholders to advance the performance of the companies. Here, it acknowledges the effectiveness
of carbon emission rate. This conceptual framework even lays the foundation of hypothesis.
Theoretical
Construct
Proxy measure (From CDP
survey provided)
Control Variable (CV),
Independent Variable (IV)
and Dependent Variable
(DV)
Measurement
Scale:
Nominal,
Ordinal, or
Scale (Ratio)
Incentives CC1.2 - Do you provide IV Nominal
Ashish Tiwari 1113814 7 | P a g e
Paraphrase This Document
Need a fresh take? Get an instant paraphrase of this document with our AI Paraphraser
MGT 723 Research Project
Assignment 3
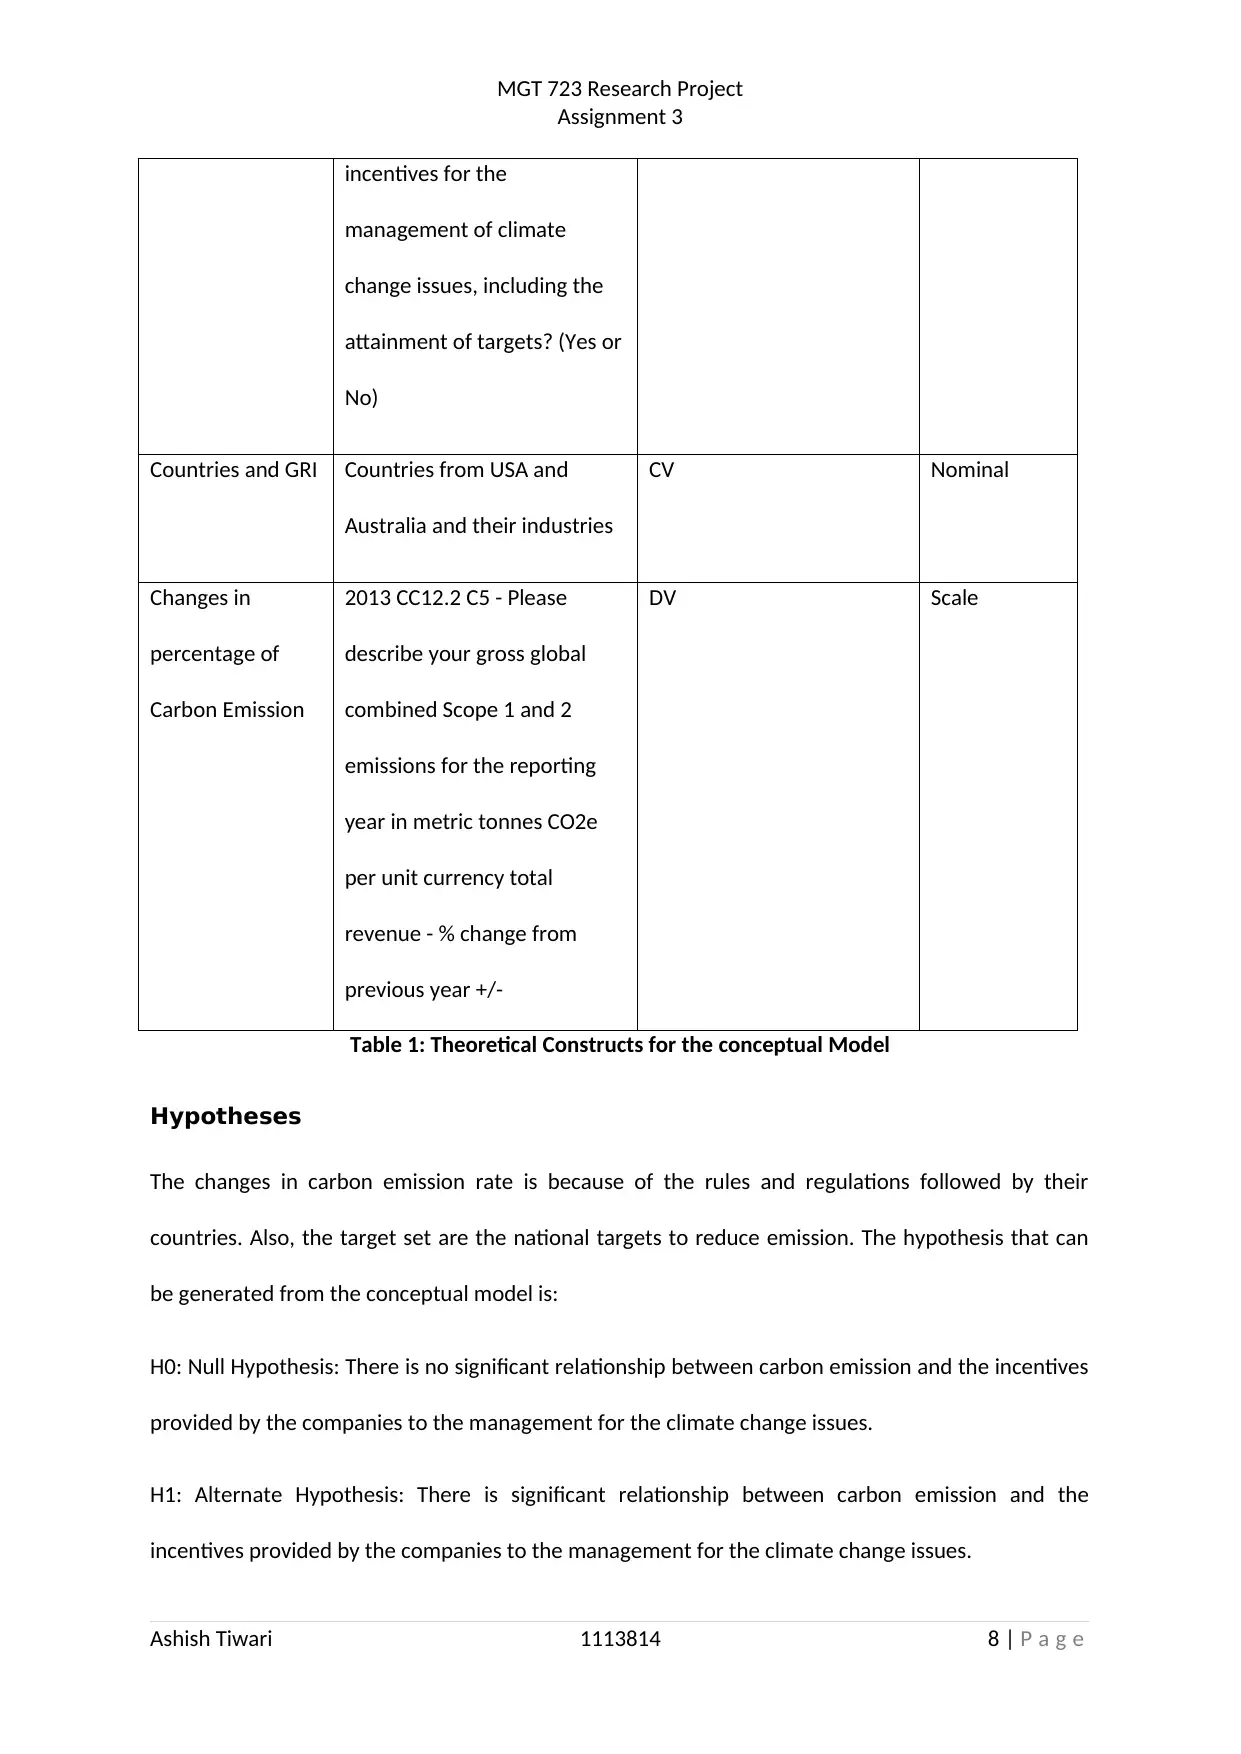
incentives for the
management of climate
change issues, including the
attainment of targets? (Yes or
No)
Countries and GRI Countries from USA and
Australia and their industries
CV Nominal
Changes in
percentage of
Carbon Emission
2013 CC12.2 C5 - Please
describe your gross global
combined Scope 1 and 2
emissions for the reporting
year in metric tonnes CO2e
per unit currency total
revenue - % change from
previous year +/-
DV Scale
Table 1: Theoretical Constructs for the conceptual Model
Hypotheses
The changes in carbon emission rate is because of the rules and regulations followed by their
countries. Also, the target set are the national targets to reduce emission. The hypothesis that can
be generated from the conceptual model is:
H0: Null Hypothesis: There is no significant relationship between carbon emission and the incentives
provided by the companies to the management for the climate change issues.
H1: Alternate Hypothesis: There is significant relationship between carbon emission and the
incentives provided by the companies to the management for the climate change issues.
Ashish Tiwari 1113814 8 | P a g e
Assignment 3
incentives for the
management of climate
change issues, including the
attainment of targets? (Yes or
No)
Countries and GRI Countries from USA and
Australia and their industries
CV Nominal
Changes in
percentage of
Carbon Emission
2013 CC12.2 C5 - Please
describe your gross global
combined Scope 1 and 2
emissions for the reporting
year in metric tonnes CO2e
per unit currency total
revenue - % change from
previous year +/-
DV Scale
Table 1: Theoretical Constructs for the conceptual Model
Hypotheses
The changes in carbon emission rate is because of the rules and regulations followed by their
countries. Also, the target set are the national targets to reduce emission. The hypothesis that can
be generated from the conceptual model is:
H0: Null Hypothesis: There is no significant relationship between carbon emission and the incentives
provided by the companies to the management for the climate change issues.
H1: Alternate Hypothesis: There is significant relationship between carbon emission and the
incentives provided by the companies to the management for the climate change issues.
Ashish Tiwari 1113814 8 | P a g e
MGT 723 Research Project
Assignment 3
Data Analysis – Descriptive
The data analysis is done using statistical tool, SPSS software where the results are generated as
measure of central tendency and dispersion specifically mean, median, standard deviation, skewness
and kurtosis. The value represents based on the commands given in the SPSS analysis drop box.
However, descriptive analysis could only be performed on the dependent variable as changes in
percentage for Scope 1 and 2 emissions for the reporting year in metric tonnes (CO2e per unit
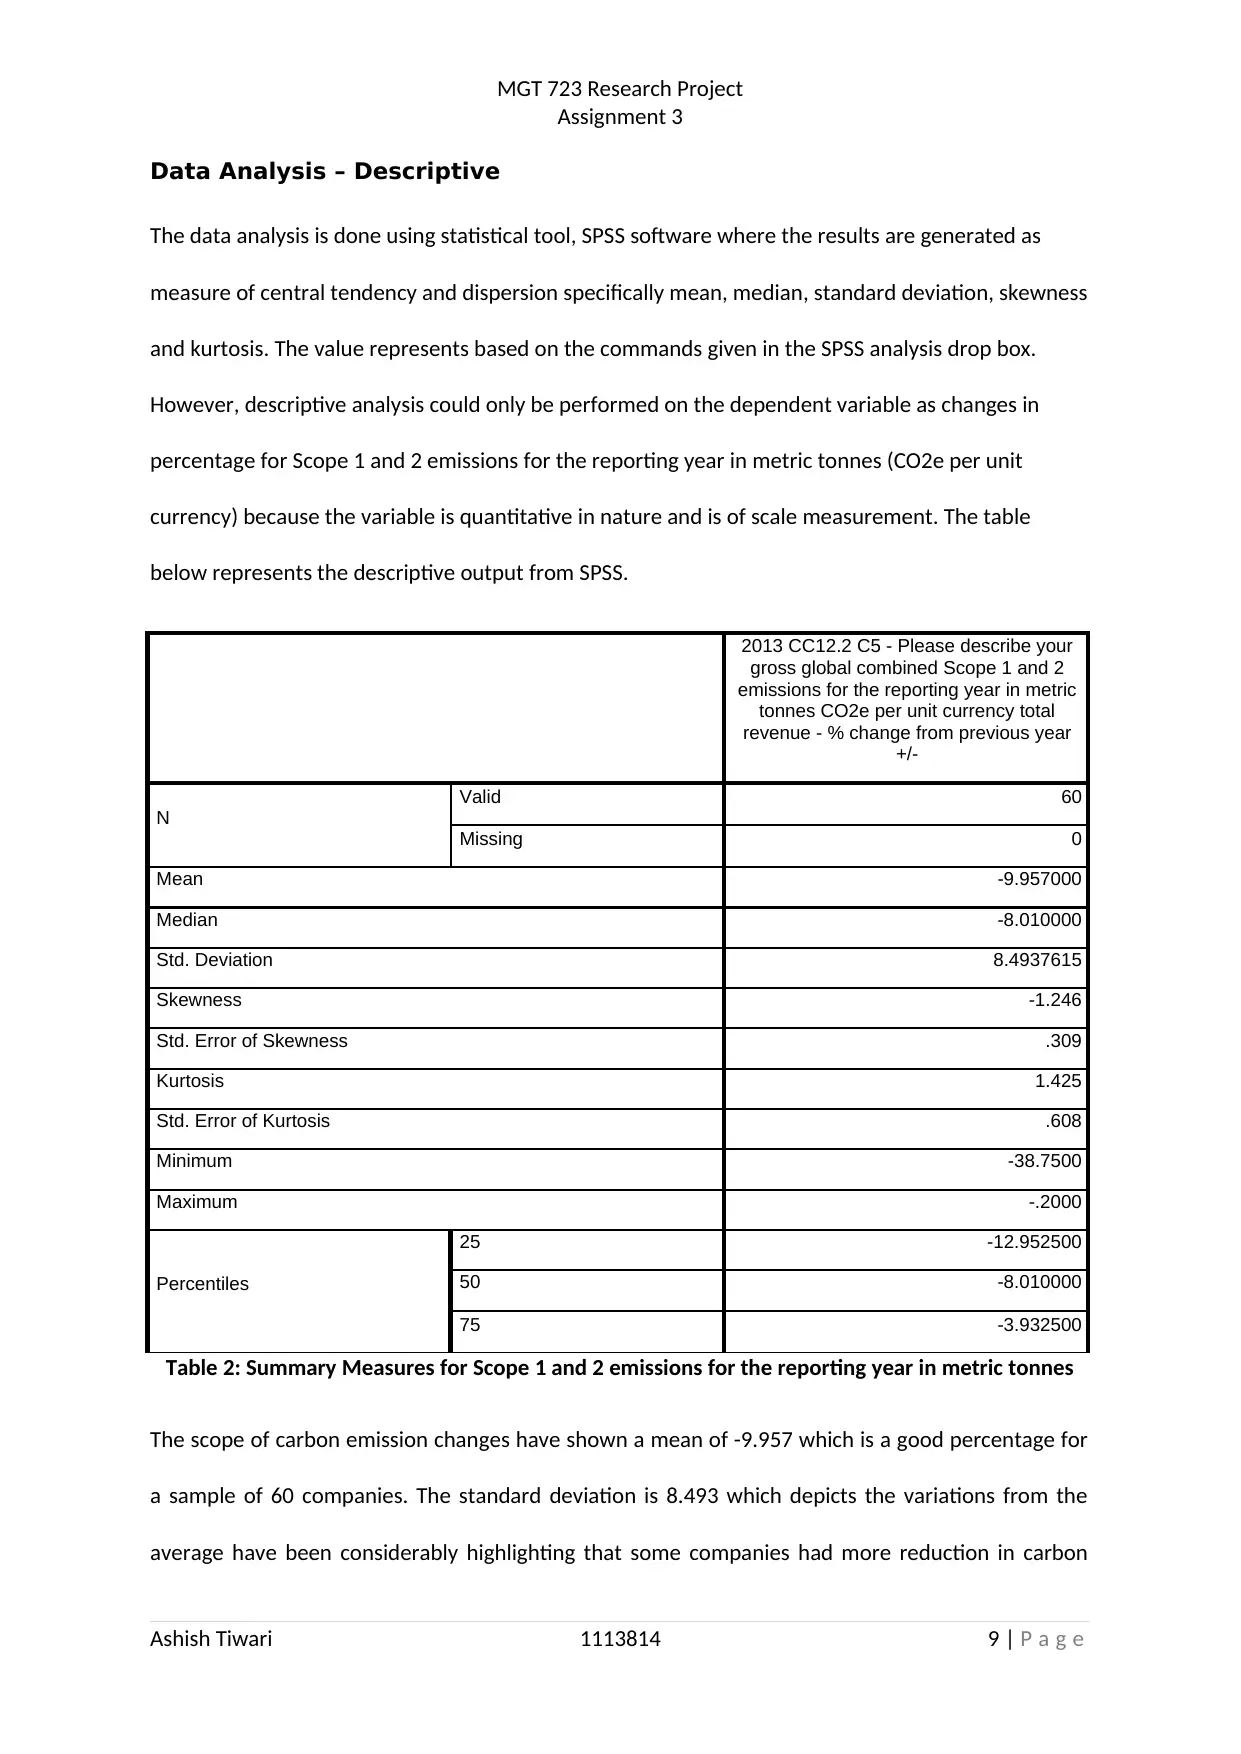
currency) because the variable is quantitative in nature and is of scale measurement. The table
below represents the descriptive output from SPSS.
2013 CC12.2 C5 - Please describe your
gross global combined Scope 1 and 2
emissions for the reporting year in metric
tonnes CO2e per unit currency total
revenue - % change from previous year
+/-
N
Valid 60
Missing 0
Mean -9.957000
Median -8.010000
Std. Deviation 8.4937615
Skewness -1.246
Std. Error of Skewness .309
Kurtosis 1.425
Std. Error of Kurtosis .608
Minimum -38.7500
Maximum -.2000
Percentiles
25 -12.952500
50 -8.010000
75 -3.932500
Table 2: Summary Measures for Scope 1 and 2 emissions for the reporting year in metric tonnes
The scope of carbon emission changes have shown a mean of -9.957 which is a good percentage for
a sample of 60 companies. The standard deviation is 8.493 which depicts the variations from the
average have been considerably highlighting that some companies had more reduction in carbon
Ashish Tiwari 1113814 9 | P a g e
Assignment 3
Data Analysis – Descriptive
The data analysis is done using statistical tool, SPSS software where the results are generated as
measure of central tendency and dispersion specifically mean, median, standard deviation, skewness
and kurtosis. The value represents based on the commands given in the SPSS analysis drop box.
However, descriptive analysis could only be performed on the dependent variable as changes in
percentage for Scope 1 and 2 emissions for the reporting year in metric tonnes (CO2e per unit
currency) because the variable is quantitative in nature and is of scale measurement. The table
below represents the descriptive output from SPSS.
2013 CC12.2 C5 - Please describe your
gross global combined Scope 1 and 2
emissions for the reporting year in metric
tonnes CO2e per unit currency total
revenue - % change from previous year
+/-
N
Valid 60
Missing 0
Mean -9.957000
Median -8.010000
Std. Deviation 8.4937615
Skewness -1.246
Std. Error of Skewness .309
Kurtosis 1.425
Std. Error of Kurtosis .608
Minimum -38.7500
Maximum -.2000
Percentiles
25 -12.952500
50 -8.010000
75 -3.932500
Table 2: Summary Measures for Scope 1 and 2 emissions for the reporting year in metric tonnes
The scope of carbon emission changes have shown a mean of -9.957 which is a good percentage for
a sample of 60 companies. The standard deviation is 8.493 which depicts the variations from the
average have been considerably highlighting that some companies had more reduction in carbon
Ashish Tiwari 1113814 9 | P a g e
⊘ This is a preview!⊘
Do you want full access?
Subscribe today to unlock all pages.
Trusted by 1+ million students worldwide
MGT 723 Research Project
Assignment 3
emission. This can be further strengthened by percentile scores, a 25th percentile score depicts the
major changes does in this part which is -12.952 followed by 50th percentile and later by 75th
percentile. The skewness and kurtosis of the distribution is negatively skewed and is leptokurtic in
nature depicting that mean , median and mode are not equal and mode > median > mean.
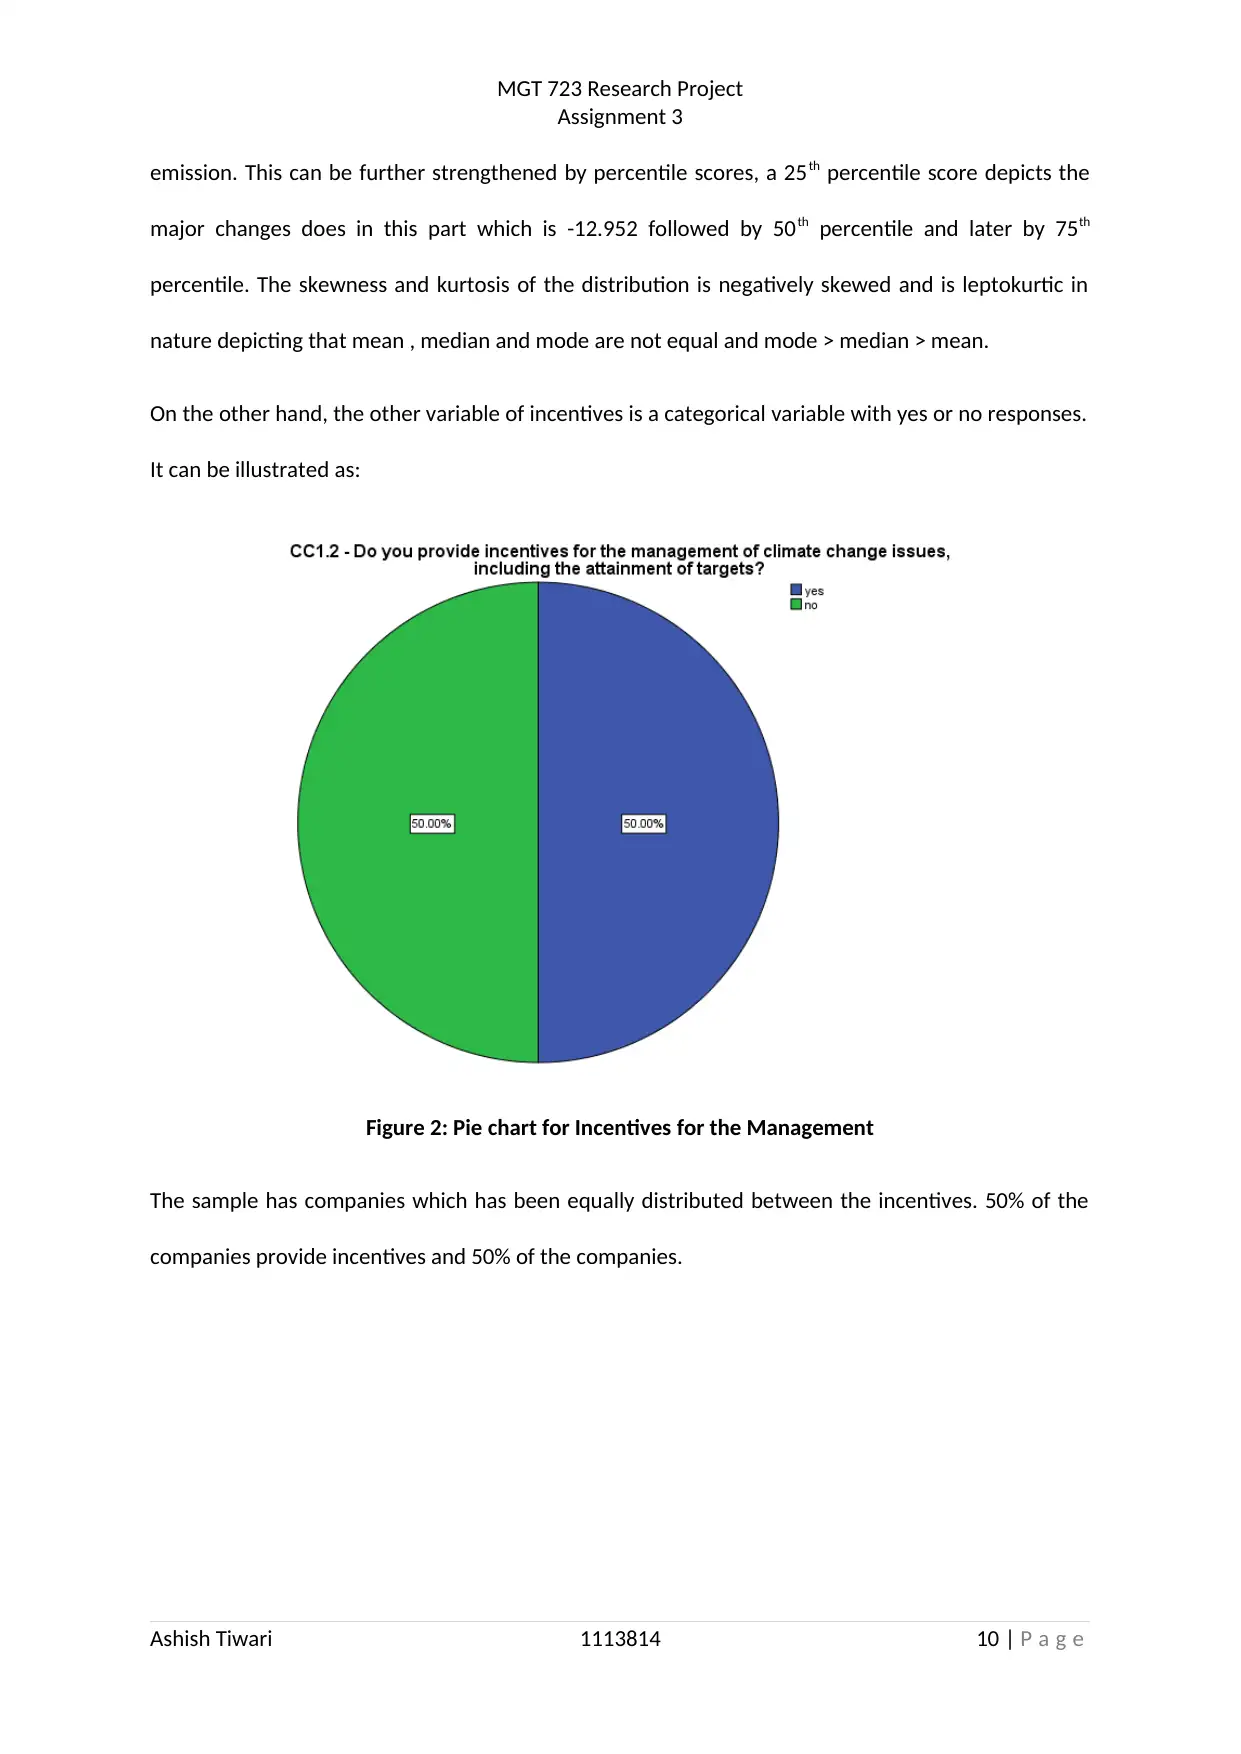
On the other hand, the other variable of incentives is a categorical variable with yes or no responses.
It can be illustrated as:
Figure 2: Pie chart for Incentives for the Management
The sample has companies which has been equally distributed between the incentives. 50% of the
companies provide incentives and 50% of the companies.
Ashish Tiwari 1113814 10 | P a g e
Assignment 3
emission. This can be further strengthened by percentile scores, a 25th percentile score depicts the
major changes does in this part which is -12.952 followed by 50th percentile and later by 75th
percentile. The skewness and kurtosis of the distribution is negatively skewed and is leptokurtic in
nature depicting that mean , median and mode are not equal and mode > median > mean.
On the other hand, the other variable of incentives is a categorical variable with yes or no responses.
It can be illustrated as:
Figure 2: Pie chart for Incentives for the Management
The sample has companies which has been equally distributed between the incentives. 50% of the
companies provide incentives and 50% of the companies.
Ashish Tiwari 1113814 10 | P a g e
Paraphrase This Document
Need a fresh take? Get an instant paraphrase of this document with our AI Paraphraser
MGT 723 Research Project
Assignment 3
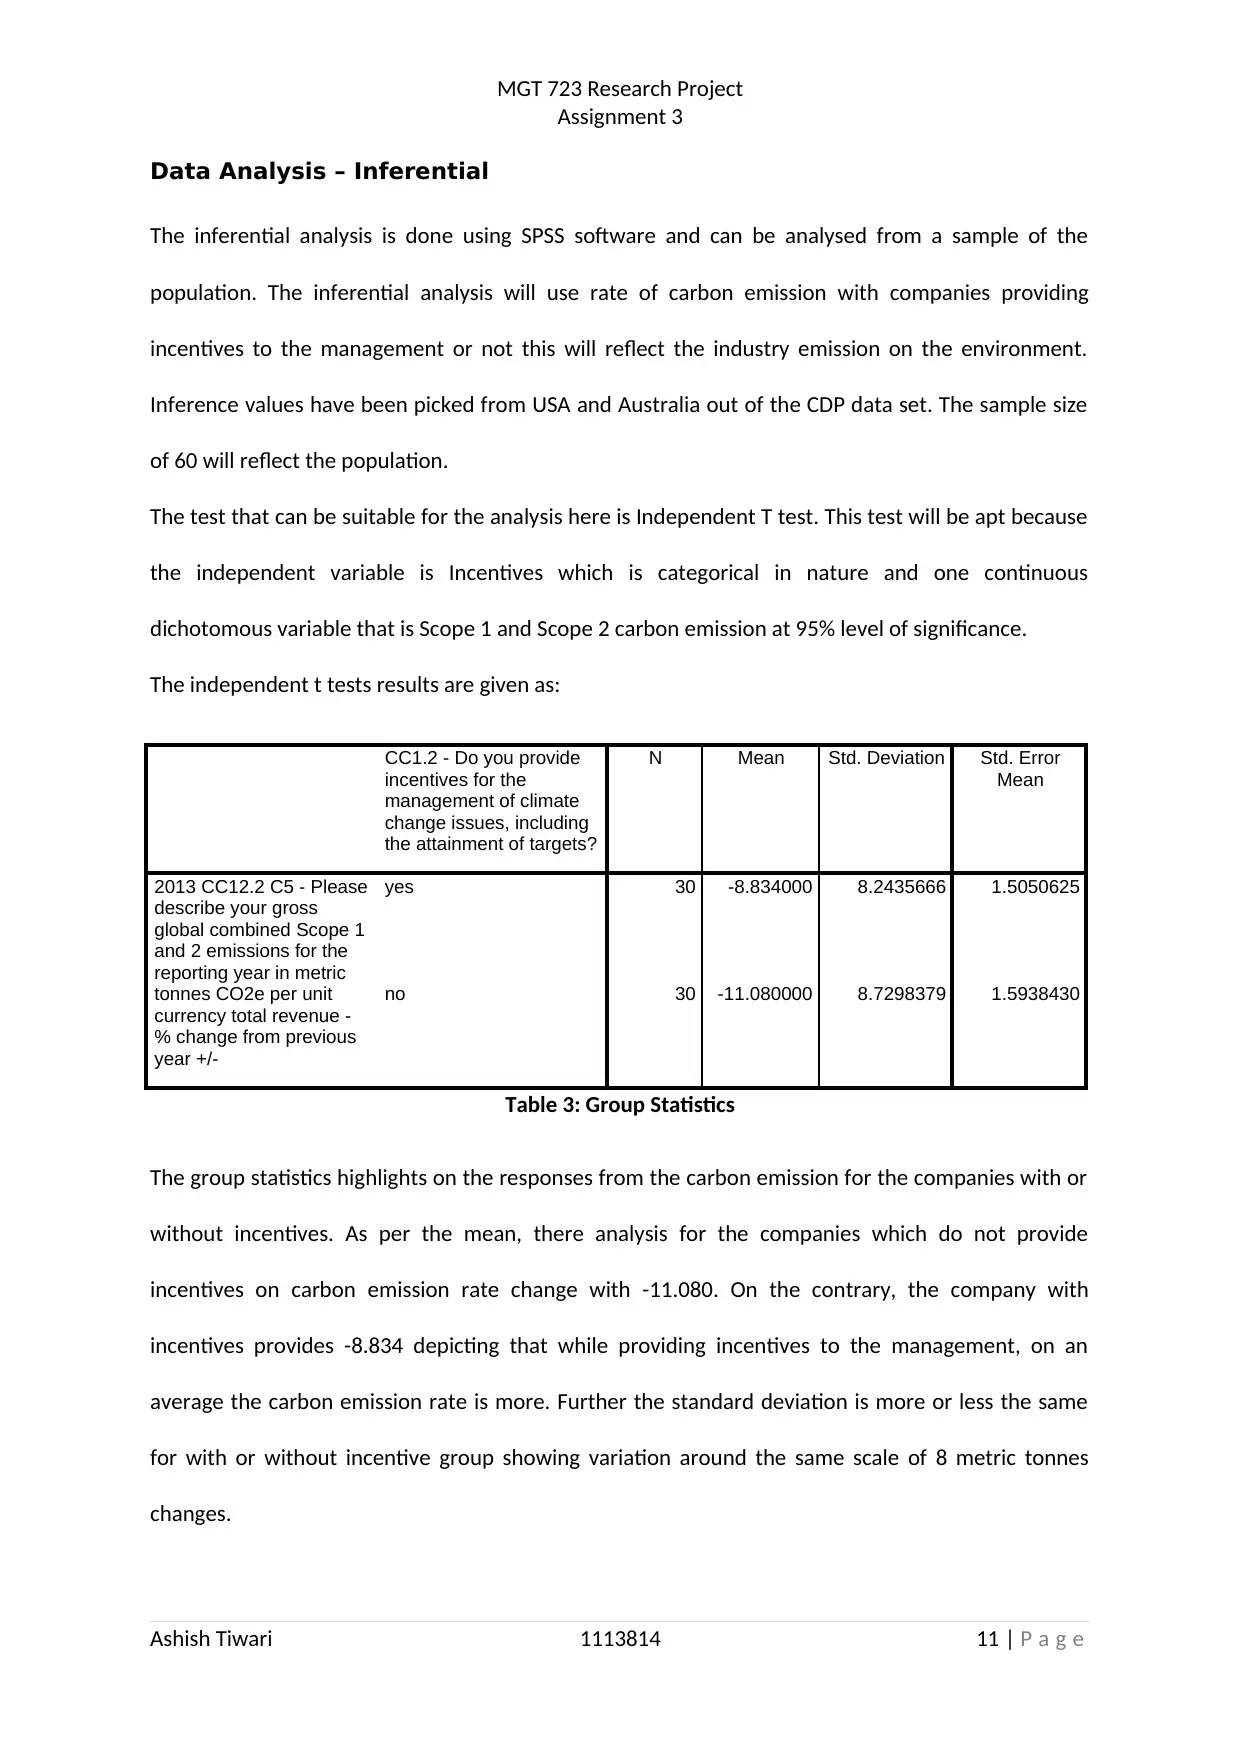
Data Analysis – Inferential
The inferential analysis is done using SPSS software and can be analysed from a sample of the
population. The inferential analysis will use rate of carbon emission with companies providing
incentives to the management or not this will reflect the industry emission on the environment.
Inference values have been picked from USA and Australia out of the CDP data set. The sample size
of 60 will reflect the population.
The test that can be suitable for the analysis here is Independent T test. This test will be apt because
the independent variable is Incentives which is categorical in nature and one continuous
dichotomous variable that is Scope 1 and Scope 2 carbon emission at 95% level of significance.
The independent t tests results are given as:
CC1.2 - Do you provide
incentives for the
management of climate
change issues, including
the attainment of targets?
N Mean Std. Deviation Std. Error
Mean
2013 CC12.2 C5 - Please
describe your gross
global combined Scope 1
and 2 emissions for the
reporting year in metric
tonnes CO2e per unit
currency total revenue -
% change from previous
year +/-
yes 30 -8.834000 8.2435666 1.5050625
no 30 -11.080000 8.7298379 1.5938430
Table 3: Group Statistics
The group statistics highlights on the responses from the carbon emission for the companies with or
without incentives. As per the mean, there analysis for the companies which do not provide
incentives on carbon emission rate change with -11.080. On the contrary, the company with
incentives provides -8.834 depicting that while providing incentives to the management, on an
average the carbon emission rate is more. Further the standard deviation is more or less the same
for with or without incentive group showing variation around the same scale of 8 metric tonnes
changes.
Ashish Tiwari 1113814 11 | P a g e
Assignment 3
Data Analysis – Inferential
The inferential analysis is done using SPSS software and can be analysed from a sample of the
population. The inferential analysis will use rate of carbon emission with companies providing
incentives to the management or not this will reflect the industry emission on the environment.
Inference values have been picked from USA and Australia out of the CDP data set. The sample size
of 60 will reflect the population.
The test that can be suitable for the analysis here is Independent T test. This test will be apt because
the independent variable is Incentives which is categorical in nature and one continuous
dichotomous variable that is Scope 1 and Scope 2 carbon emission at 95% level of significance.
The independent t tests results are given as:
CC1.2 - Do you provide
incentives for the
management of climate
change issues, including
the attainment of targets?
N Mean Std. Deviation Std. Error
Mean
2013 CC12.2 C5 - Please
describe your gross
global combined Scope 1
and 2 emissions for the
reporting year in metric
tonnes CO2e per unit
currency total revenue -
% change from previous
year +/-
yes 30 -8.834000 8.2435666 1.5050625
no 30 -11.080000 8.7298379 1.5938430
Table 3: Group Statistics
The group statistics highlights on the responses from the carbon emission for the companies with or
without incentives. As per the mean, there analysis for the companies which do not provide
incentives on carbon emission rate change with -11.080. On the contrary, the company with
incentives provides -8.834 depicting that while providing incentives to the management, on an
average the carbon emission rate is more. Further the standard deviation is more or less the same
for with or without incentive group showing variation around the same scale of 8 metric tonnes
changes.
Ashish Tiwari 1113814 11 | P a g e
MGT 723 Research Project
Assignment 3
Levene's
Test for
Equality
of
Variances
t-test for Equality of Means
F Sig. t df Sig.
(2-
tailed
)
Mean
Difference
Std. Error
Difference
95%
Confidenc
e Interval
of the
Difference
Lower Upper
2013
CC12.2
C5 -
Please
describe
your gross
global
combined
Scope 1
and 2
emissions
for the
reporting
year in
metric
tonnes
CO2e per
unit
currency
total
revenue -
% change
from
previous
year +/-
Equal
variances
assumed
.00
6
.93
8
1.02
5 58 .310 2.246000
0
2.192156
2
-
2.1420773
6.634077
3
Equal
variances
not
assumed
1.02
5
57.81
1 .310 2.246000
0
2.192156
2
-
2.1423836
6.634383
6
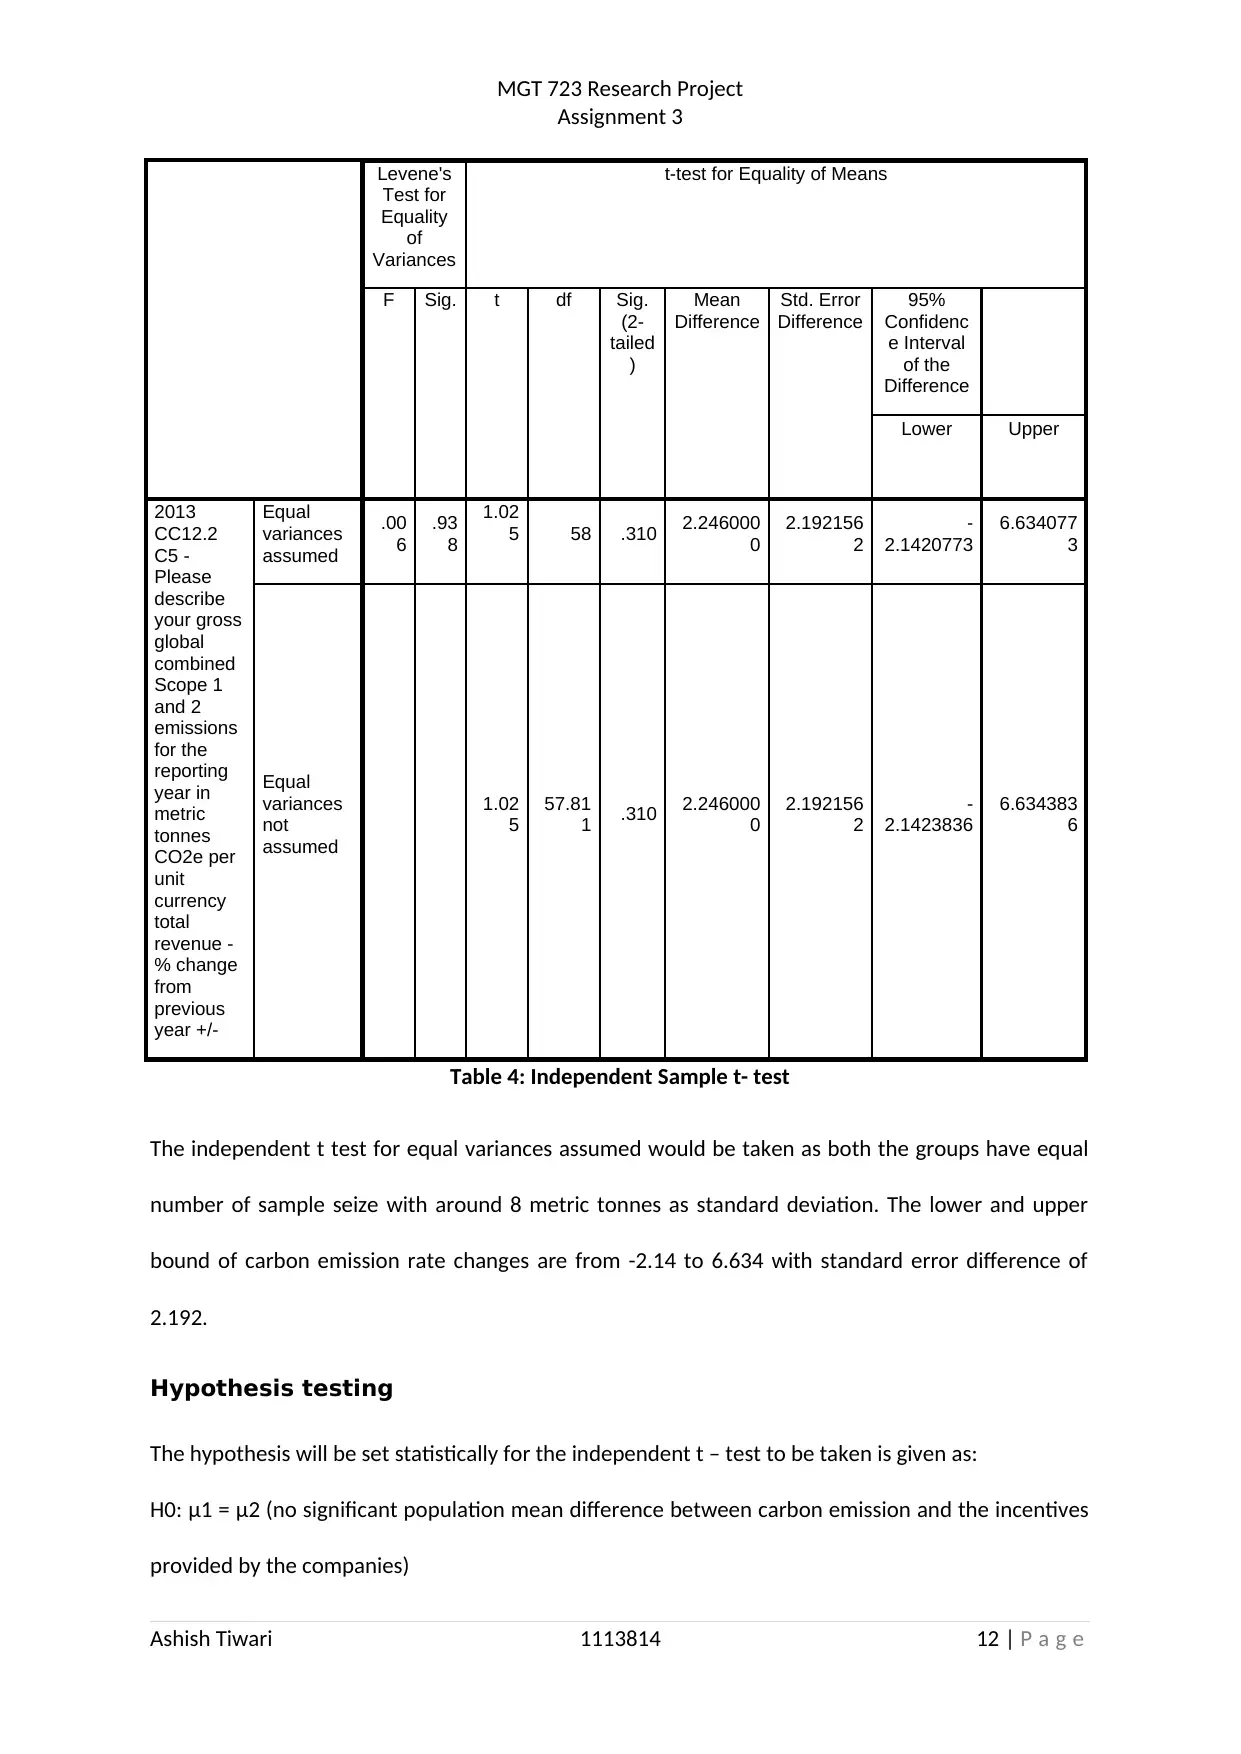
Table 4: Independent Sample t- test
The independent t test for equal variances assumed would be taken as both the groups have equal
number of sample seize with around 8 metric tonnes as standard deviation. The lower and upper
bound of carbon emission rate changes are from -2.14 to 6.634 with standard error difference of
2.192.
Hypothesis testing
The hypothesis will be set statistically for the independent t – test to be taken is given as:
H0: μ1 = μ2 (no significant population mean difference between carbon emission and the incentives
provided by the companies)
Ashish Tiwari 1113814 12 | P a g e
Assignment 3
Levene's
Test for
Equality
of
Variances
t-test for Equality of Means
F Sig. t df Sig.
(2-
tailed
)
Mean
Difference
Std. Error
Difference
95%
Confidenc
e Interval
of the
Difference
Lower Upper
2013
CC12.2
C5 -
Please
describe
your gross
global
combined
Scope 1
and 2
emissions
for the
reporting
year in
metric
tonnes
CO2e per
unit
currency
total
revenue -
% change
from
previous
year +/-
Equal
variances
assumed
.00
6
.93
8
1.02
5 58 .310 2.246000
0
2.192156
2
-
2.1420773
6.634077
3
Equal
variances
not
assumed
1.02
5
57.81
1 .310 2.246000
0
2.192156
2
-
2.1423836
6.634383
6
Table 4: Independent Sample t- test
The independent t test for equal variances assumed would be taken as both the groups have equal
number of sample seize with around 8 metric tonnes as standard deviation. The lower and upper
bound of carbon emission rate changes are from -2.14 to 6.634 with standard error difference of
2.192.
Hypothesis testing
The hypothesis will be set statistically for the independent t – test to be taken is given as:
H0: μ1 = μ2 (no significant population mean difference between carbon emission and the incentives
provided by the companies)
Ashish Tiwari 1113814 12 | P a g e
⊘ This is a preview!⊘
Do you want full access?
Subscribe today to unlock all pages.
Trusted by 1+ million students worldwide
1 out of 18
Related Documents


Your All-in-One AI-Powered Toolkit for Academic Success.
+13062052269
info@desklib.com
Available 24*7 on WhatsApp / Email
![[object Object]](/_next/static/media/star-bottom.7253800d.svg)
Unlock your academic potential
Copyright © 2020–2026 A2Z Services. All Rights Reserved. Developed and managed by ZUCOL.