Carbon Emission Disclosure and Business Strategies Analysis

Verified

Added on  2021/05/31

|14
|2235
|190
Report
AI Summary
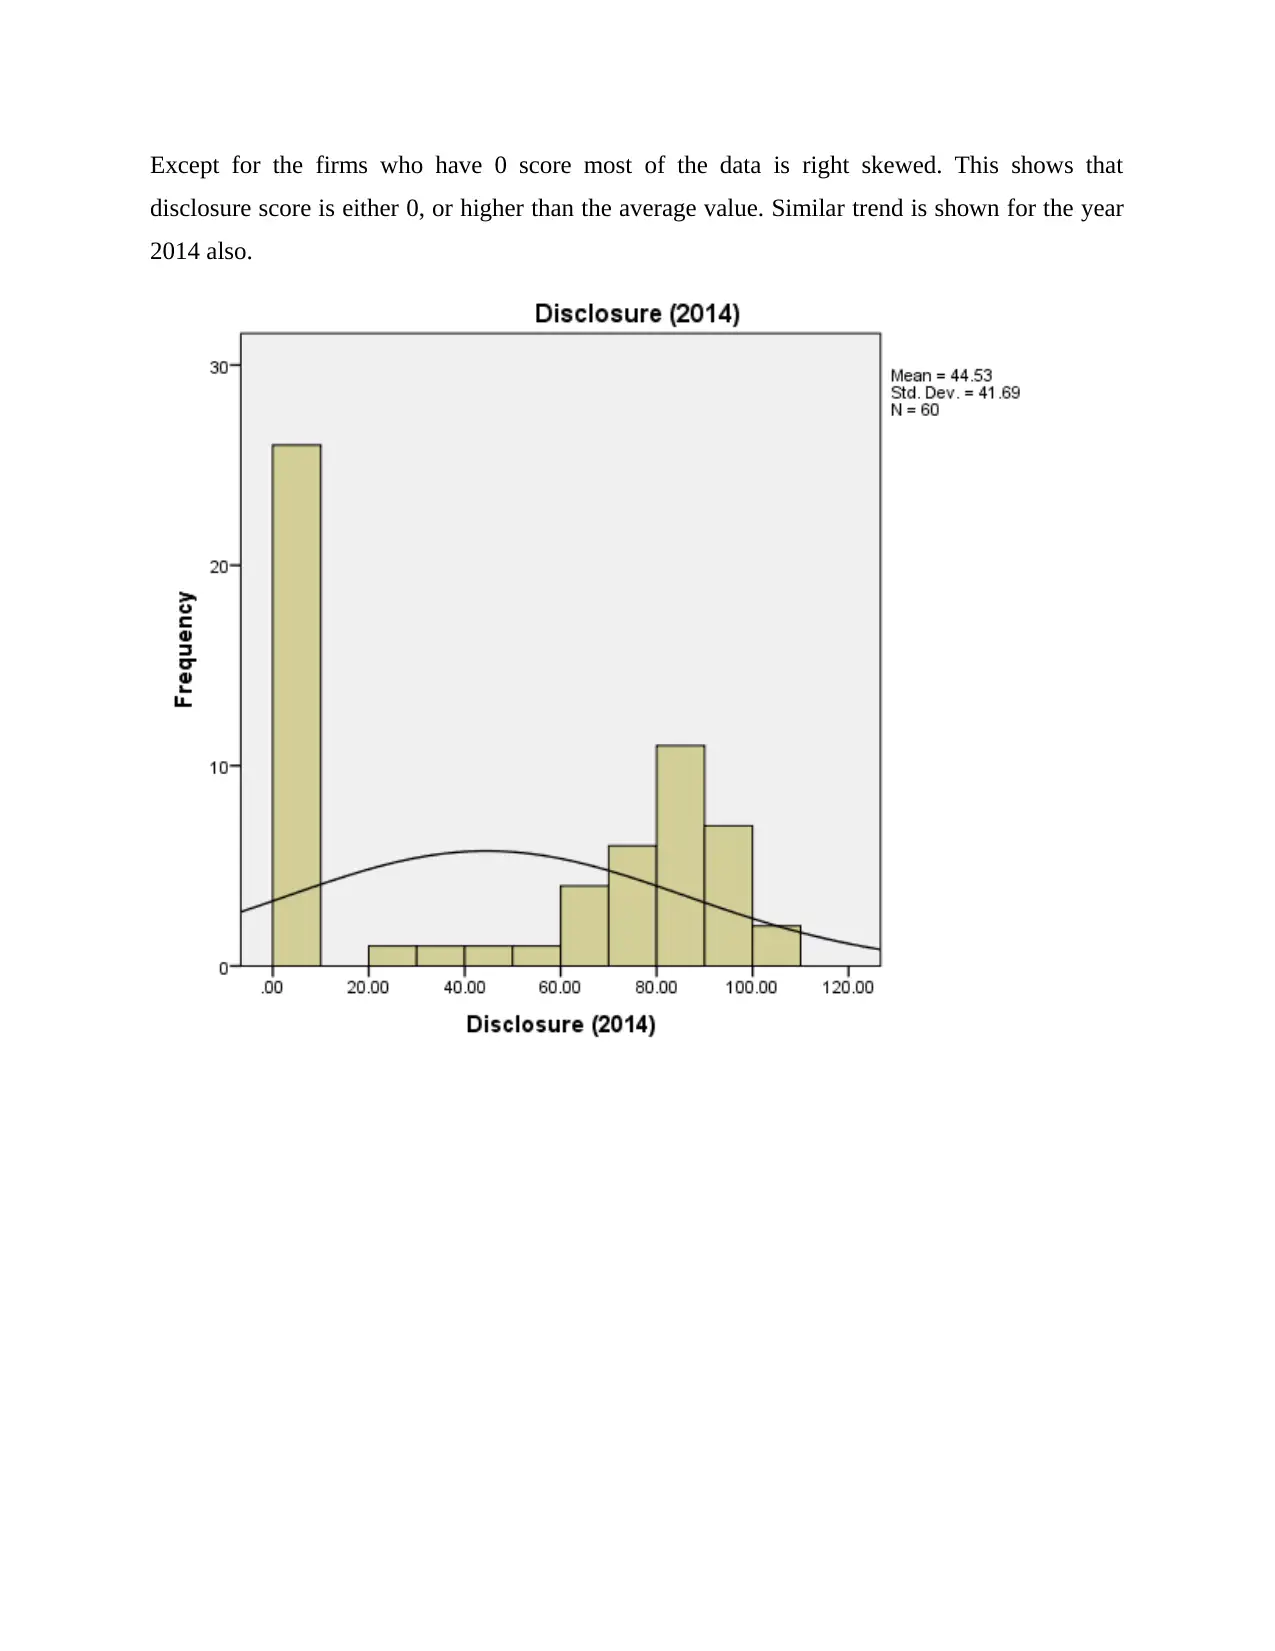
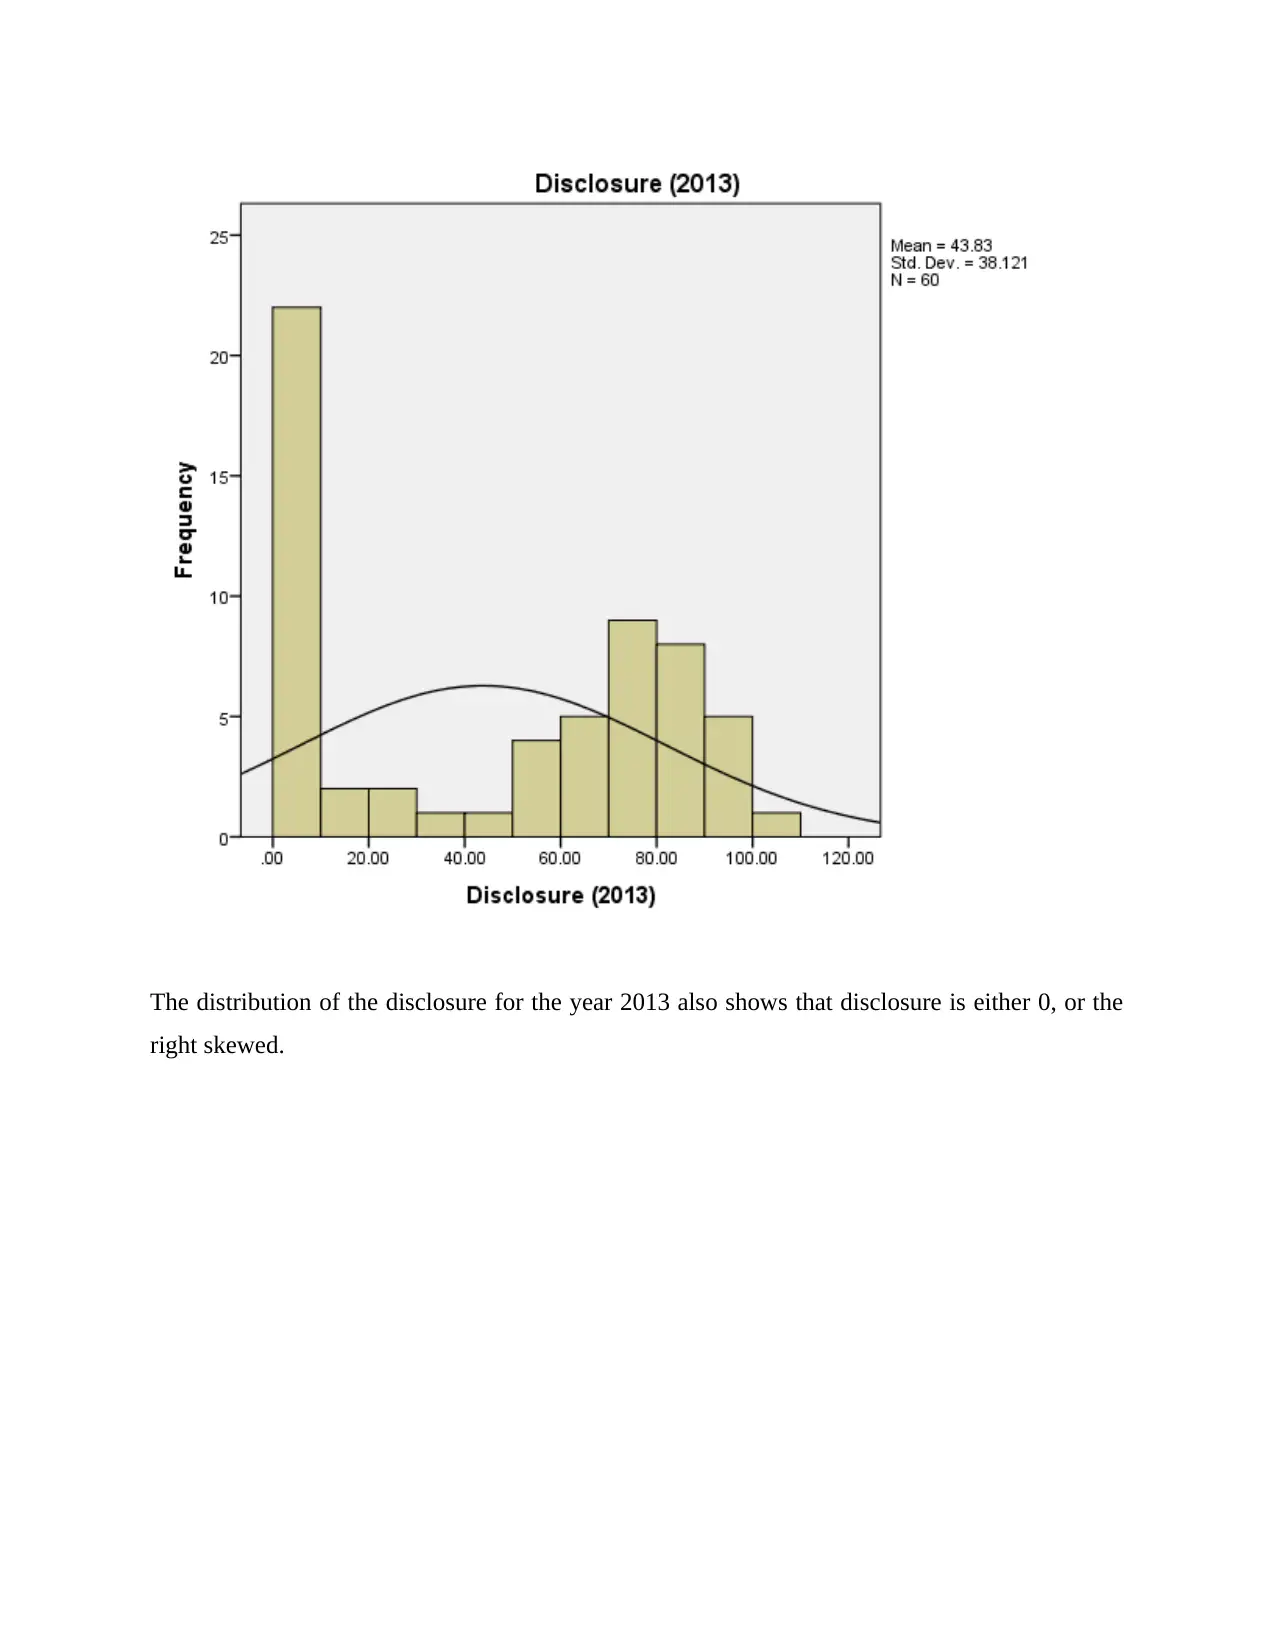
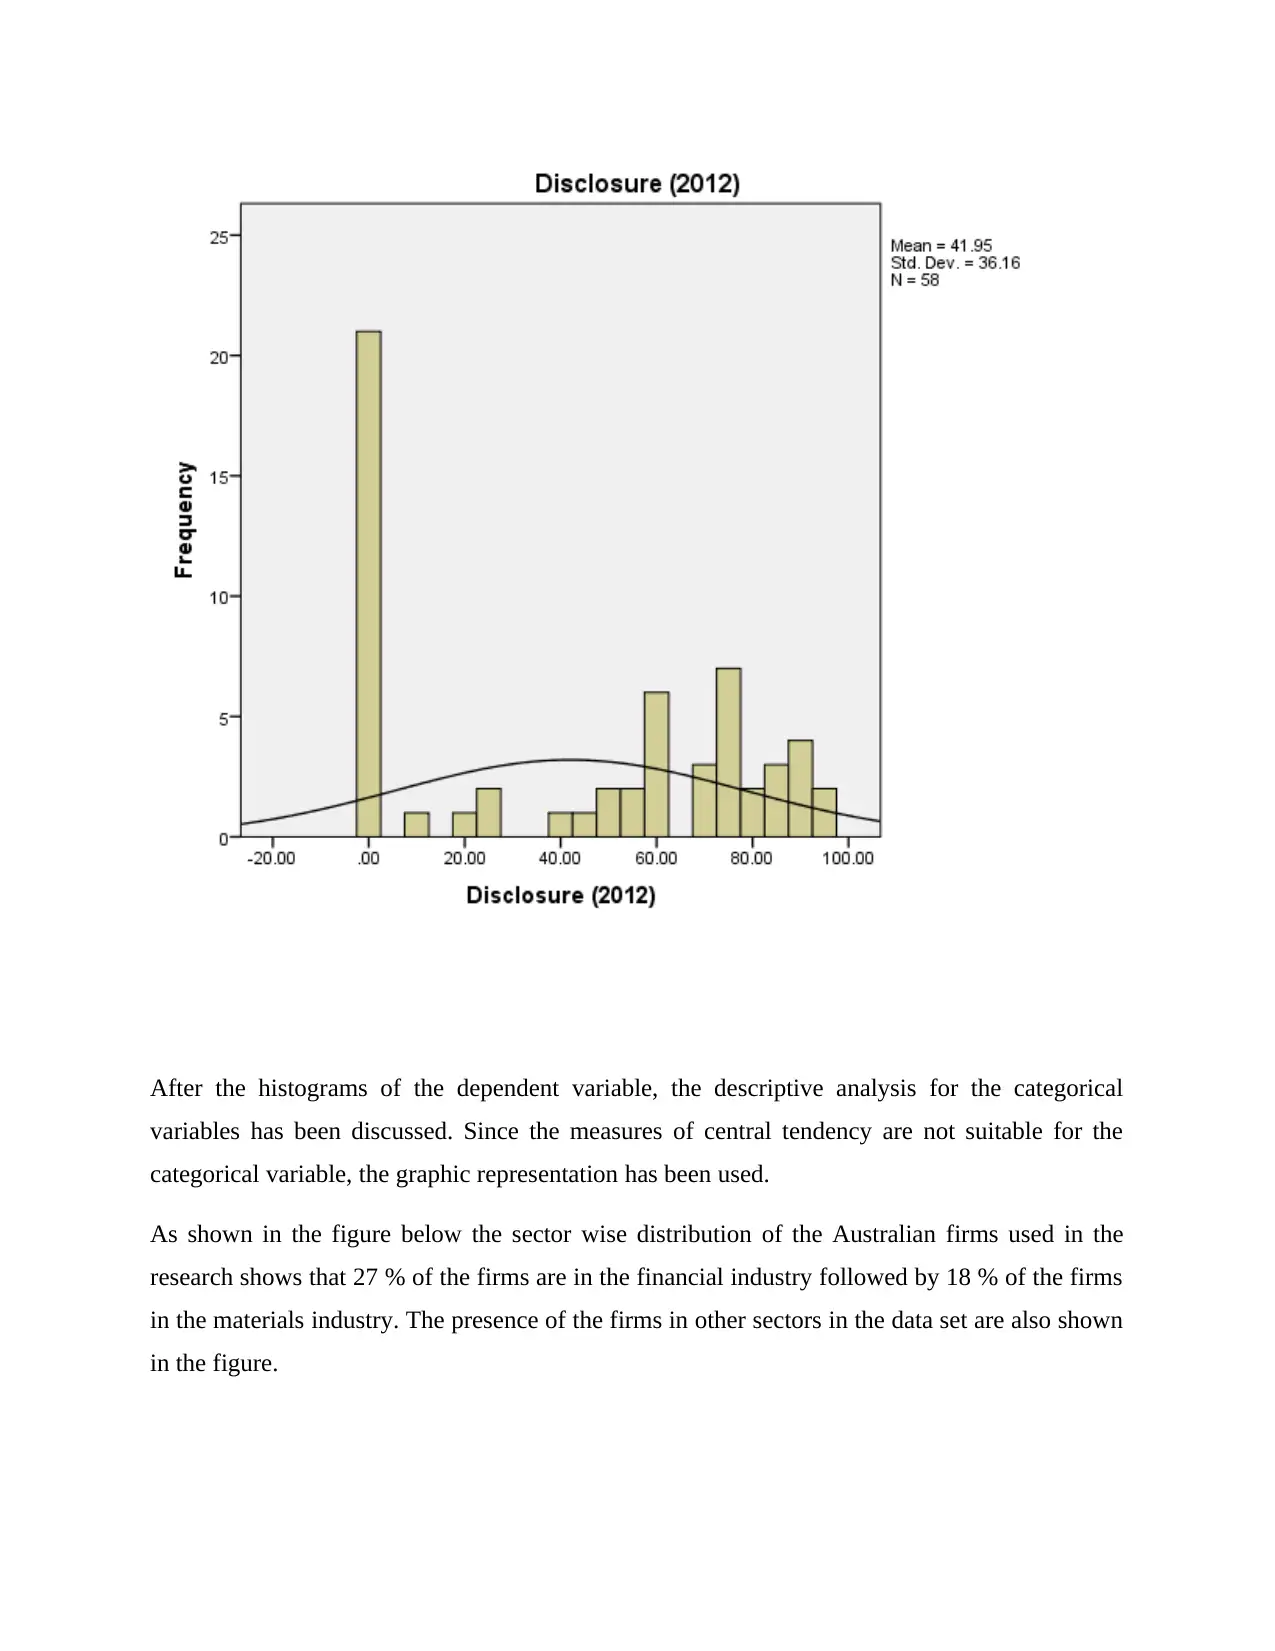
This report investigates the relationship between voluntary carbon emission disclosures of Australian firms and their climate change business strategies, framed within the context of agency theory. The study, based on a sample of 60 firms, analyzes data from 2012 to 2015, employing descriptive, correlational, and regression analyses. Descriptive statistics reveal an increasing, though not always significant, trend in disclosure scores. Inferential analysis, including chi-square, correlation, and regression, examines the impact of various independent variables on disclosure scores. The findings indicate a negative and significant correlation between disclosure scores and an intensity figure, while a regression model highlights the significance of specific independent variables like the intensity figure and a sector variable. The report offers insights into the determinants of carbon emission disclosures and their connection to business strategies, which can help firms and regulators to deal with climate change.
tabler-icon-diamond-filled.svg

Contribute Materials

Your contribution can guide someone’s learning journey. Share your documents today.
Document Page
Agency theory
The current research is aimed to examine the relationship between the voluntary disclosures of
the carbon emission of the firms with the various business strategies taken by the firms towards
the climate change. This relationship can be related to the agency theory. The original agent
theory which is also known as the principle agent problem, states that due to the asymmetric
information where the agents have more information than the principles, there is conflict of
interests. In this case the agents are the managers in the firms whereas the shareholders are the
principles. Similarly in the current research also the agency theory can be linked as the firms
have more information related to its emission as compared to the regulators who have limited
information. So, taking into account the agency theory, in the current research the impact of the
various business strategies taken by the firms and its impact on the voluntary disclosure of the
emission have been examined. This will not only help the firms to improve their strategies to
address the climate change but also allows the public and the regulators to know about the
current situation of emission in the firms.
Data collection
For the current research paper, the data was collected for the Australian firms. The sample size of
60 firms has been taken into consideration and the firms were selected randomly. The data
preprocessing was performed prior to analyzing the data in SPSS. The missing data were coded
as -99, the variables which were not useful for the research were removed from the data set. A
separate excel sheet has been attached with the data set used for the current research.
Data analysis (descriptive)
Descriptive analysis is conducted before the inferential analysis in every research as the
descriptive statistics helps the researcher to examine whether the data collected is appropriate for
the research or not. In this case also the inferential analysis is one of the important part of the
research, so the descriptive statistics has been conducted.
The results from the descriptive statistics is shown in the table below. The first descriptive
statistics shows the results for the disclosure score of the selected firms for the time period 2012
tabler-icon-diamond-filled.svg

Secure Best Marks with AI Grader

Need help grading? Try our AI Grader for instant feedback on your assignments.
Document Page
to 2015. Comparing the score for different time period will help to analyze the trend in the recent
years. As the results shows the mean disclosure score in 2012 was 41. 9 which has increased to
42.88 in 2015. This indicates that the disclosure score has increased over the years, however the
increase in not significant. In fact the disclosure score has declined in 2015 as compared to 2014
when the score was 44.53. The results from the mode shows that for most of the firms the
disclosure score is 0. Furthermore in case of the minimum and the maximum value, for all the
years except the 2012, the maximum score is 100 whereas the minimum score is 0 for all years.
Statistics
disclosure
(2015)
Disclosure
(2014)
Disclosure
(2013)
Disclosure
(2012)
N Valid 60 60 60 58
Missing 0 0 0 2
Mean 42.8833 44.5333 43.8333 41.9483
Median 16.0000 59.0000 54.0000 53.5000
Mode .00 .00 .00 .00
Std. Deviation 44.77934 41.68992 38.12076 36.15970
Variance 2005.190 1738.050 1453.192 1307.524
Skewness .158 -.019 -.069 -.068
Std. Error of
Skewness
.309 .309 .309 .314
Kurtosis -1.922 -1.875 -1.762 -1.709
Std. Error of Kurtosis .608 .608 .608 .618
Minimum .00 .00 .00 .00
Maximum 100.00 100.00 100.00 95.00
Percentiles
25 .0000 .0000 .0000 .0000
50 16.0000 59.0000 54.0000 53.5000
75 91.7500 83.7500 79.0000 75.0000
Document Page
The descriptive results for the independent variables is shown in Table 2 below. As the results
show the mean value for the first independent variable (intensity figure) is 9904 with the
standard deviation of 49666.98. This indicates high variation in the intensity figure as the
standard deviation is very high. Similarly the mean value for the IV3 (metric denominator) is
27554541. The Skewness for this variable is positive which indicates that the variable is right
skewed or most of the data set are higher than the series average. Results for the IV5 is also
shown in the table below, which shows the average value of 4.95 with standard deviation of 8.9.
Statistics
IV1 IV3 IV5
N Valid 26 26 26
Missing 34 34 34
Mean 9904.1930 275524541.3
669
8.1762
Median 3.3400 11614.5000 4.9500
Mode .00 .00 3.00a
Std. Deviation 49666.98328 1392667669.
74249
8.91552
Variance
2466809228.
476
19395232383
45974780.00
0
79.487
Skewness 5.098 5.099 1.862
Std. Error of
Skewness
.456 .456 .456
Kurtosis 25.996 25.998 4.084
Std. Error of Kurtosis .887 .887 .887
Minimum .00 .00 .00
Maximum 253408.00 7103500000.
00
38.00
Percentiles 25 .1793 1421.4925 1.8700
Document Page
50 3.3400 11614.5000 4.9500
75 132.8500 1203557.250
0
13.9500
a. Multiple modes exist. The smallest value is shown
Histograms
Furthermore the histograms of the dependent variable has also been show, which shows the
distribution of the variable. The dependent variable in the current research is the disclosure score
and the histogram for all the years have been shown differently.
tabler-icon-diamond-filled.svg

Secure Best Marks with AI Grader

Need help grading? Try our AI Grader for instant feedback on your assignments.
Document Page
Except for the firms who have 0 score most of the data is right skewed. This shows that
disclosure score is either 0, or higher than the average value. Similar trend is shown for the year
2014 also.
Document Page
The distribution of the disclosure for the year 2013 also shows that disclosure is either 0, or the
right skewed.
Document Page
After the histograms of the dependent variable, the descriptive analysis for the categorical
variables has been discussed. Since the measures of central tendency are not suitable for the
categorical variable, the graphic representation has been used.
As shown in the figure below the sector wise distribution of the Australian firms used in the
research shows that 27 % of the firms are in the financial industry followed by 18 % of the firms
in the materials industry. The presence of the firms in other sectors in the data set are also shown
in the figure.
tabler-icon-diamond-filled.svg

Paraphrase This Document

Need a fresh take? Get an instant paraphrase of this document with our AI Paraphraser
Document Page
27%
18%
13%
10%
13%
18%
Sector
Financials
Materials
Industrials
Utilities
Consumer Discretionary
Others
Similarly the results from the data which shows whether the disclosure score is published for
public or not, results shows that 57 % of the firms make it public whereas the rest of firm do not
make it public(Winn et al., 2011; Guo, 2014).
57%
43%
Disclosure is public or not
Yes
No
Document Page
46%
54%
IV2
full time equivalent (FTE)
employee
others
The descriptive results for the IV2 shows that for 46 % of the firm the metric denominator is full
time employee whereas for 54 % of the firms there are other metric denominator.
81%
19%
IV4
Location-based
Market-based
Document Page
Also, 81 % of the firms used the location based metric denominator whereas 19 % of the firms
follow the location based measures.
19%
73%
8%
IV6
Increase
Decrease
no change
When analyzed the direction of change of the carbon emission, for 73 % of the firms there is
decrease in the emission whereas for 19 % of the firm there is increase. Rest of the firms do not
show any change.
Data analysis (inferential)
Inferential analysis for the current research are based on the chi square, correlation and the
regression analysis.
Cross tabulation
The first chi square test is used to examine whether for different sectors the disclosure is
different or not. As the results in the table below shows the chi square value is not statistically
significant. This infer that there is no statistically difference in the mean disclosure value for
different firms.
Chi-Square Tests
tabler-icon-diamond-filled.svg

Secure Best Marks with AI Grader

Need help grading? Try our AI Grader for instant feedback on your assignments.
Document Page
Value df Asymp. Sig.
(2-sided)
Pearson Chi-Square 115.193a 100 .142
Likelihood Ratio 89.361 100 .768
Linear-by-Linear
Association
8.219 1 .004
N of Valid Cases 60
a. 123 cells (97.6%) have expected count less than 5. The
minimum expected count is .10.
Chi-Square Tests
Value df Asymp. Sig.
(2-sided)
Pearson Chi-Square 45.882a 20 .001
Likelihood Ratio 58.547 20 .000
Linear-by-Linear
Association
42.079 1 .000
N of Valid Cases 60
a. 40 cells (95.2%) have expected count less than 5. The
minimum expected count is .43.
However on the other hand there is statistically significant difference in the mean value of the
firm who make the disclosure public from those who do not make it public. This is because the
chi square is significant at 5 % significance level(ACCA, 2009).
Correlation
Document Page
Results from the correlation analysis suggests that the disclosure score (dependent variable ) is
negatively and significantly correlated with the first independent variable as the two tailed
significance value is less than 0.05. However the correlation with other independent variables is
positive but not significant.
Correlations
disclosure
(2015)
IV1 IV2 IV3 IV4 IV5
disclosure (2015)
Pearson Correlation 1 -.515** .116 .112 .104 .081
Sig. (2-tailed) .007 .574 .587 .615 .696
N 60 26 26 26 26 26
IV1
Pearson Correlation -.515** 1 .190 -.041 .419* .178
Sig. (2-tailed) .007 .352 .842 .033 .384
N 26 26 26 26 26 26
IV2
Pearson Correlation .116 .190 1 .190 .417* .025
Sig. (2-tailed) .574 .352 .351 .034 .902
N 26 26 26 26 26 26
IV3
Pearson Correlation .112 -.041 .190 1 -.055 -.062
Sig. (2-tailed) .587 .842 .351 .790 .764
N 26 26 26 26 26 26
IV4
Pearson Correlation .104 .419* .417* -.055 1 .067
Sig. (2-tailed) .615 .033 .034 .790 .744
N 26 26 26 26 26 26
IV5
Pearson Correlation .081 .178 .025 -.062 .067 1
Sig. (2-tailed) .696 .384 .902 .764 .744
N 26 26 26 26 26 26
IV6
Pearson Correlation .347 -.212 .126 .113 .006 .208
Sig. (2-tailed) .083 .300 .539 .583 .978 .307
N 26 26 26 26 26 26
**. Correlation is significant at the 0.01 level (2-tailed).
Document Page
*. Correlation is significant at the 0.05 level (2-tailed).
Regression analysis
The last inferential analysis is the regression analysis, which is one of the most popular
techniques used to predict the dependent variable based on the independent variable.
Model Summary
Model R R Square Adjusted R
Square
Std. Error of
the Estimate
1 .715a .511 .321 25.73643
a. Predictors: (Constant), IV6, IV4, IV3, IV5, GICS Sector
(Company), IV2, IV1
The R squared is 0.511 indicating that more than 50 % variation in the response variable is being
explained by the explanatory variables in the regression model. The R squared in this case is
satisfactory, taking into consideration the number of independent variable.
ANOVAa
Model Sum of
Squares
df Mean Square F Sig.
1
egression 12476.415 7 1782.345 2.691 .043b
Residual 11922.547 18 662.364
Total 24398.962 25
a. Dependent Variable: disclosure (2015)
b. Predictors: (Constant), IV6, IV4, IV3, IV5, GICS Sector (Company), IV2,
IV1
The F statistics value is 2.69 with the significance value of 0.043. Since the significance value is
less than 0.05, the cumulative effect of the independent variables on the dependent variable is
significant.
tabler-icon-diamond-filled.svg

Paraphrase This Document

Need a fresh take? Get an instant paraphrase of this document with our AI Paraphraser
Document Page
Coefficientsa
Model Unstandardized
Coefficients
Standardized
Coefficients
t Sig.
B Std. Error Beta
1
(Constant) 34.468 20.859 1.652 .116
GICS Sector
(Company)
-4.363 3.161 -.259 -1.380 .184
IV1 .000 .000 -.576 -2.850 .011
IV2 5.460 10.257 .102 .532 .601
IV3 1.919E-009 .000 .086 .501 .623
IV4 27.079 14.389 .374 1.882 .076
IV5 .520 .610 .148 .852 .406
IV6 10.142 9.018 .204 1.125 .276
a. Dependent Variable: disclosure (2015)
Among the different independent variables, all of them shows positive impact on the dependent
variable as the regression coefficients for all the variables is positive. However in terms of the
significance only IV1 and IV4 shows statistically significant results(Gasbarro and Pinkse, 2015;
Orsato, 2017).
References
ACCA (2009) High-impact Sectors: the Challenge of Reporting on Climate Change.
Gasbarro, F. and Pinkse, J. (2015) ‘Corporate Adaptation Behaviour to Deal With Climate
Change: The Influence of Firm‐Specific Interpretations of Physical Climate Impacts’, Corporate
Social Responsibility and Environmental Management, 23(3).
Guo, Y. (2014) Climate Change Disclosure : Determinants and impact. University of Hawai.
Orsato, R. J. (2017) ‘Organizational adaptation to climate change: learning to anticipate energy
chevron_up_icon
1 out of 14
circle_padding
hide_on_mobile
zoom_out_icon
logo.png

Your All-in-One AI-Powered Toolkit for Academic Success.

Available 24*7 on WhatsApp / Email

[object Object]