Carbon Emission Comparison: Stakeholder Theory in Canada & Germany
VerifiedAdded on 2023/06/06
|24
|5033
|217
Report
AI Summary
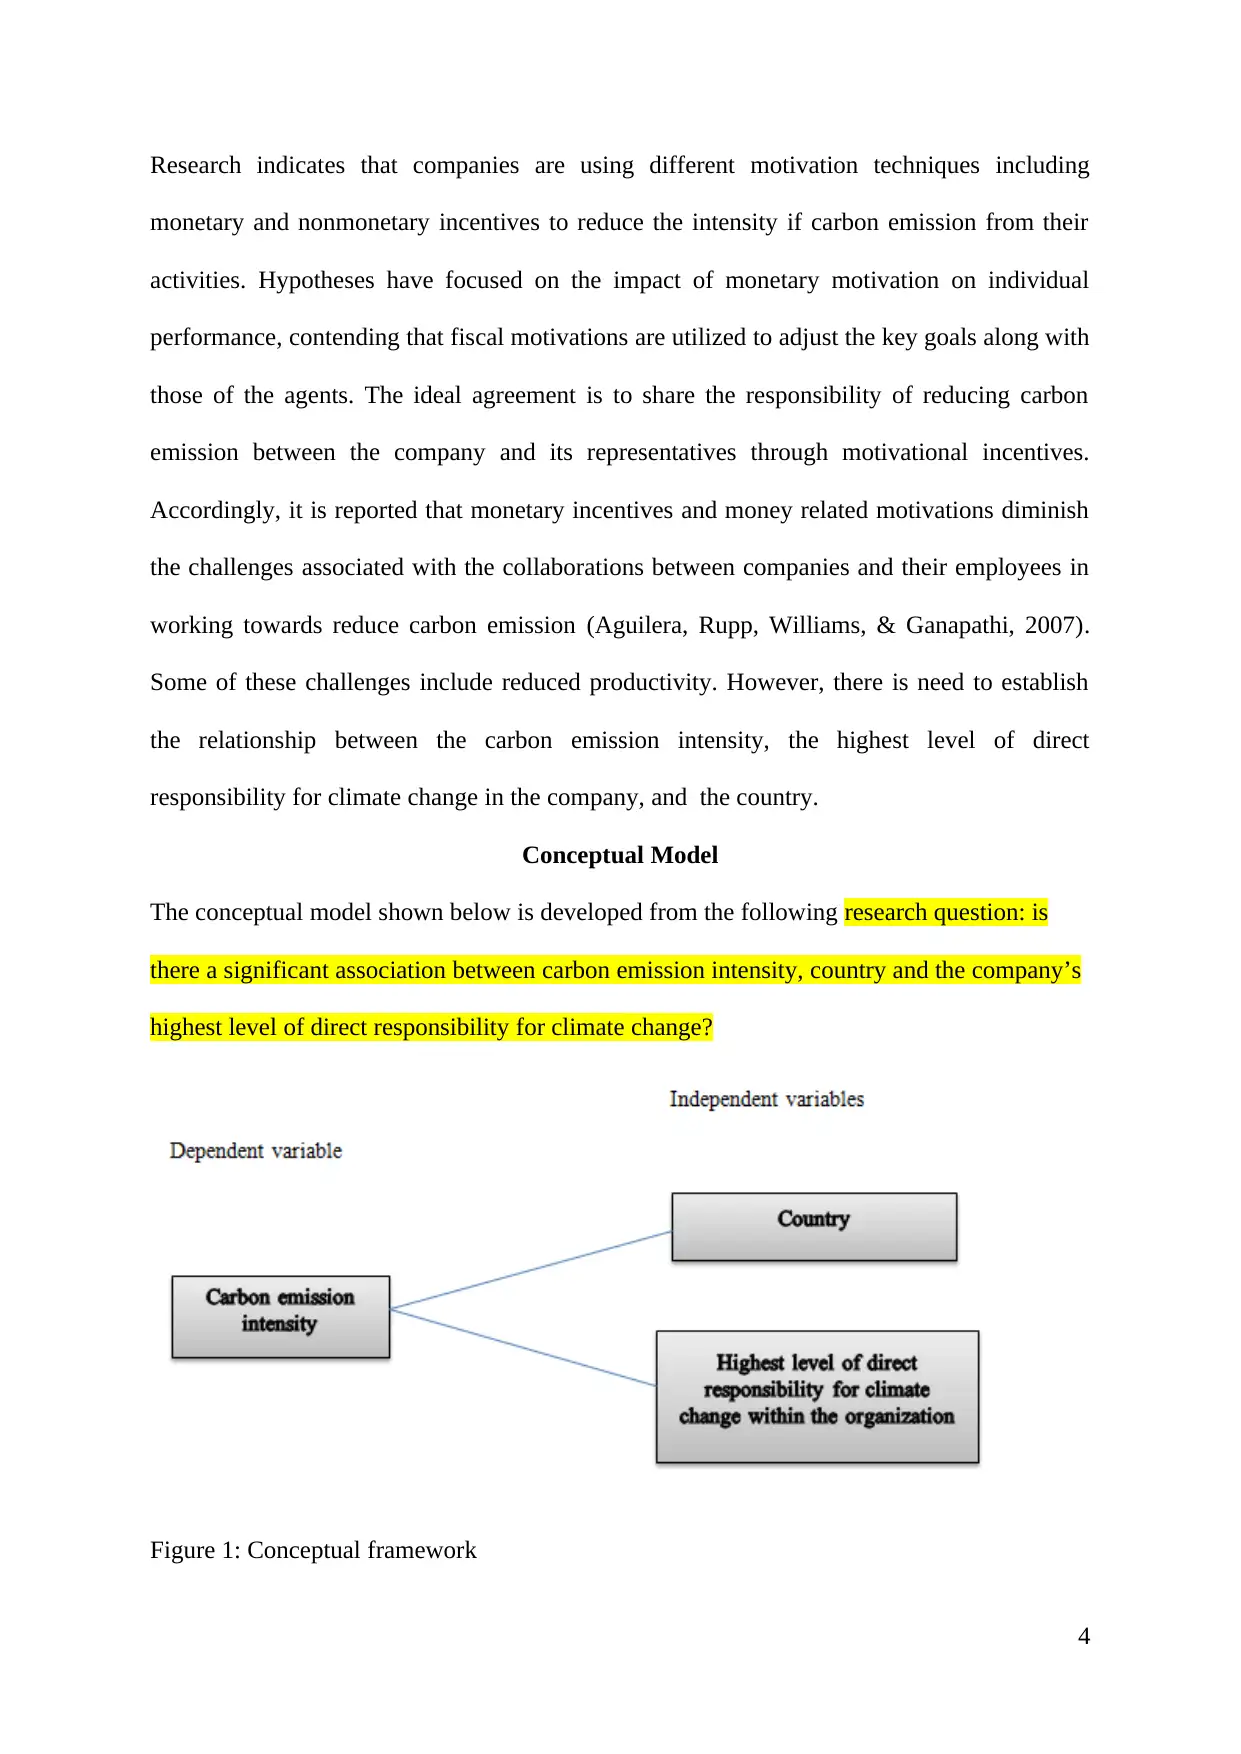
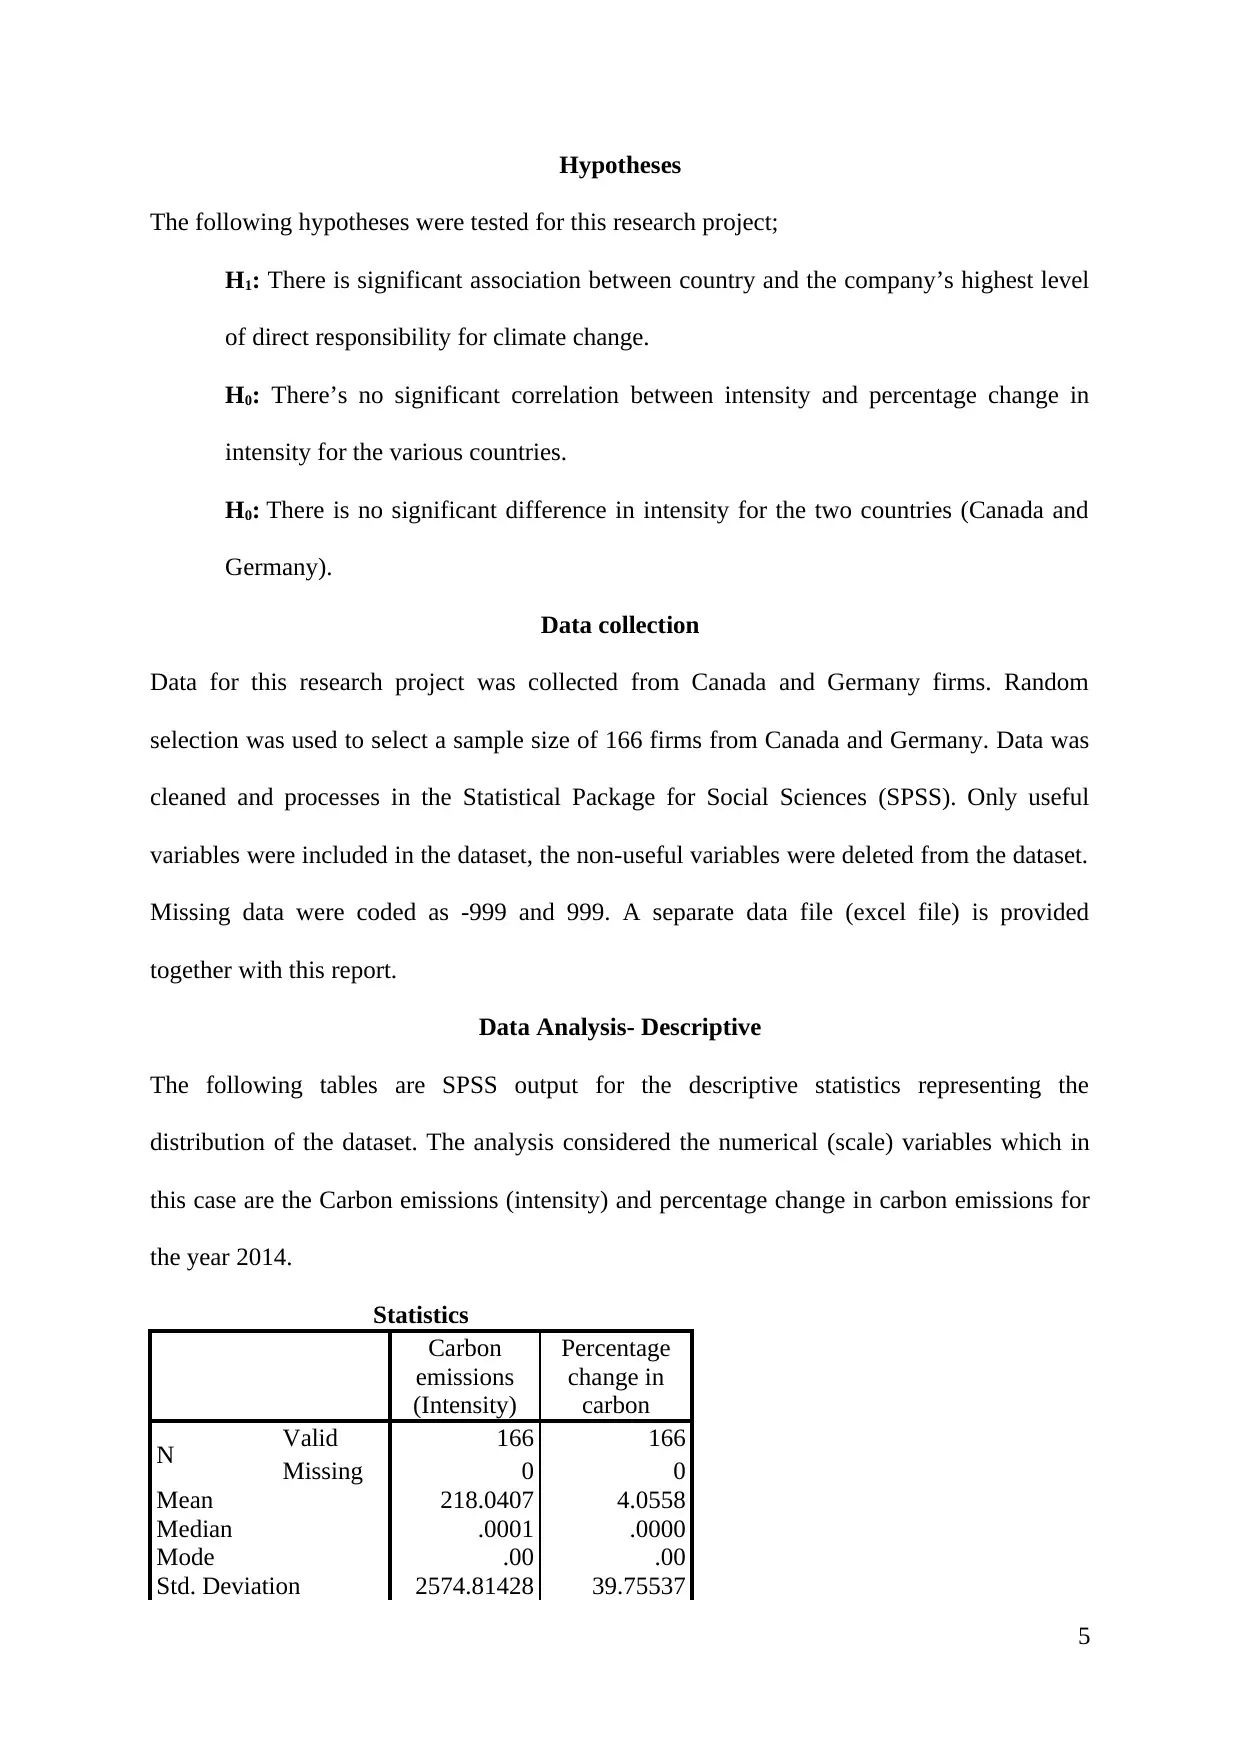
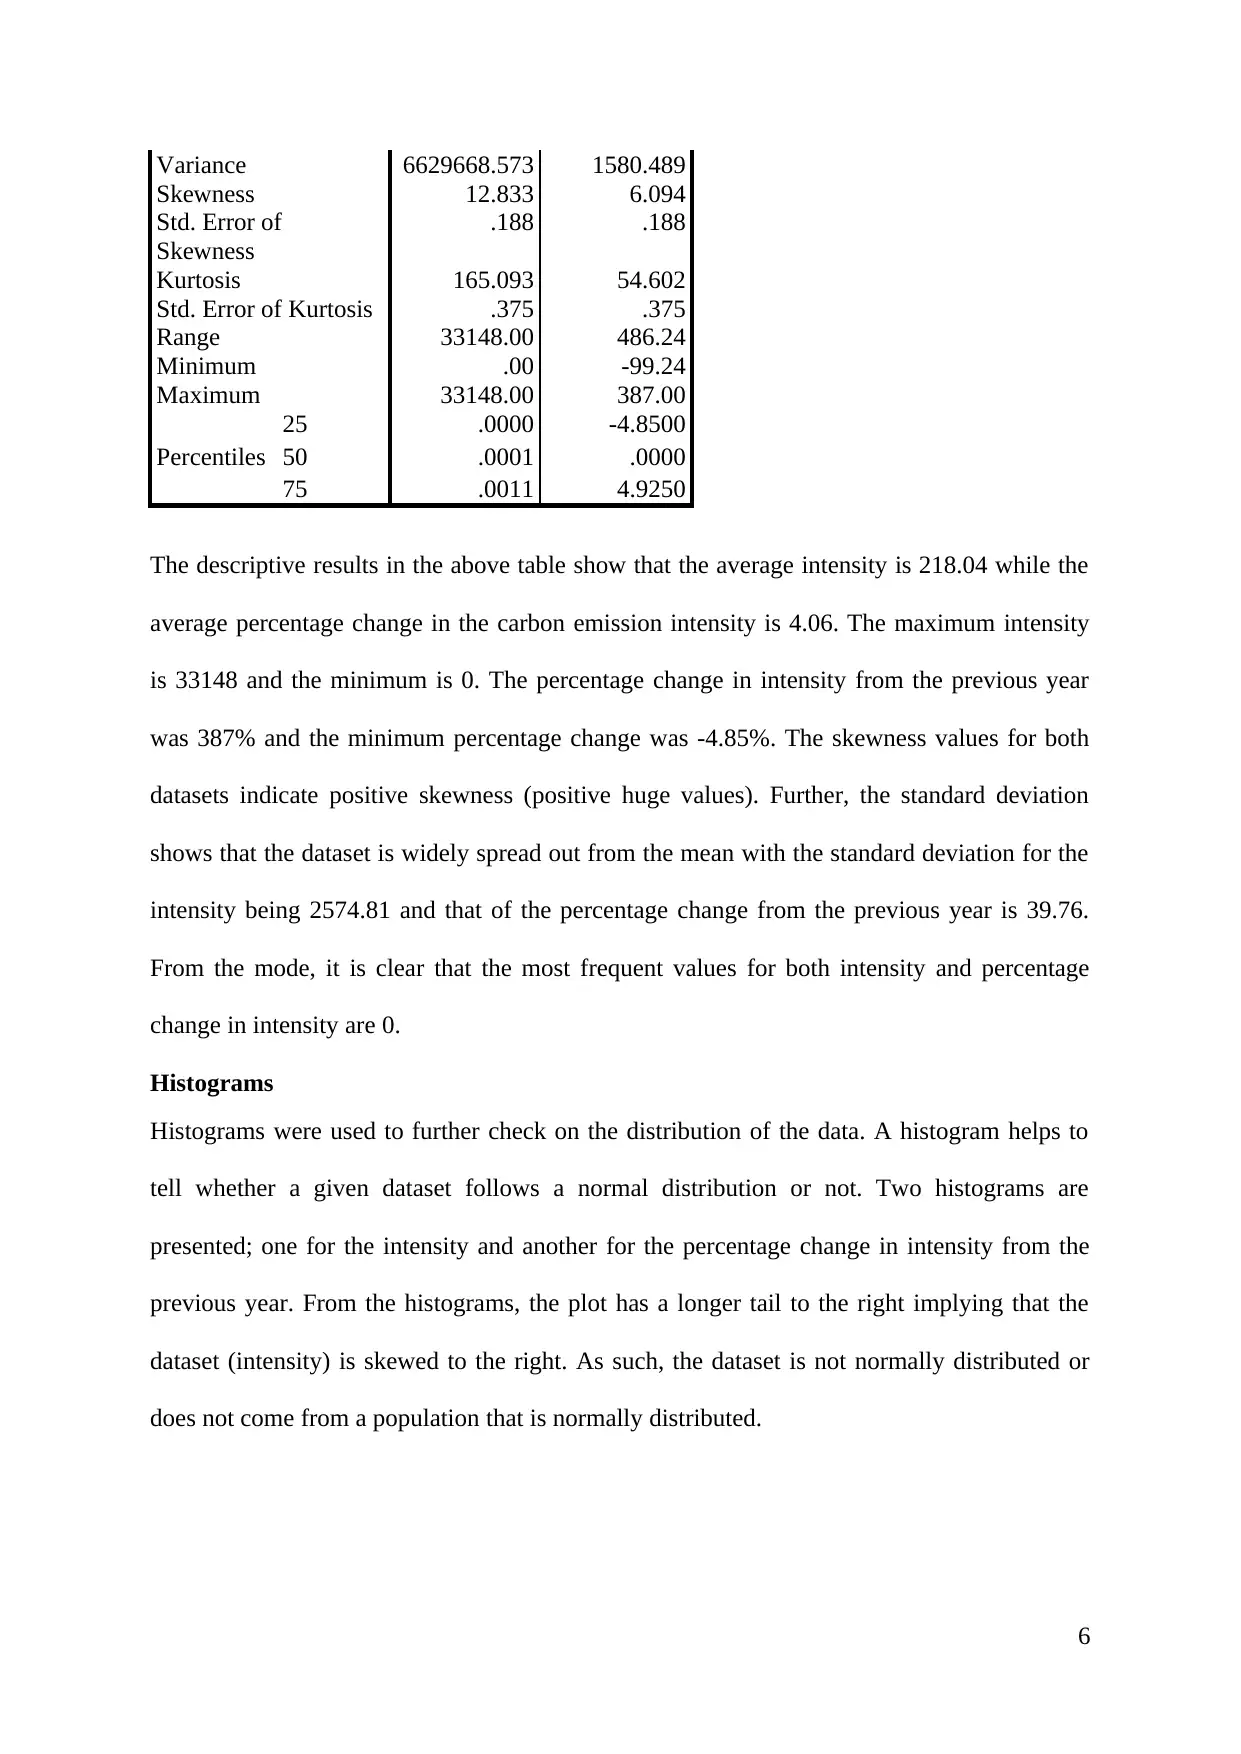
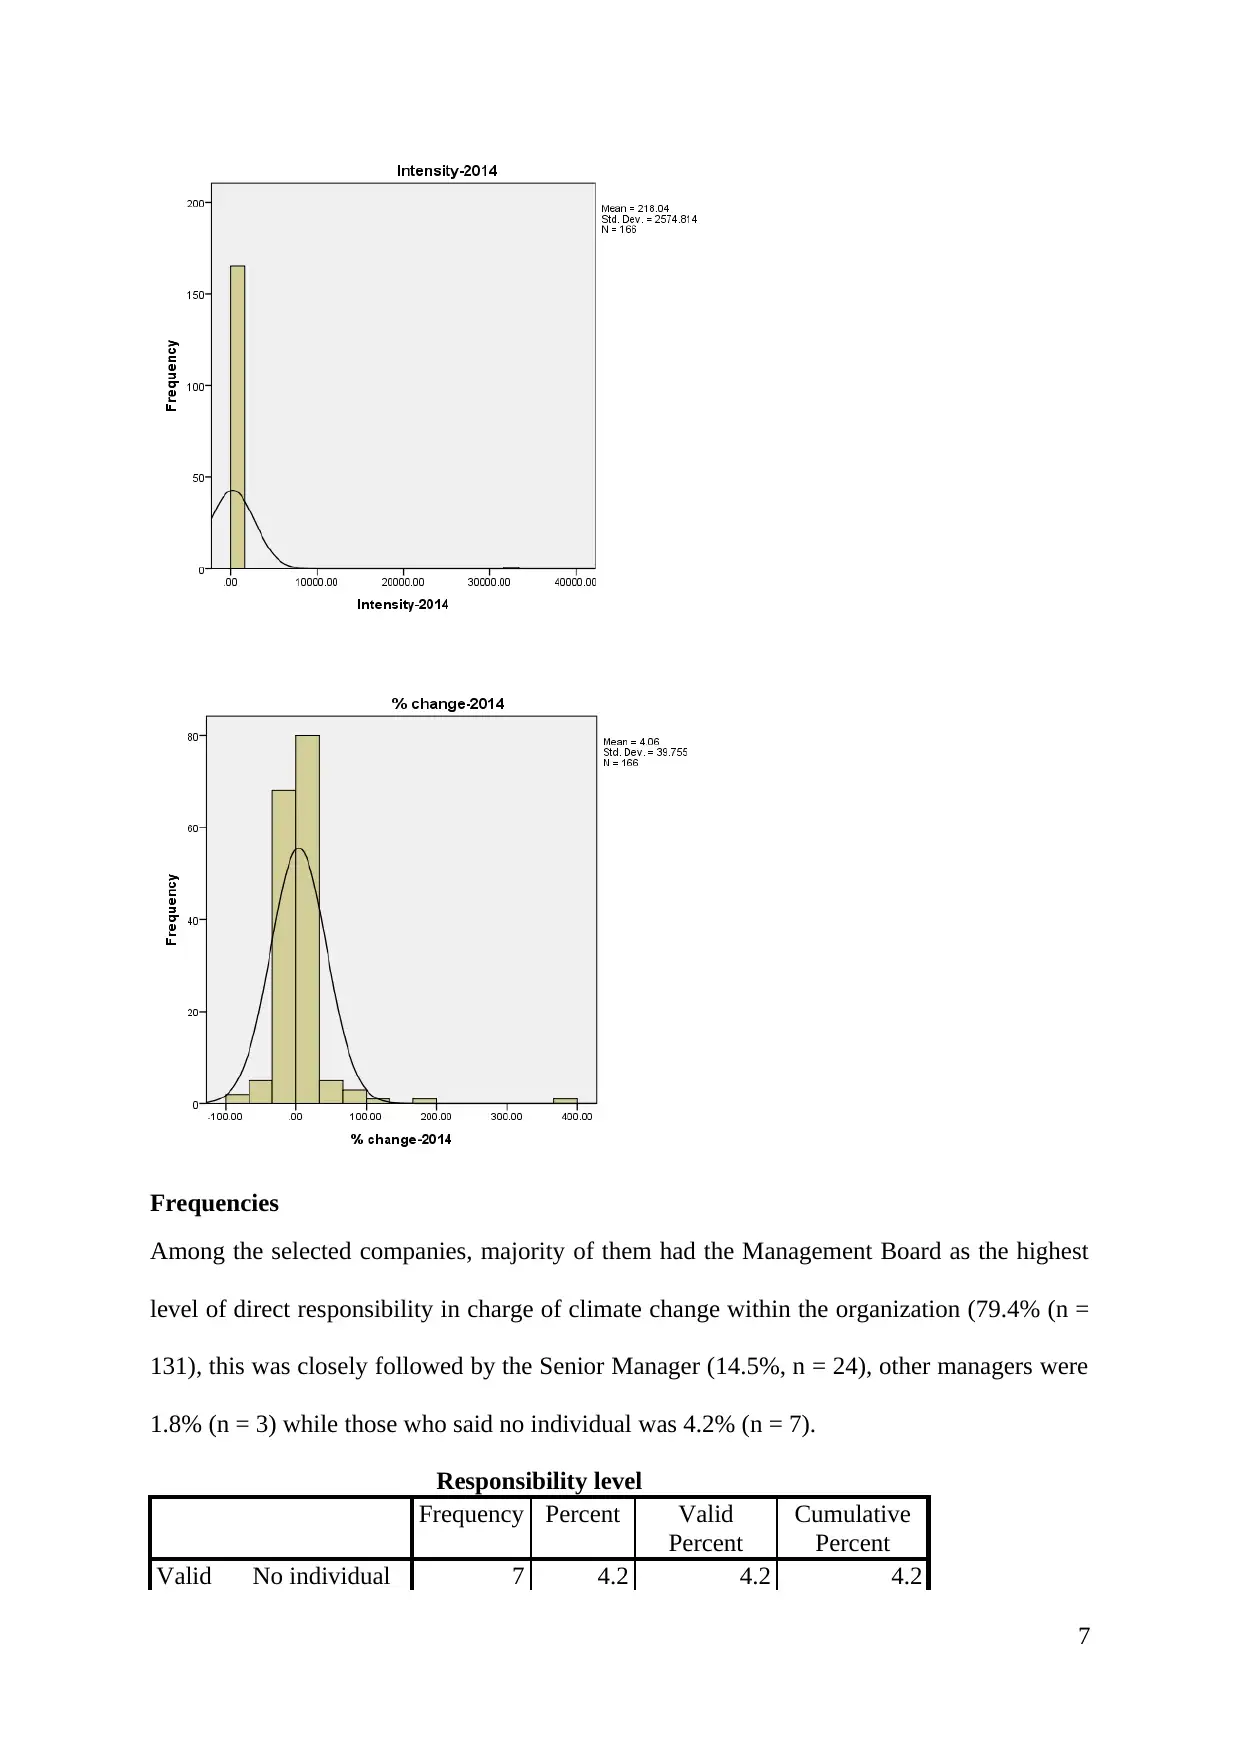
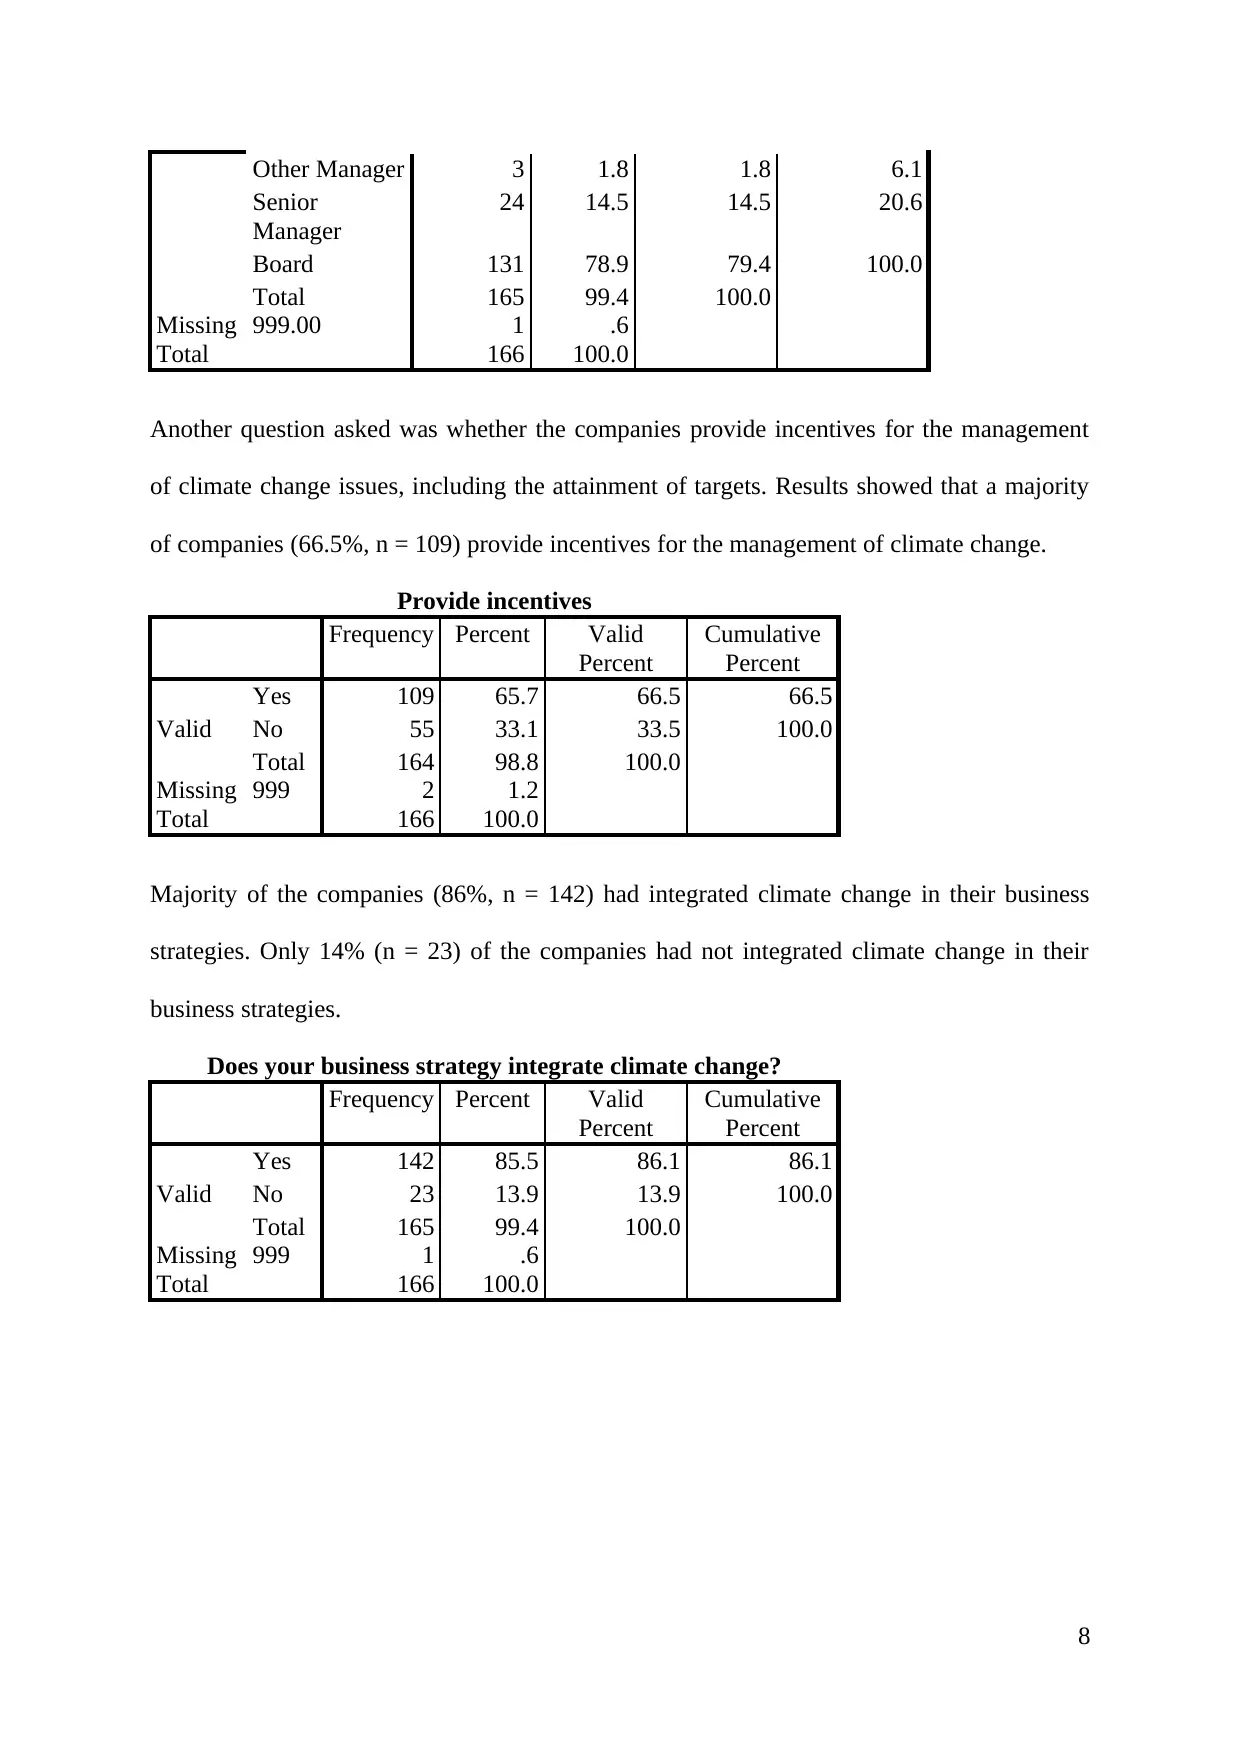
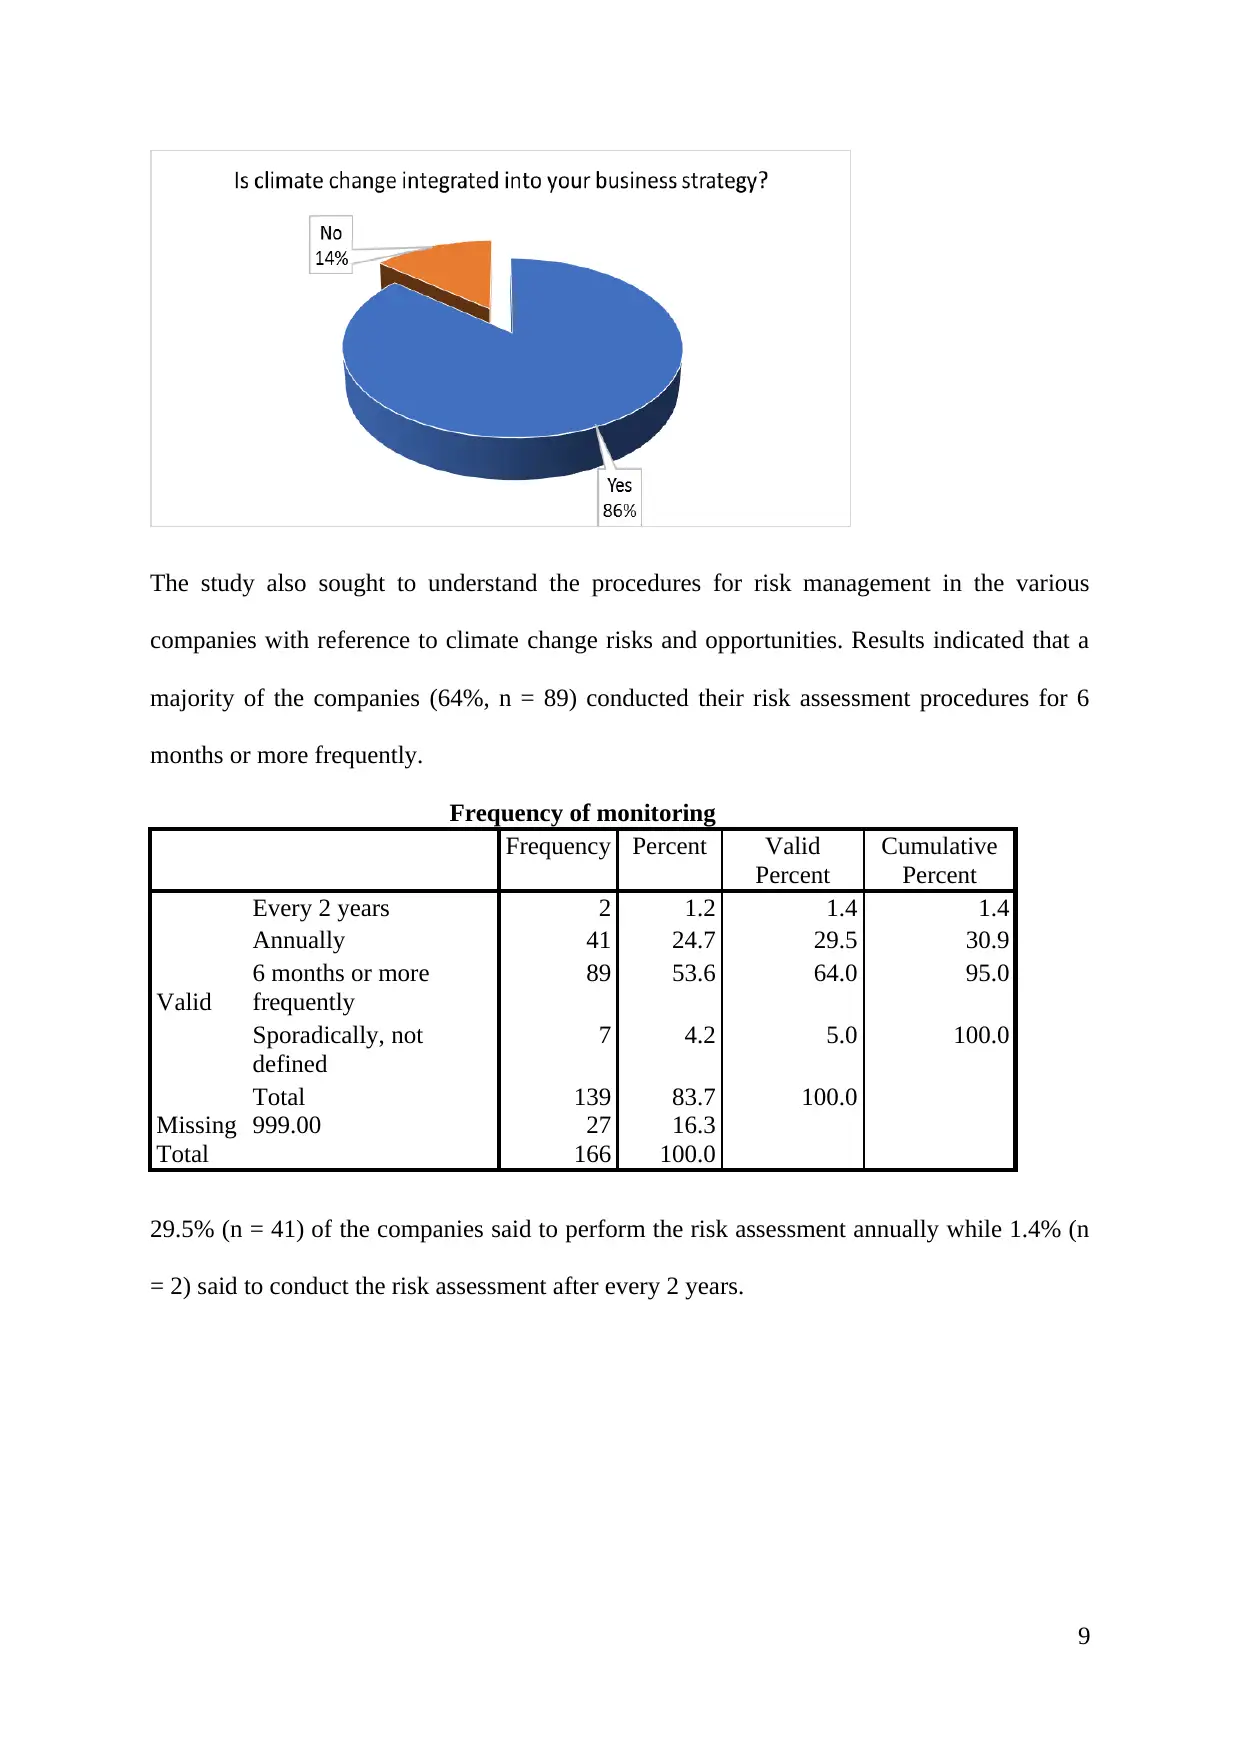
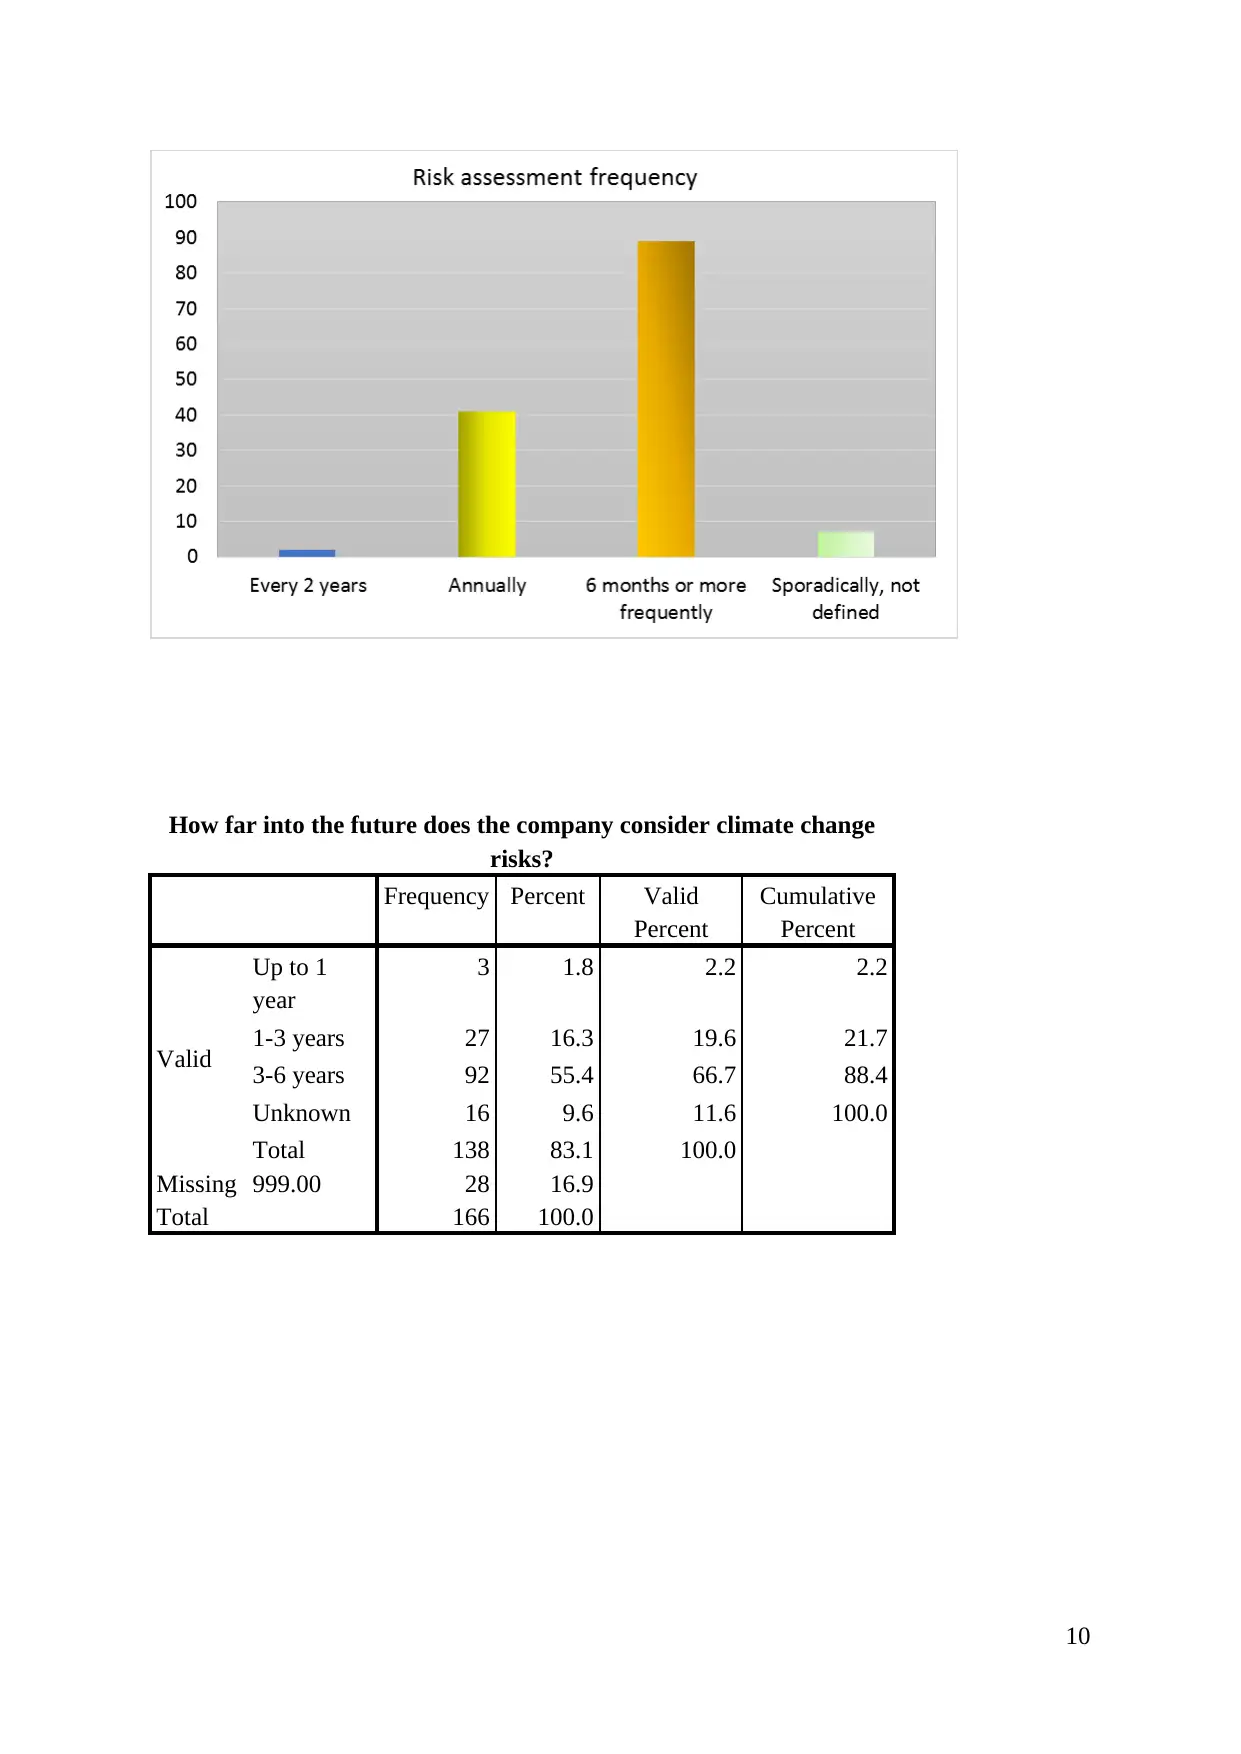
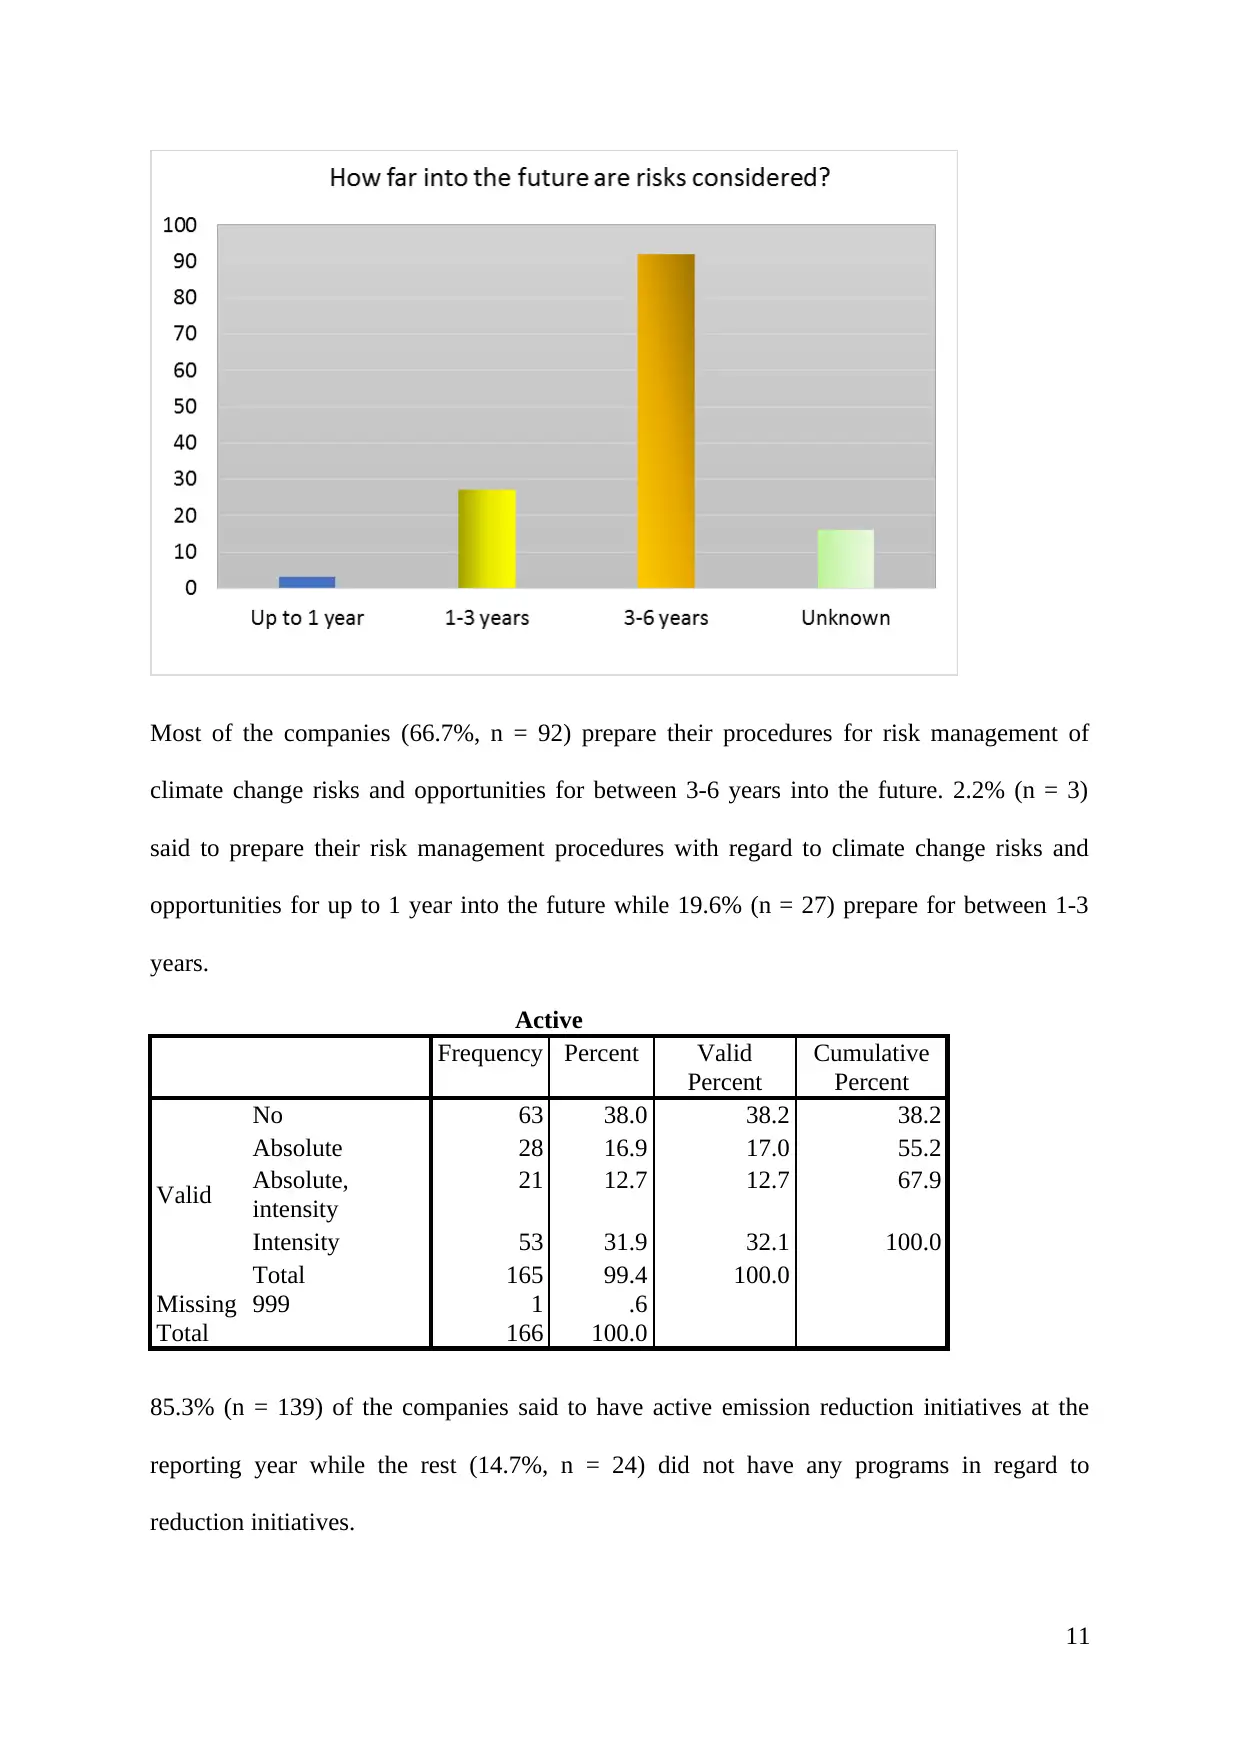
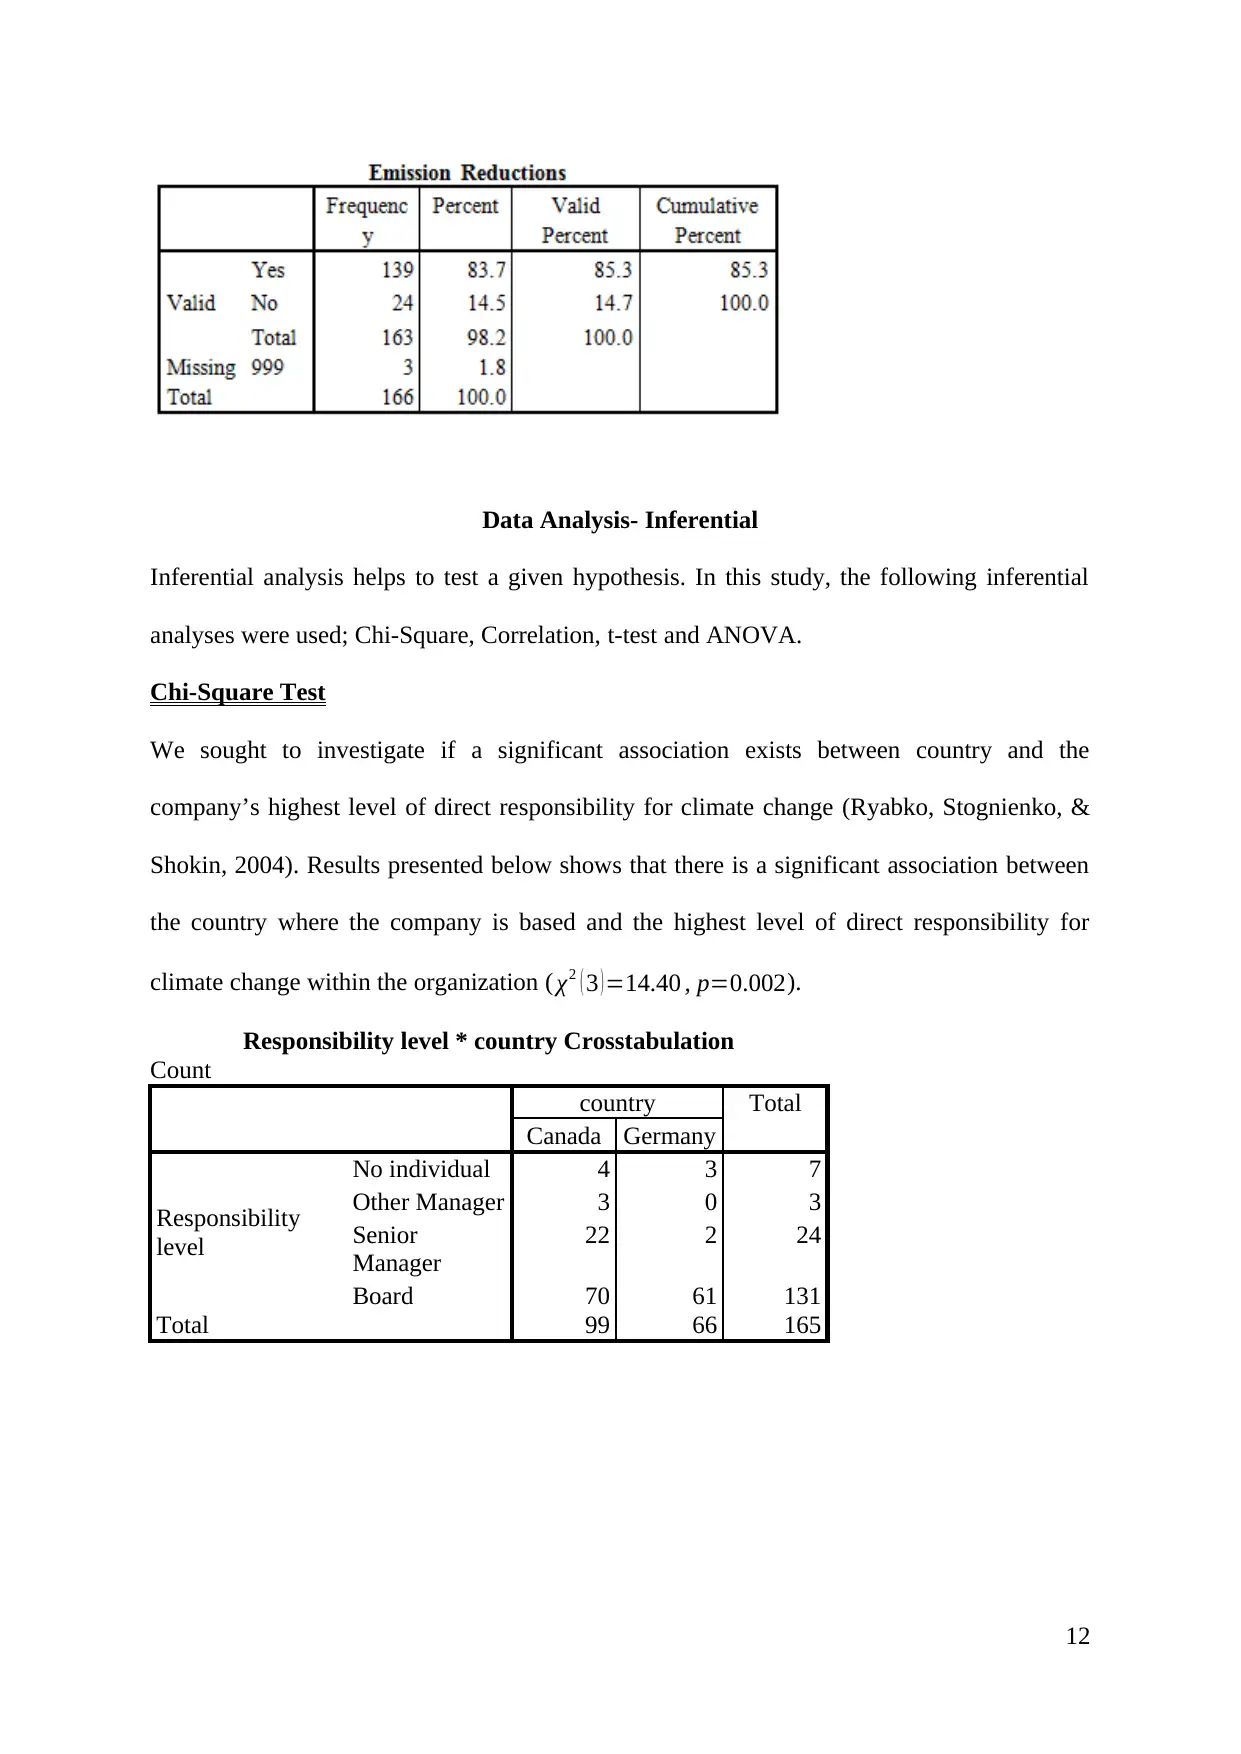
This research project investigates and compares carbon emission intensity between Canada and Germany, examining the association between carbon emission intensity, country, and a company's direct responsibility for climate change. Data was collected from 166 firms in both countries and analyzed using SPSS. The report presents descriptive statistics showing average intensity and percentage changes in carbon emissions, along with inferential analyses including Chi-Square tests revealing a significant association between country and the level of responsibility for climate change. Correlation tests showed no significant relationship between intensity and percentage change. A t-test indicated no significant difference in average emissions intensity between Canadian and German companies. The study also explores the prevalence of emission reduction initiatives and risk management procedures related to climate change within the sampled companies, while also acknowledging the limitations and suggesting directions for further research.

Stakeholder Theory in Canada and Germany Companies
Name
Course
Instructor
Date
1
Name
Course
Instructor
Date
1
Secure Best Marks with AI Grader
Need help grading? Try our AI Grader for instant feedback on your assignments.

Table of Contents
Introduction................................................................................................................................3
Literature Review.......................................................................................................................3
Conceptual Model......................................................................................................................4
Hypotheses.................................................................................................................................5
Data collection...........................................................................................................................5
Data Analysis- Descriptive........................................................................................................5
Data Analysis- Inferential........................................................................................................12
Hypothesis Testing...................................................................................................................16
Discussion................................................................................................................................18
Limitations...............................................................................................................................20
Further Research......................................................................................................................21
2

Introduction
Carbon emission continues to be a subject of global discussion attracting both governments
and businesses. Carbon emission results in great amounts of pollution that disrupt the climatic
conditions of the earth making it difficult for people to live comfortably. Human activities
such as deforestation, burning fossil fuels, farming practices, refrigeration and manufacturing
process produce substances greenhouses gases that deplete the ozone-layer (Chunbo & Stern,
2008).
It is important that governments and organization work together to deliberately reduce the
intensity of carbon emission in their respective countries to decrease the depletion of the
ozone-layer which cause the effects of global warming (Smith, 2009). Therefore, this
research project aims to identify and compare the intensity of carbon emission for two
countries: Canada and Germany. The project also sought to investigate if significant
difference exists between the average intensity emissions for companies that offer incentives
towards the management of emissions and those that do not.
Literature Review
The theme of environmental change is presently attracting enthusiastic conversations among
organization financial specialists, policymakers, and scholastics. The discussions revolve
around the issue of ozone-layer depletion caused by emission of carbon gases from the
burning of non-renewable fossil fuels and its adverse environmental effects on the earth. The
conversations have to the establishment of initiatives by public and private entities the world
over to try and minimise the intensity of carbon emission (Bonner, Hastie, & Sprinkle, 2000).
At the same time, partnerships between companies and their employees are giving the much
needed motivation to their staff to drive the agenda of reducing the intensity of carbon
emission from company activities (Bansal & Roth, 2000).
3

Research indicates that companies are using different motivation techniques including
monetary and nonmonetary incentives to reduce the intensity if carbon emission from their
activities. Hypotheses have focused on the impact of monetary motivation on individual
performance, contending that fiscal motivations are utilized to adjust the key goals along with
those of the agents. The ideal agreement is to share the responsibility of reducing carbon
emission between the company and its representatives through motivational incentives.
Accordingly, it is reported that monetary incentives and money related motivations diminish
the challenges associated with the collaborations between companies and their employees in
working towards reduce carbon emission (Aguilera, Rupp, Williams, & Ganapathi, 2007).
Some of these challenges include reduced productivity. However, there is need to establish
the relationship between the carbon emission intensity, the highest level of direct
responsibility for climate change in the company, and the country.
Conceptual Model
The conceptual model shown below is developed from the following research question: is
there a significant association between carbon emission intensity, country and the company’s
highest level of direct responsibility for climate change?
Figure 1: Conceptual framework
4
Secure Best Marks with AI Grader
Need help grading? Try our AI Grader for instant feedback on your assignments.

Hypotheses
The following hypotheses were tested for this research project;
H1: There is significant association between country and the company’s highest level
of direct responsibility for climate change.
H0: There’s no significant correlation between intensity and percentage change in
intensity for the various countries.
H0: There is no significant difference in intensity for the two countries (Canada and
Germany).
Data collection
Data for this research project was collected from Canada and Germany firms. Random
selection was used to select a sample size of 166 firms from Canada and Germany. Data was
cleaned and processes in the Statistical Package for Social Sciences (SPSS). Only useful
variables were included in the dataset, the non-useful variables were deleted from the dataset.
Missing data were coded as -999 and 999. A separate data file (excel file) is provided
together with this report.
Data Analysis- Descriptive
The following tables are SPSS output for the descriptive statistics representing the
distribution of the dataset. The analysis considered the numerical (scale) variables which in
this case are the Carbon emissions (intensity) and percentage change in carbon emissions for
the year 2014.
Statistics
Carbon
emissions
(Intensity)
Percentage
change in
carbon
N Valid 166 166
Missing 0 0
Mean 218.0407 4.0558
Median .0001 .0000
Mode .00 .00
Std. Deviation 2574.81428 39.75537
5

Variance 6629668.573 1580.489
Skewness 12.833 6.094
Std. Error of
Skewness
.188 .188
Kurtosis 165.093 54.602
Std. Error of Kurtosis .375 .375
Range 33148.00 486.24
Minimum .00 -99.24
Maximum 33148.00 387.00
Percentiles
25 .0000 -4.8500
50 .0001 .0000
75 .0011 4.9250
The descriptive results in the above table show that the average intensity is 218.04 while the
average percentage change in the carbon emission intensity is 4.06. The maximum intensity
is 33148 and the minimum is 0. The percentage change in intensity from the previous year
was 387% and the minimum percentage change was -4.85%. The skewness values for both
datasets indicate positive skewness (positive huge values). Further, the standard deviation
shows that the dataset is widely spread out from the mean with the standard deviation for the
intensity being 2574.81 and that of the percentage change from the previous year is 39.76.
From the mode, it is clear that the most frequent values for both intensity and percentage
change in intensity are 0.
Histograms
Histograms were used to further check on the distribution of the data. A histogram helps to
tell whether a given dataset follows a normal distribution or not. Two histograms are
presented; one for the intensity and another for the percentage change in intensity from the
previous year. From the histograms, the plot has a longer tail to the right implying that the
dataset (intensity) is skewed to the right. As such, the dataset is not normally distributed or
does not come from a population that is normally distributed.
6

Frequencies
Among the selected companies, majority of them had the Management Board as the highest
level of direct responsibility in charge of climate change within the organization (79.4% (n =
131), this was closely followed by the Senior Manager (14.5%, n = 24), other managers were
1.8% (n = 3) while those who said no individual was 4.2% (n = 7).
Responsibility level
Frequency Percent Valid
Percent
Cumulative
Percent
Valid No individual 7 4.2 4.2 4.2
7
Paraphrase This Document
Need a fresh take? Get an instant paraphrase of this document with our AI Paraphraser

Other Manager 3 1.8 1.8 6.1
Senior
Manager
24 14.5 14.5 20.6
Board 131 78.9 79.4 100.0
Total 165 99.4 100.0
Missing 999.00 1 .6
Total 166 100.0
Another question asked was whether the companies provide incentives for the management
of climate change issues, including the attainment of targets. Results showed that a majority
of companies (66.5%, n = 109) provide incentives for the management of climate change.
Provide incentives
Frequency Percent Valid
Percent
Cumulative
Percent
Valid
Yes 109 65.7 66.5 66.5
No 55 33.1 33.5 100.0
Total 164 98.8 100.0
Missing 999 2 1.2
Total 166 100.0
Majority of the companies (86%, n = 142) had integrated climate change in their business
strategies. Only 14% (n = 23) of the companies had not integrated climate change in their
business strategies.
Does your business strategy integrate climate change?
Frequency Percent Valid
Percent
Cumulative
Percent
Valid
Yes 142 85.5 86.1 86.1
No 23 13.9 13.9 100.0
Total 165 99.4 100.0
Missing 999 1 .6
Total 166 100.0
8

The study also sought to understand the procedures for risk management in the various
companies with reference to climate change risks and opportunities. Results indicated that a
majority of the companies (64%, n = 89) conducted their risk assessment procedures for 6
months or more frequently.
Frequency of monitoring
Frequency Percent Valid
Percent
Cumulative
Percent
Valid
Every 2 years 2 1.2 1.4 1.4
Annually 41 24.7 29.5 30.9
6 months or more
frequently
89 53.6 64.0 95.0
Sporadically, not
defined
7 4.2 5.0 100.0
Total 139 83.7 100.0
Missing 999.00 27 16.3
Total 166 100.0
29.5% (n = 41) of the companies said to perform the risk assessment annually while 1.4% (n
= 2) said to conduct the risk assessment after every 2 years.
9

How far into the future does the company consider climate change
risks?
Frequency Percent Valid
Percent
Cumulative
Percent
Valid
Up to 1
year
3 1.8 2.2 2.2
1-3 years 27 16.3 19.6 21.7
3-6 years 92 55.4 66.7 88.4
Unknown 16 9.6 11.6 100.0
Total 138 83.1 100.0
Missing 999.00 28 16.9
Total 166 100.0
10
risks?
Frequency Percent Valid
Percent
Cumulative
Percent
Valid
Up to 1
year
3 1.8 2.2 2.2
1-3 years 27 16.3 19.6 21.7
3-6 years 92 55.4 66.7 88.4
Unknown 16 9.6 11.6 100.0
Total 138 83.1 100.0
Missing 999.00 28 16.9
Total 166 100.0
10
Secure Best Marks with AI Grader
Need help grading? Try our AI Grader for instant feedback on your assignments.

Most of the companies (66.7%, n = 92) prepare their procedures for risk management of
climate change risks and opportunities for between 3-6 years into the future. 2.2% (n = 3)
said to prepare their risk management procedures with regard to climate change risks and
opportunities for up to 1 year into the future while 19.6% (n = 27) prepare for between 1-3
years.
Active
Frequency Percent Valid
Percent
Cumulative
Percent
Valid
No 63 38.0 38.2 38.2
Absolute 28 16.9 17.0 55.2
Absolute,
intensity
21 12.7 12.7 67.9
Intensity 53 31.9 32.1 100.0
Total 165 99.4 100.0
Missing 999 1 .6
Total 166 100.0
85.3% (n = 139) of the companies said to have active emission reduction initiatives at the
reporting year while the rest (14.7%, n = 24) did not have any programs in regard to
reduction initiatives.
11

Data Analysis- Inferential
Inferential analysis helps to test a given hypothesis. In this study, the following inferential
analyses were used; Chi-Square, Correlation, t-test and ANOVA.
Chi-Square Test
We sought to investigate if a significant association exists between country and the
company’s highest level of direct responsibility for climate change (Ryabko, Stognienko, &
Shokin, 2004). Results presented below shows that there is a significant association between
the country where the company is based and the highest level of direct responsibility for
climate change within the organization ( χ2 ( 3 )=14.40 , p=0.002).
Responsibility level * country Crosstabulation
Count
country Total
Canada Germany
Responsibility
level
No individual 4 3 7
Other Manager 3 0 3
Senior
Manager
22 2 24
Board 70 61 131
Total 99 66 165
12

Next, we looked at whether there is a significant association between companies having
initiatives for the reduction of carbon emissions that were active within the reporting year and
how far into the future climate change risks are considered (Cohen, Cohen, West, & Aiken,
2002). As can be seen, results showed that there is no significant association between the two
variables.
How far into the future does the company consider climate
change risks? * Emission reductions Crosstabulation
Count
Emission
Reductions
Total
Yes No
How far into the future
does the company
consider climate change
risks?
Up to 1
year
3 0 3
1-3 years 25 2 27
3-6 years 86 6 92
Unknown 11 4 15
Total 125 12 137
Correlation test
13
Paraphrase This Document
Need a fresh take? Get an instant paraphrase of this document with our AI Paraphraser

We performed a correlation test to determine the relationship that exists between intensity
and percentage change in intensity for the various countries (Székely & Bakirov, 2007). The
results are given below;
Correlations
Intensity-
2014
% change-
2014
Intensity-2014
Pearson
Correlation
1 -.016
Sig. (2-tailed) .841
N 166 166
% change-
2014
Pearson
Correlation
-.016 1
Sig. (2-tailed) .841
N 166 166
As can be seen, there is no significant correlation between the two variables at 5% level of
significance (r = -0.016, p = 0.841)
T-test
For this, we sought to find out whether there is a significant difference in intensity for the two
countries (Canada and Germany). The following hypothesis was to be tested;
H0 : μC=μG
H A : μC ≠ μG
Tested at 5% level.
The results are given below;
Group Statistics
Country N Mean Std.
Deviation
Std. Error
Mean
Intensity-2014 Canada 65 29.5208 178.19590 22.10248
Germany 44 756.7597 4996.77559 753.29226
14

An independent samples t-test was performed to compare the average emissions intensity for
the companies in Canada and those in Germany. Results showed that the average emissions
by the companies in Canada (M = 29.52, SD = 22.10, N = 65) was not significant different
with the average emissions by the companies in Germany (M = 756.76, SD = 4996.76, N =
44), t (107) = -1.175, p > .05, two-tailed. The difference of 727.24 showed an insignificant
difference. Essentially results showed that intensity emissions by companies in Canada and in
Germany do not significantly differ.
A second t-test was performed to test the difference in the intensity for the companies that
offered incentives and those that did not. The hypothesis tested is as follows;
H0 : μY =μN
H A : μY ≠ μN
Tested at 5% level.
The results are given below;
15

An independent samples t-test was performed to compare the average emissions for the
companies that offered incentives and those that did not offer incentives (Nikolić, Muresan,
Feng, & Singer, 2012). Results showed that the average emissions by the companies that
offered incentives (M = 5.03, SD = 45.54, N = 109) was not significantly different with the
average emissions by the companies that did not offer incentives (M = 2.27, SD = 26.01, N =
55), t (162) = 1.046, p > .05, two-tailed. The 2.77 difference revealed an insignificant
difference. Basically, results indicated that offering incentives for climate change
management, including target achievement did not significantly reduce the amount of
emissions at 5% level of significance.
Hypothesis Testing
The project was conducted to identify and compare the carbon emission for two countries,
namely: Canada and Germany. The study also sought to determine if a significant difference
exists between the average intensity emissions for companies that offer incentives towards
the management of emissions and those that do not. Therefore, the research was guided by
the following three hypotheses:
1. That there is a significant association between country and the organization’s highest
level of direct responsibility for climate change.
2. That there is no significant correlation between intensity and percentage change in
intensity for the various countries.
16
Secure Best Marks with AI Grader
Need help grading? Try our AI Grader for instant feedback on your assignments.

3. That there is no significant difference in intensity for the two countries (Canada and
Germany).
Data was collected and analyzed to test whether there is a significant association between the
independent variables. The results revealed a significant relationship between the country
where the company is based and the organization’s highest level of direct responsibility for
climate change ( χ2 ( 3 )=14.40 , p=0.002). Therefore, the study accepts the alternative non-
directional hypothesis.
However, the study found that there is no significant association between companies having
initiatives for the reduction of carbon emission that were ongoing during the reporting year
and how far considerations for future risk are projected. As such the study rejects the
alternative directional hypothesis.
On the other hand, the correlation test was carried out to evaluate the existing relationship
between intensity and percentage change in intensity for the various countries but there was
no significant correlation between the two variables at 5% level of significance (r = -0.016, p
= 0.841). Therefore, the researcher accepts the null hypothesis.
Further, t-tests on group and independent samples were conducted to test the third hypothesis.
A mean difference of 727.24 was reported showing no significant difference in the average
emissions intensity for the companies in Canada and those in Germany. Therefore, the study
accepted the null hypothesis, H0, and rejects the alternative non-directional hypothesis, H0. A
second t-test was performed to test the difference in the intensity for the companies that
offered incentives and those that did not. The hypothesis tested is as follows;
H0 : μY =μN
H A : μY ≠ μN
Results showed that the offering of incentives for climate change management, as well as the
achievement of targets did not significantly reduce the amount of emissions at 5% level of
17

significance. As such, the study rejects HA, the alternative hypothesis and accepts H0, the null
hypothesis.
Discussion
The CDP is an initiative that focuses on climate change and its effects on the planet. CDP
typically invites organizations to disclose their initiatives towards reducing carbon emissions
from their daily activities and the intensity of carbon emission. This report focused on the
companies in Canada and Germany that gave their carbon mitigation strategies and emission
intensity data in CDP 2014 to make a central argument that the responsibility of the board of
management for climate change in a company and the country where the company operates
are key correlates to the decision of the company to voluntarily disclose their carbon emission
incentives and the intensity of the emissions. The empirical analysis of this report
characterizes the board of directors in Canada and Germany who choose to disclose their
company’s climate change information and carbon emission.
Drawing on the provision of carbon disclosure literature, this report identifies what motivates
corporations to take action against carbon emission and their decision to publicly shared
company information on climate change. It justifies the effectiveness of climate change
incentives whether monetary or non-monetary as being effective in drivers for voluntary
climate action. This report is theoretically anchored on a rational theory that deliberate
disclosure of carbon information is not only costly but beneficial to companies for there being
a supportive management board and climate change incentives integrated into production
operations. From the dataset used, it is clear that a disparity exists in multinational companies
decision to disclose climate information at varying levels due to variation in the highest level
of management that is responsible for climate change and the dynamics in the country of
operation.
18

Previous studies have illustrated that minimizing carbon emission and improving
environmental performance are vital to countries and companies alike. Therefore, countries
are putting up incentives to motivate companies towards reducing the average carbon
emission from their activities. One such incentive is the deliberate or compulsory detailing of
organizations' ozone depleting substance discharges (Smith, 2009). However, this report
finds no study that has compared the carbon emission for two countries: Canada and
Germany. To disentangle these finding, we sought to evaluate the significant difference in the
average intensity emissions for companies that offer incentives towards the management of
emissions and those that do not. Therefore, this report employed a quantitative analysis
technique with a two-stage approach that dealt with the descriptive statistics and the
inferential statistics that showed how different parameters variables affect the intensity of
carbon emission. As demonstrated by the quantitative analysis in this report, the underlying
factors in the disclosure of the intensity of carbon emission could be different. Importantly,
effort and participation in the disclosure of climate information such as in the CDP is
necessary in companies understanding the actual activities that could reduce the intensity of
carbon footprints.
From the quantitative analysis, the results of this research indicate that contrary to popular
understanding of the significance of company incentives in minimizing carbon emission,
reporting information on carbon emission is not associated with consideration of future risks.
However, the utilization of reporting incentives is associated with less greenhouses gas
emission. These findings are true where the country variable is held constant. Further, the
study finds similar results when we compare the countries and the highest level of direct
responsibility for climate change. Basically, the study gets support for its findings, though,
directionally consistent but not significant for intensity of carbon emission – when the
19
Paraphrase This Document
Need a fresh take? Get an instant paraphrase of this document with our AI Paraphraser

researcher controls for potential bias by performing independent sample t-test to compare the
average emission intensity for companies in Canada and those in Germany.
The results of the research suggest that within certain conditions, that is, when companies see
their actions as social responsibilities, adopting reporting incentives can become more
efficient in minimizing the intensity of greenhouse gas emission in comparison to non-
reporting incentives. Nonetheless, like in any other non-randomized treatment that is not
conducted in the laboratory, it is difficult to determine the exact reason for the observed
differences. Although it is clear that there might be an unknown factor that correlates
positively with offers of incentives, negatively correlates with non-offer of incentives, and
positively correlates with the intensity of carbon emission, such a factor has not been
identified in this study. Alternatively, it can be explained that the companies that offer
incentives to reduce the intensity of carbon emission have higher carbon emission. This
concern is partially addressed in the analysis where a grouped statistics of the countries
suggests that the intensity of carbon emission increases relative to the number of companies
that do not offer incentives for carbon emission. Additionally, the two-stage t-test model
whereby a second t-test was performed produced results showing consistency with the initial
analyses regarding the offering of incentives, implying that any potential bias might not have
been significant. As such, another alternative explanation could be that companies with a
higher intensity of carbon emission and that expect their future emission intensities to
increase are the ones that offer incentives.
Limitations
This study recognizes a number of limitations in relation to the research carried out. First, the
sample of the study comprises of large organizations that are predominantly international.
Therefore, it could be that the findings reported herein may not reflect the truth about smaller
companies that are operating in Canada and Germany. Secondly, the research has only
20

examined data for one year (2014). It could well be probable that the analysis of data over a
longer period could yield results that are slightly different if there is a time lag between the
time when the system of offering incentives was introduced and when the actual effect of the
incentive took place. Thirdly, only two countries were compared, and it is therefore difficult
to generalize the findings of this study as representative of the situation in other countries in
the CDP database and to an extent, the world. Finally, data from CDP depends on
information given by the organisations. These organizations may give biased information to
try and drive their personal agenda or to hide facts that they think should not be revealed to
the public.
In addition, this quantitative research does not consider whether there are any external factors
that could influence the outcome of the results. Some of these factors could include the level
of investment in carbon emission reduction and the opportunities in the different companies
or countries. For example, one country may have stronger political incentives and policies for
climate change than the other. At the same time, a private company may set incentives to add
to the government policy in climate change that would influence their business operations
and carbon emission intensity unlike a public corporation that may choose to work with
public guidelines only. This is to suggest that an integrated strategy to climate action can
reduce the risk and increase the opportunities in business operation; some companies may not
have quantifiable emission targets. Nonetheless, all these concerns are significant areas of
research in future studies.
Further Research
After all is said and done, this study issues a significant practical concern for future research.
The practical concern is how companies can best explain how they voluntarily adopt a
program for the reduction of carbon emission and the related offers of incentives. The
argument is economically instrumental to investors as it beacons for incentives that match the
21

adopted program and would be applicable rather than being there just for the sake. Ironically,
though, a company’s offer of incentives may reduce the productivity of an employee except
those whose task directly focuses on managing production efficiency and reducing emission
intensity. To effectively reduce the intensity of carbon emission, the company should explain
its motives as concerning the improvement and support of pro-social behaviours, backed by
the offer of incentives to its employees.
In addition, this research used secondary data to investigate its hypotheses; therefore, future
studies could consider using primary data to test these hypotheses. The primary data should
use both qualitative and quantitative data collection and analysis techniques. Interviews
should be conducted to evaluate perceptions and other relevant information not included in
this research project.
Although outside the scope of this report, questions remain unanswered regarding the link
between the highest level of company management responsible for climate change including
the scope of the information given in voluntary participation and the effectiveness in reducing
the intensity of carbon footprints. For instance, research has pointed out doubts on whether
the disclosure of climate information by companies provide valuable information to
policymakers, investors or other stakeholders; or are companies just exploiting environmental
symbolism (Bowen and Aragon-Correa 2014)? Additionally, CDP does not have evidence
suggesting that the disclosed information is associated with carbon emission intensity
(Mattisoff (2012). As such, an analysis is necessary to address the link between a company
and the industry behavior, and an evaluation of the climate change information and the
intensity margin of those who participate extensively. Ultimately, these companies are
leaders among proactive corporations.
Bibliography
22
Secure Best Marks with AI Grader
Need help grading? Try our AI Grader for instant feedback on your assignments.

Aguilera, R. V., Rupp, D. E., Williams, C. A., & Ganapathi, J. 2007. Putting the S back in
corporate social responsibility: A multilevel theory of social change in organizations.
Academy of Management Review, 32, 836–863.
Bansal, P., & Roth, K. 2000. Why Companies Go Green: A Model of Ecological
Responsiveness. Academy of Management Journal, 43, 717-736.
Bonner, S. E., Hastie, G. B., & Sprinkle, S. M. 2000. A review of the effects of financial
incentives on performance by laboratory tasks: Implications for management accounting.
Journal of Management Accounting Research, 12(1), 19-64.
Bowen, F., and J. Alberto A. 2014. “Greenwashing in Corporate Environmentalism Research
and Practice The Importance of What We Say and Do.” Organization & Environment 27 (2):
107–12. doi:10.1177/1086026614537078.
Chunbo, M., & Stern, D. 2008. Biomass and China's carbon emissions: A missing piece of
carbon decomposition. Energy Policy, 36(7), 2517-2526. doi:10.1016/j.enpol.2008.03.013
Cohen, J., Cohen, P., West, S. G., & Aiken, L. S. 2002. Applied multiple
regression/correlation analysis for the behavioral sciences. Psychology Press, 34-41.
Fridleifsson, I. B., & Bertani, R. 2011. The possible role and contribution of geothermal
energy to the mitigation of climate change. 59-80.
Matisoff, Daniel C. 2012. “Privatizing Climate Change Policy: Is There a Public Benefit?”
Environmental and Resource Economics 53 (3): 409–33. doi:10.1007/s10640-012-9568-0.
Nikolić, D., Muresan, R. C., Feng, W., & Singer, W. 2012. Scaled correlation analysis: a
better way to compute a cross-correlogram. European Journal of Neuroscience, 1–21.
doi:10.1111/j.1460-9568.2011.07987
23

Ryabko, B. Y., Stognienko, V. S., & Shokin, Y. I. 2004. A new test for randomness and its
application to some cryptographic problems. Journal of Statistical Planning and Inference,
123, 365–376. doi:10.1016/s0378-3758(03)00149-6
Smith, D. 2009. US sets the standard. Renewable Energy Focus, 10(4), 26–27.
doi:10.1016/s1755-0084(09)70147-4
Székely, G. J., & Bakirov, N. K. 2007. Measuring and testing independence by correlation of
distances. Annals of Statistics, 35(6), 2769–2794. doi:10.1214/009053607000000505
24
1 out of 24
Related Documents

Your All-in-One AI-Powered Toolkit for Academic Success.
+13062052269
info@desklib.com
Available 24*7 on WhatsApp / Email
Unlock your academic potential
© 2024 | Zucol Services PVT LTD | All rights reserved.