The Carbon Tax Debate: Australia's Approach to Climate Change
VerifiedAdded on 2020/03/01
|16
|4220
|111
Report
AI Summary
This report provides a comprehensive analysis of the carbon tax and emission trading schemes in Australia, examining climate change as a market failure. It begins with an introduction to climate change and the need for policy interventions like carbon taxation and emission trading. The report then explores the concept of carbon tax and emission trading schemes, including the valuation of environmental damages and abatement strategies. It delves into the popularity of carbon taxation, sources of GHG emissions in Australia, and the debate surrounding emission reduction policies. The report also discusses the economic models used to assess the costs and benefits of carbon taxation, and the impact of carbon pricing on firms. It concludes with an overview of the carbon tax's implementation, its subsequent repeal, and its implications for Australia's environmental and economic landscape.
Carbon Tax/ETS debate in Australia
Student Name
Student Name
Paraphrase This Document
Need a fresh take? Get an instant paraphrase of this document with our AI Paraphraser
Carbon Tax Australia
Contents
1. Introduction.........................................................................................................................................1
2. Climate Change as a Market Failure....................................................................................................2
3. What is a Carbon tax and What are Emission Trading Schemes..........................................................3
4. Valuing Damages to the Environment and Abatement.......................................................................6
5. The popularity of carbon taxation.......................................................................................................9
6. Sources of GHG Emissions in Australia................................................................................................9
7. Conclusion.........................................................................................................................................13
Bibliography...............................................................................................................................................14
1
Carbon Tax Australia
1. Introduction
Climate change can be described as a ‘market failure’ since the current measure of measuring
economic growth do not account for the negative externalities to the environment and
consequently, the cost of these externalities to the society. This is simply due to the fact that
policy intervention is required to correct the possible harmful effects of climate change. If
countries had to face the effects of climate change proportional to their emissions, then there
would have been a market driven response to the problem and countries would have acted to
reduce their emissions. Some of these policy interventions include ‘carbon taxation’ and
‘emissions trading’.
The prime reason for the existence of policy levers such as carbon pricing is that they provide an
impetus to technological innovations to reduce the social costs of climate change. Australia has
one of the highest amounts of Green House Emissions in the world. Climate and these policy
interventions drive the market to pay for the social costs or impose checks (caps) on the negative
externalities that result from economic activity. Additionally, they provide structures so that
those responsible for social ‘diseconomies’ or negative externalities would compensate for it.
Australia has a target of a reduction of emissions that are 5% of the 2000 levels. (Department of
Environment and Energy, Commonwealth of Australia , 2016). This reduction is a percentage
and “The expected effect of the tax is to reduce overall domestic emissions below projected
‘business as usual’ levels, rather than reducing the absolute level of emissions.” (Robson, 2014)
Emissions reduction policies in Australia have been subject to much debate in the last decade
since efforts to reduce Green House Gas Emissions are in direct juxtaposition with the economic
growth of the country. The Carbon Tax was implemented in Australia was introduced in July
2011 with details on a ‘Carbon Tax’ and “Emission Trading Scheme” and was effective from
July 2012. (Nash, 2011)
The absence of such policy measures implies that there will be no efforts for adaptation and
mitigation of climate change and emissions would be allowed in a ‘business as usual
scenario’.There would no effort to combat and reduce effects of climate change such as floods,
2
⊘ This is a preview!⊘
Do you want full access?
Subscribe today to unlock all pages.
Trusted by 1+ million students worldwide
Carbon Tax Australia
droughts etc. which could have serious impact on growth and GDP. Thus, the consequences of
this market failure would be borne by the society. These costs could include direct damages
caused changing climatic patterns, increased health care costs due to the effects of global
warming and lack of clean air, the amount of impact on the life and livelihoods of vulnerable
communities such as fishing communities, loss of future growth due to diminishing availability
of natural resources, disruptions caused in the economy due to extreme temperatures etc.
(Thomas, 2017). At the time of its introduction, the carbon pricing system received support from
experts being labeled as good although it did not receive wide support from the public. (Nash,
2011)(Roy Morgan Research, 2011). The Carbon Tax was scrapped in 2014 following much
debate.(Taylor, 2014)
2. Climate Change as a Market Failure
Climate change, as mentioned above is a market failure since the market does not provide
valuation and a pricing mechanism for some critical natural resources like clean air, water etc.
but provides for subsidization of fossil fuels. Additionally, the negative externalities of GHG
emissions are not taken into account by the market.
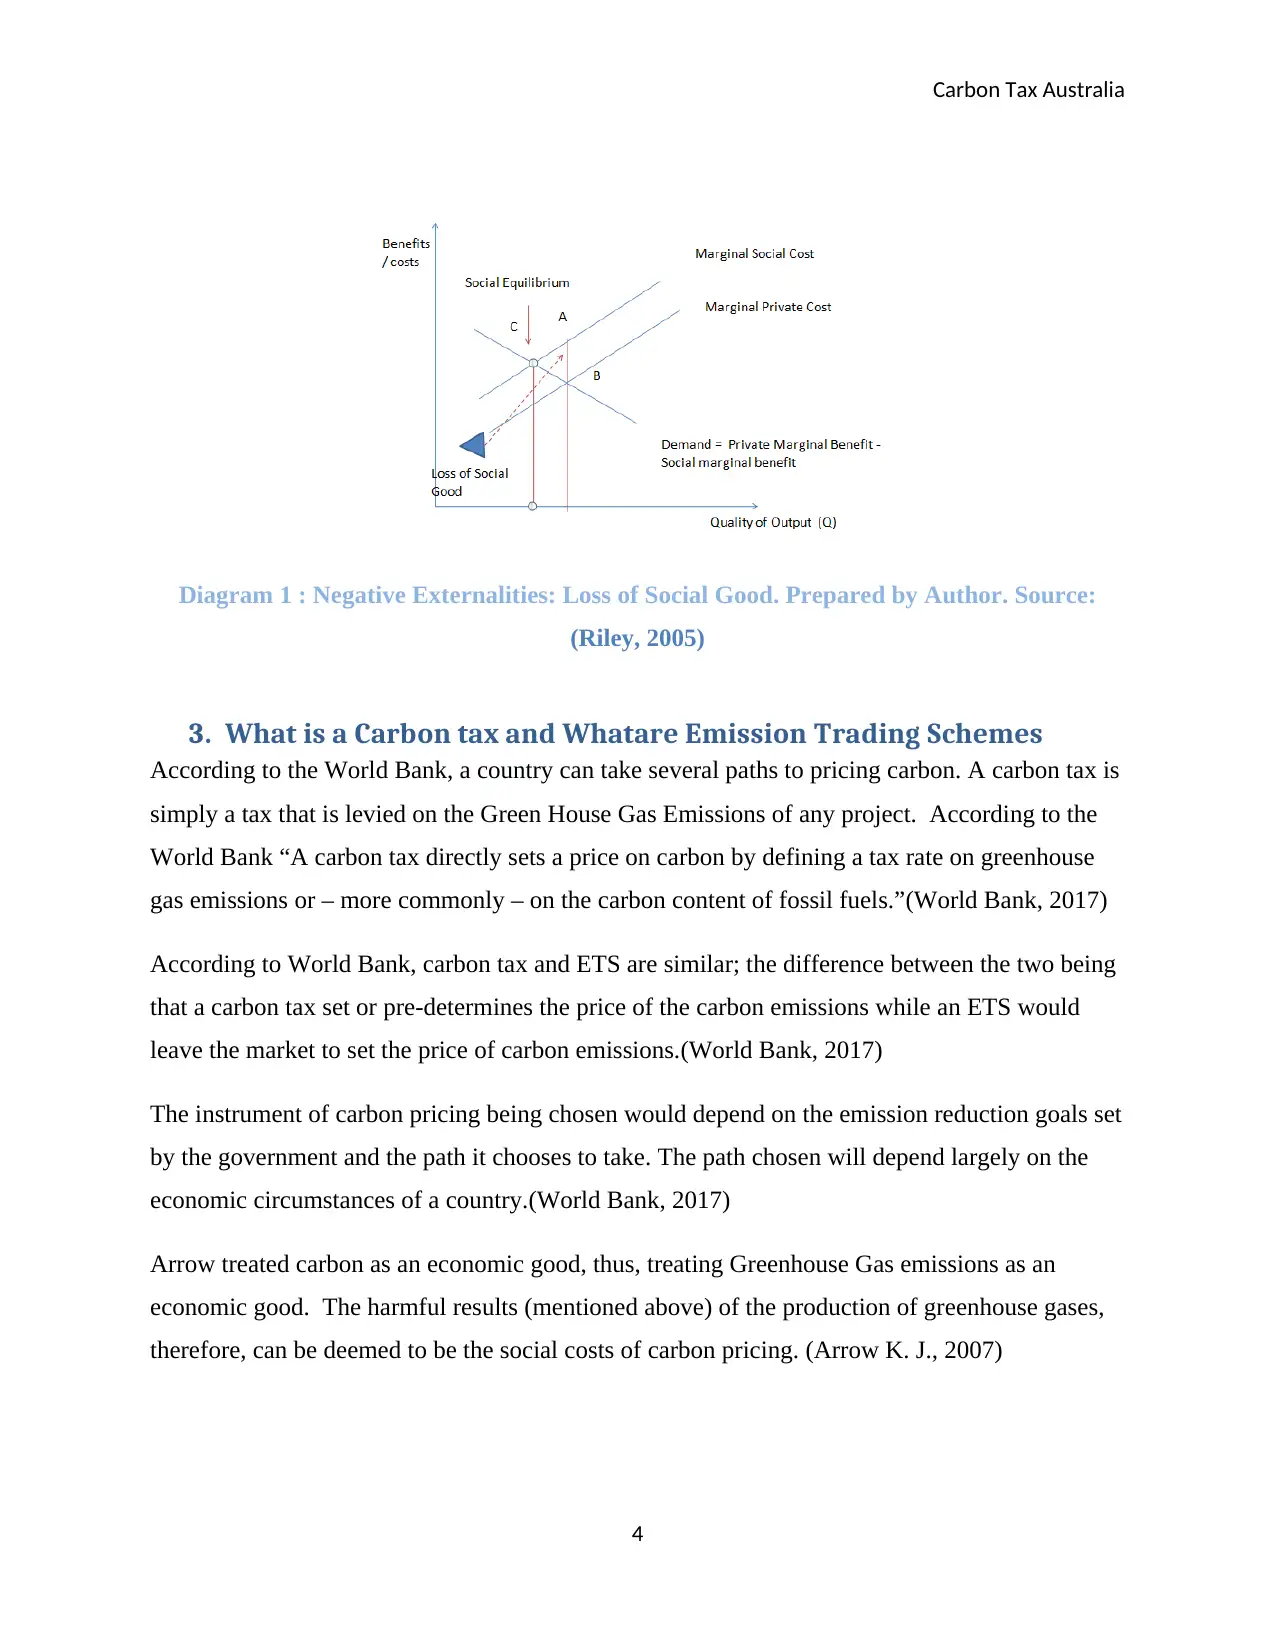
A diseconomy or a ‘negative externality’ mathematically implies the difference between the
‘Marginal Private Cost’ and the ‘Marginal Social Costs’ i.e when the society incurs the cost for a
good that is not paid by the producer of an economic good. MPC refers to the private cost of the
producing the last unit of economic good or service to the last consumer. The ‘Marginal Social
Cost’ is a dollar valuation of the impact that the society must bearfor the production of the last
unit of good or services. Negative externalities imply that the production of a good or servicehas
a malevolent effect on the society or cause inconvenience to the public. (Lipsey & Chrystal,
2011)
3
droughts etc. which could have serious impact on growth and GDP. Thus, the consequences of
this market failure would be borne by the society. These costs could include direct damages
caused changing climatic patterns, increased health care costs due to the effects of global
warming and lack of clean air, the amount of impact on the life and livelihoods of vulnerable
communities such as fishing communities, loss of future growth due to diminishing availability
of natural resources, disruptions caused in the economy due to extreme temperatures etc.
(Thomas, 2017). At the time of its introduction, the carbon pricing system received support from
experts being labeled as good although it did not receive wide support from the public. (Nash,
2011)(Roy Morgan Research, 2011). The Carbon Tax was scrapped in 2014 following much
debate.(Taylor, 2014)
2. Climate Change as a Market Failure
Climate change, as mentioned above is a market failure since the market does not provide
valuation and a pricing mechanism for some critical natural resources like clean air, water etc.
but provides for subsidization of fossil fuels. Additionally, the negative externalities of GHG
emissions are not taken into account by the market.
A diseconomy or a ‘negative externality’ mathematically implies the difference between the
‘Marginal Private Cost’ and the ‘Marginal Social Costs’ i.e when the society incurs the cost for a
good that is not paid by the producer of an economic good. MPC refers to the private cost of the
producing the last unit of economic good or service to the last consumer. The ‘Marginal Social
Cost’ is a dollar valuation of the impact that the society must bearfor the production of the last
unit of good or services. Negative externalities imply that the production of a good or servicehas
a malevolent effect on the society or cause inconvenience to the public. (Lipsey & Chrystal,
2011)
3
Paraphrase This Document
Need a fresh take? Get an instant paraphrase of this document with our AI Paraphraser
Carbon Tax Australia
Diagram 1 : Negative Externalities: Loss of Social Good. Prepared by Author. Source:
(Riley, 2005)
3. What is a Carbon tax and Whatare Emission Trading Schemes
According to the World Bank, a country can take several paths to pricing carbon. A carbon tax is
simply a tax that is levied on the Green House Gas Emissions of any project. According to the
World Bank “A carbon tax directly sets a price on carbon by defining a tax rate on greenhouse
gas emissions or – more commonly – on the carbon content of fossil fuels.”(World Bank, 2017)
According to World Bank, carbon tax and ETS are similar; the difference between the two being
that a carbon tax set or pre-determines the price of the carbon emissions while an ETS would
leave the market to set the price of carbon emissions.(World Bank, 2017)
The instrument of carbon pricing being chosen would depend on the emission reduction goals set
by the government and the path it chooses to take. The path chosen will depend largely on the
economic circumstances of a country.(World Bank, 2017)
Arrow treated carbon as an economic good, thus, treating Greenhouse Gas emissions as an
economic good. The harmful results (mentioned above) of the production of greenhouse gases,
therefore, can be deemed to be the social costs of carbon pricing. (Arrow K. J., 2007)
4
Carbon Tax Australia
On the other hand, the impact on GDP is the social cost of mitigation of climate change and
reduction in greenhouse gases. The benefits of the reduction of GreenHouse Gases are the
benefits that are to be accrued in the future. (Arrow K. J., 2007)
According to Arrow “The benefits of reduced GHG emissions last for centuries, but mitigation
costs are borne today.”(Arrow K. J., 2007) This implies that investment in the benefits of
mitigation of greenhouse gases for the future must be borne and made by present generations.
Economic projects often take into consideration the ‘discount rate’ analysis of investments made
in the present for benefits which would be received in the future. Arrow applied the same
analysis to the costs versus benefits if Green House Gas mitigation. (Arrow K. J., 2007)
(Frederick, 1999).
In Arrow’s analysis, ‘δ’ is the ‘discount rate’ or “the rate at which society (i.e., the social
‘planner’) discounts the utility of future generations i.e. the rate at which the rate at which
society would trade consumption in year t for consumption in the present (measured by Net
Present Value of Consumption.”(Arrow K. J., 2007)
Arrow gave the formula:
δ = p + gη
where:
p = social rate of time preference or how much the society favours present consumption of an
economic good to future benefits.
g = Consumption growth rate or the “projected growth rate of consumption
η = the diminishing marginal rate of social utility or the dollar value of the social benefits of the
last unit of goods consumed.
According to Arrow, the more of consumption (total carbon consumed in a society) that a
generation has, the less social benefit (utility) they may derive from it i.e. the benefits derived go
on decreasing (Arrow, et al., 2011). For example, GHG emissions are a result of producing the
basic goods for a society as well as non-essential goods. Some amount of GHG emissions are
necessary and can be allowed while carbon emissions above a certain quantity can prove to be
5
⊘ This is a preview!⊘
Do you want full access?
Subscribe today to unlock all pages.
Trusted by 1+ million students worldwide
Carbon Tax Australia
disastrous. Our society has to make a trade off between emissions and goods produced in the
society.
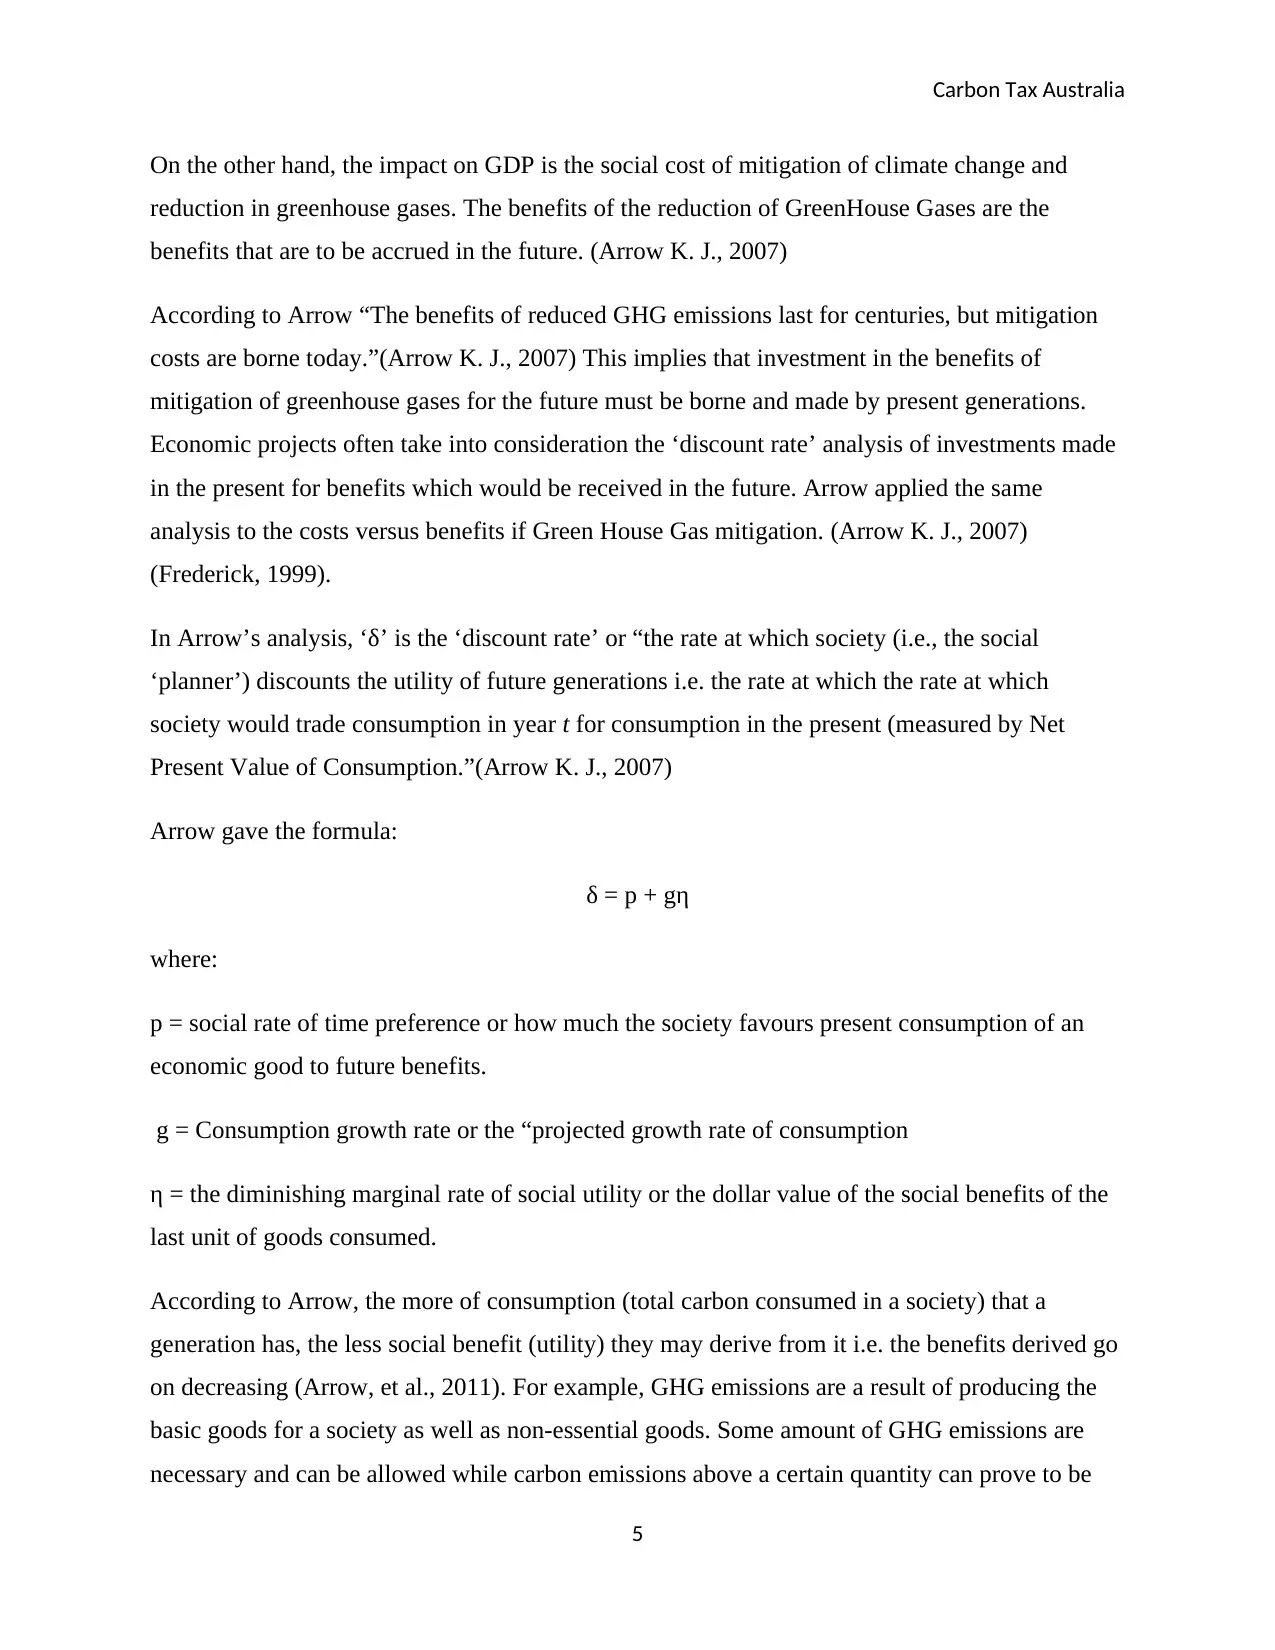
Additionally, the present value of GHG emissions (let us measure this by GDP or economic
growth) may be inversely related to the benefits accrued in the future from emission reductions.
In the diagram below, the total present value against the rate of benefits that may be derived in
the future is traced on the curve. The curve is concave to the origin because this rate of returns
gained from sacrificing consumption (i.e. the rate at which present gains are transformed in
future gains) in present for the future consumption keeps diminishing. In the context of a society,
as consumption rises, its social benefits tend to diminish and the total social value of
consumption tends to have diminishing returns. (Arrow, et al., 2011)
Diagram 2: Net Present Value of GHG Emissions as an Economic Good versus Discount Rate. Source: Prepared by Author.
Adapted from Samuelson & Nordhaus, (2004)
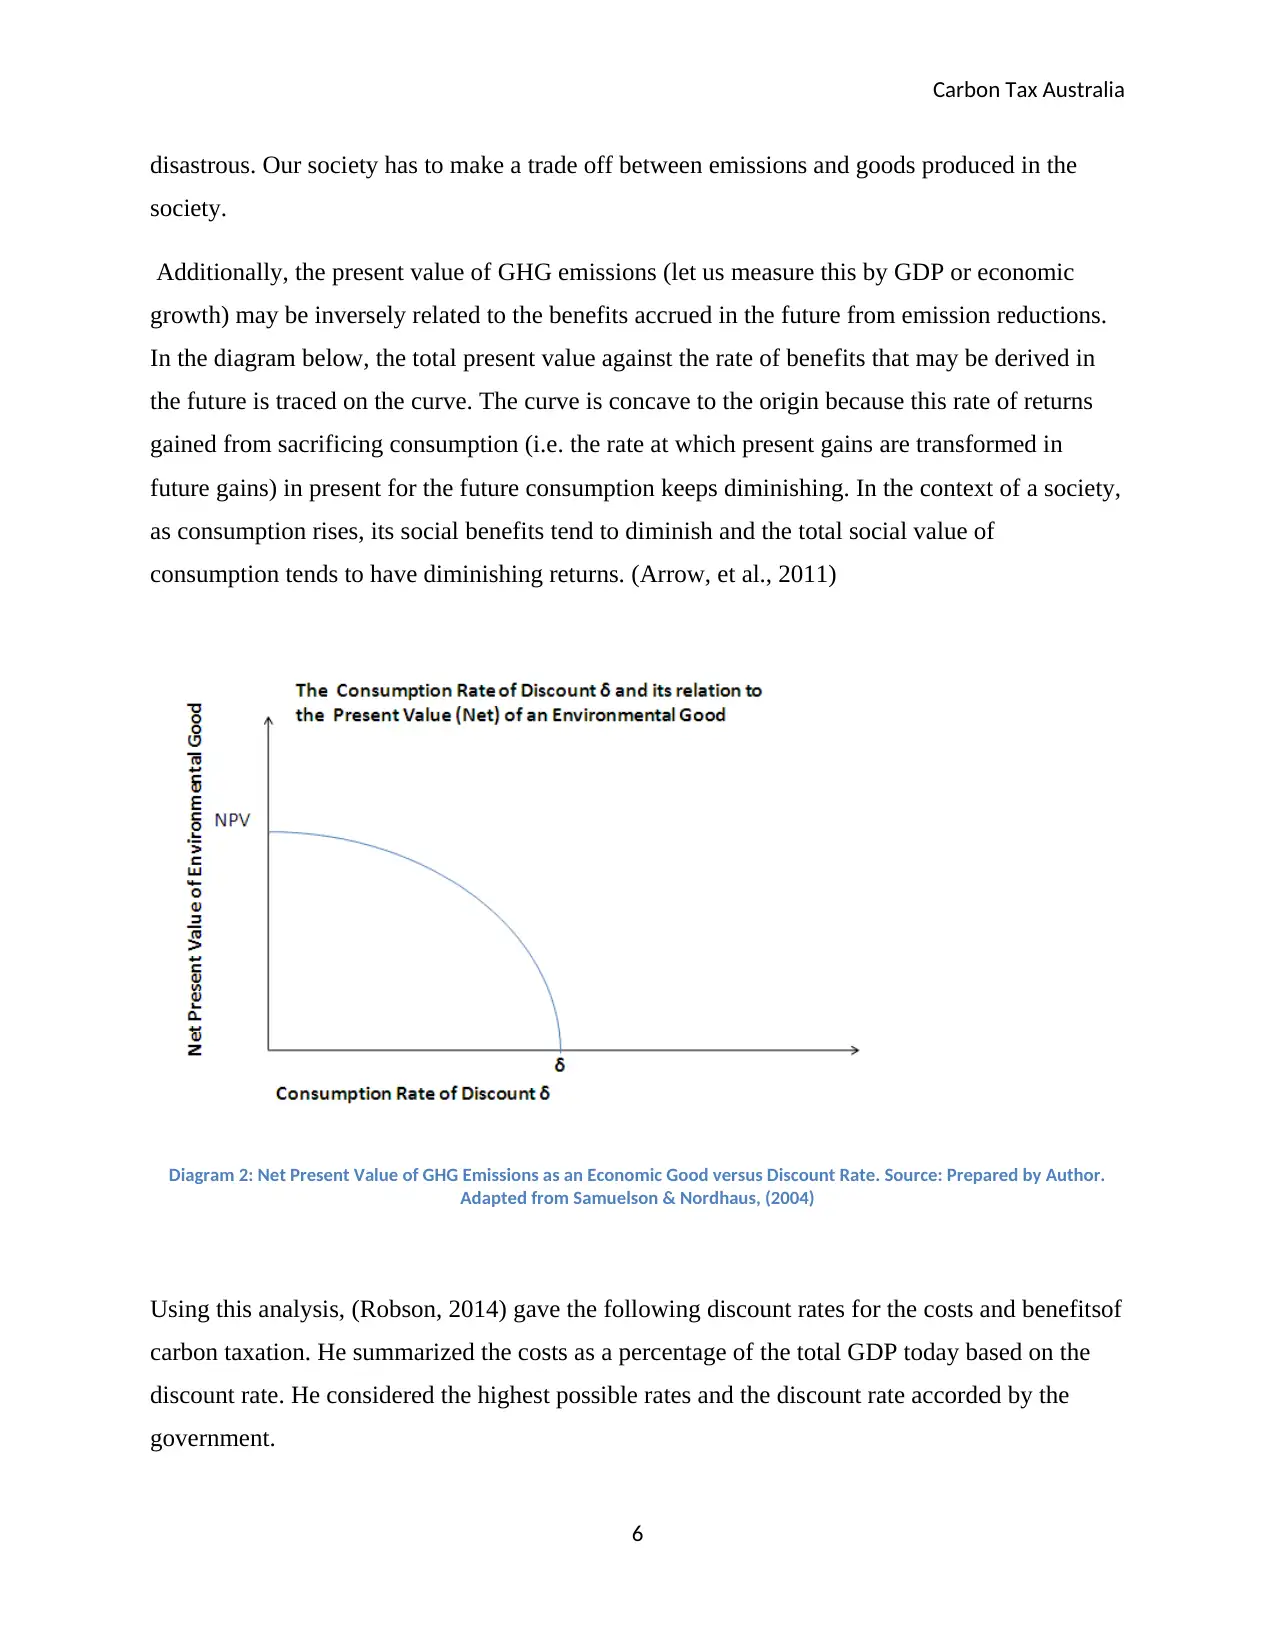
Using this analysis, (Robson, 2014) gave the following discount rates for the costs and benefitsof
carbon taxation. He summarized the costs as a percentage of the total GDP today based on the
discount rate. He considered the highest possible rates and the discount rate accorded by the
government.
6
disastrous. Our society has to make a trade off between emissions and goods produced in the
society.
Additionally, the present value of GHG emissions (let us measure this by GDP or economic
growth) may be inversely related to the benefits accrued in the future from emission reductions.
In the diagram below, the total present value against the rate of benefits that may be derived in
the future is traced on the curve. The curve is concave to the origin because this rate of returns
gained from sacrificing consumption (i.e. the rate at which present gains are transformed in
future gains) in present for the future consumption keeps diminishing. In the context of a society,
as consumption rises, its social benefits tend to diminish and the total social value of
consumption tends to have diminishing returns. (Arrow, et al., 2011)
Diagram 2: Net Present Value of GHG Emissions as an Economic Good versus Discount Rate. Source: Prepared by Author.
Adapted from Samuelson & Nordhaus, (2004)
Using this analysis, (Robson, 2014) gave the following discount rates for the costs and benefitsof
carbon taxation. He summarized the costs as a percentage of the total GDP today based on the
discount rate. He considered the highest possible rates and the discount rate accorded by the
government.
6
Paraphrase This Document
Need a fresh take? Get an instant paraphrase of this document with our AI Paraphraser
Carbon Tax Australia
Picture 1 : The percentage ‘present value’ of projected economic costs of the carbon tax to Australia of the carbon tax until
2050 (Robson, 2014)
In theory, a carbon tax is a good solution and justified because it provided a “credible price
signal” and would encourage investment in alternative sources of energy.(Robson, 2014)
However, as Arrow’s model suggests, uncertainty reduces the credibility of this “price signal”.
Robson (2014) believes that the prevailing price signals were not strong enough due to the
addition of the uncertainty factor. This has been a point of much debate in the country.
It is important to note that in addition to carbon pricing, there are indirect forms of pricing
carbon too, such as taxes on fossil fuels, incentives to low-carbon technologies etc.(World Bank,
2017)
4. Valuing Damages to the Environment and Abatement
Carbon pricing helps in the monetary valuation of damages done to environment and in the
abatement of pollution. Abatement refers to the measures taken to reduce GHG emissions
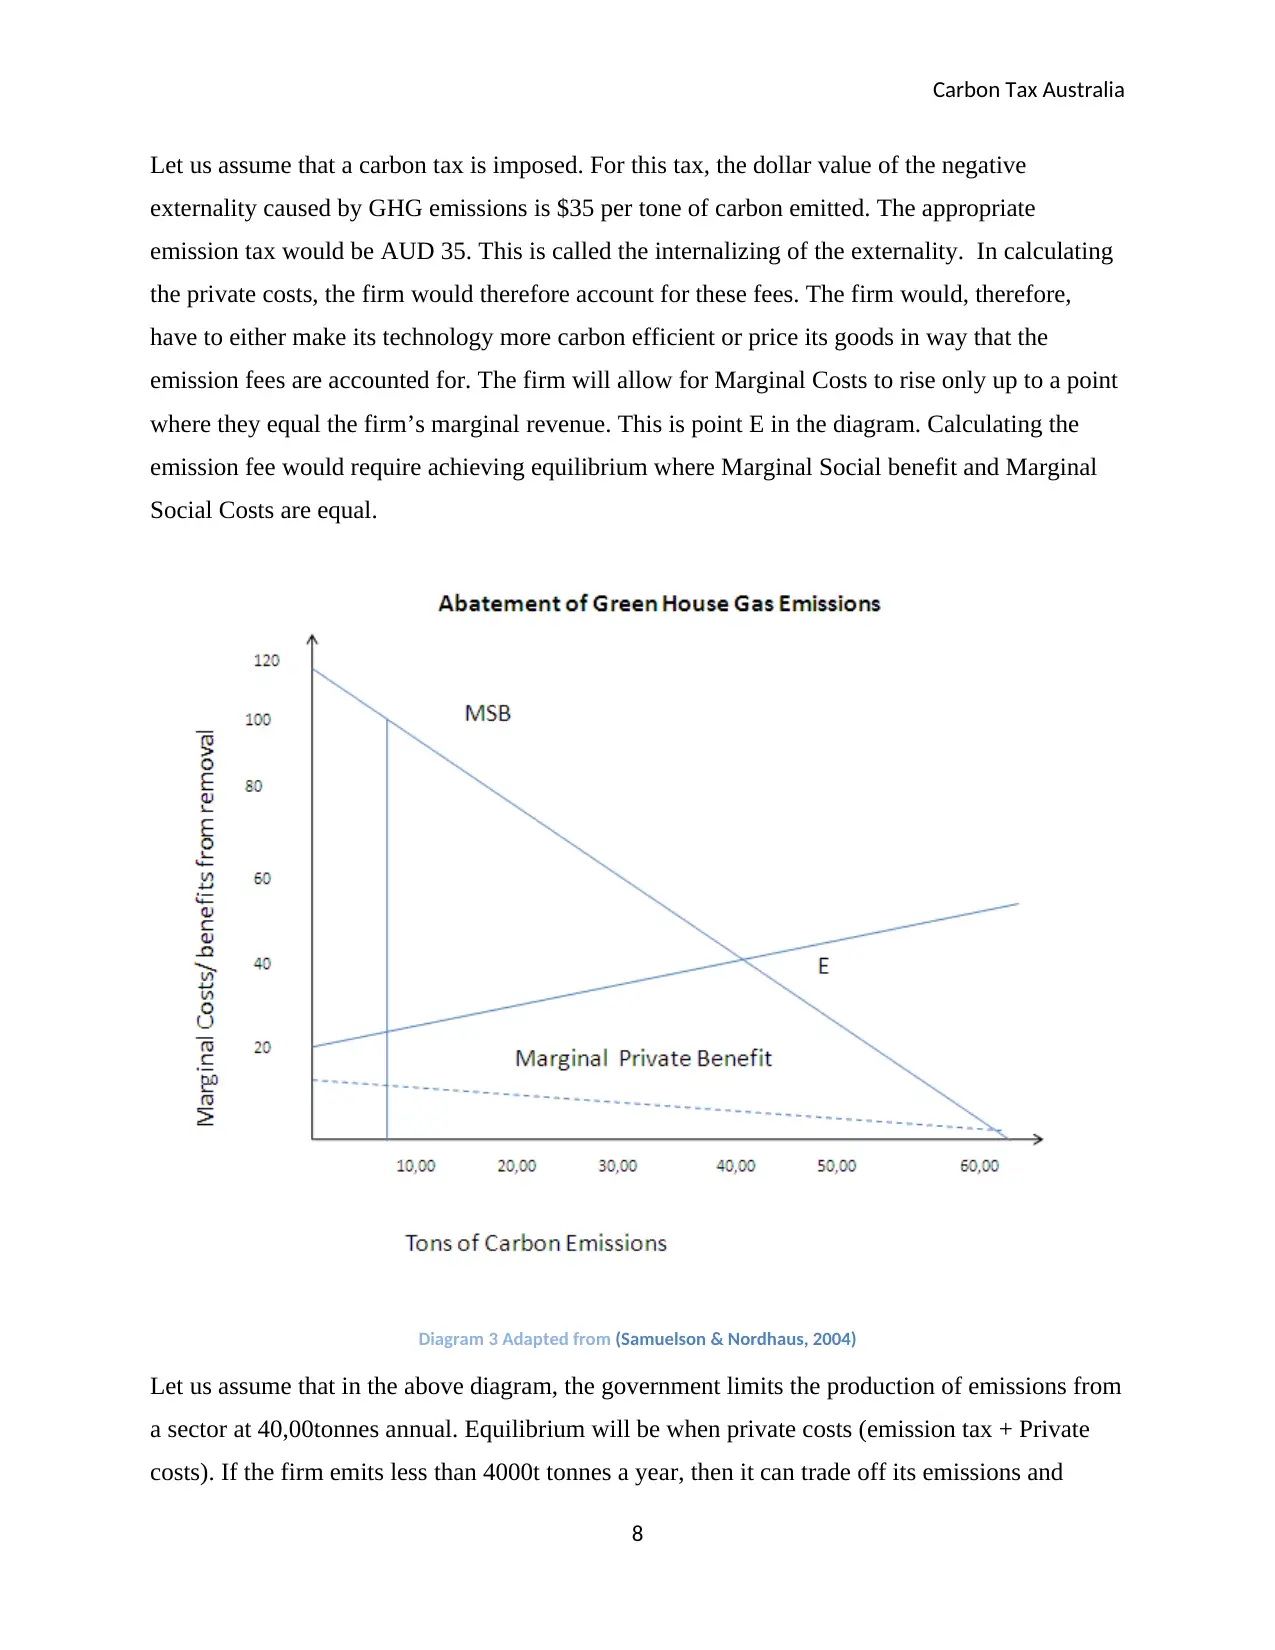
(Organization for Economic Co-operation and Development, 2001). The upward sloping market
(MC) curve is the marginal cost of abatement. The downward sloping curves are the marginal
benefits of reduction in GHG emissions. The upper solid line MSB is the marginal social benefit
from less pollution. While the lower Marginal Private Benefit line is the private benefit to the
consumers.(Samuelson & Nordhaus, 2004)
7
Picture 1 : The percentage ‘present value’ of projected economic costs of the carbon tax to Australia of the carbon tax until
2050 (Robson, 2014)
In theory, a carbon tax is a good solution and justified because it provided a “credible price
signal” and would encourage investment in alternative sources of energy.(Robson, 2014)
However, as Arrow’s model suggests, uncertainty reduces the credibility of this “price signal”.
Robson (2014) believes that the prevailing price signals were not strong enough due to the
addition of the uncertainty factor. This has been a point of much debate in the country.
It is important to note that in addition to carbon pricing, there are indirect forms of pricing
carbon too, such as taxes on fossil fuels, incentives to low-carbon technologies etc.(World Bank,
2017)
4. Valuing Damages to the Environment and Abatement
Carbon pricing helps in the monetary valuation of damages done to environment and in the
abatement of pollution. Abatement refers to the measures taken to reduce GHG emissions
(Organization for Economic Co-operation and Development, 2001). The upward sloping market
(MC) curve is the marginal cost of abatement. The downward sloping curves are the marginal
benefits of reduction in GHG emissions. The upper solid line MSB is the marginal social benefit
from less pollution. While the lower Marginal Private Benefit line is the private benefit to the
consumers.(Samuelson & Nordhaus, 2004)
7
Carbon Tax Australia
Let us assume that a carbon tax is imposed. For this tax, the dollar value of the negative
externality caused by GHG emissions is $35 per tone of carbon emitted. The appropriate
emission tax would be AUD 35. This is called the internalizing of the externality. In calculating
the private costs, the firm would therefore account for these fees. The firm would, therefore,
have to either make its technology more carbon efficient or price its goods in way that the
emission fees are accounted for. The firm will allow for Marginal Costs to rise only up to a point
where they equal the firm’s marginal revenue. This is point E in the diagram. Calculating the
emission fee would require achieving equilibrium where Marginal Social benefit and Marginal
Social Costs are equal.
Diagram 3 Adapted from (Samuelson & Nordhaus, 2004)
Let us assume that in the above diagram, the government limits the production of emissions from
a sector at 40,00tonnes annual. Equilibrium will be when private costs (emission tax + Private
costs). If the firm emits less than 4000t tonnes a year, then it can trade off its emissions and
8
⊘ This is a preview!⊘
Do you want full access?
Subscribe today to unlock all pages.
Trusted by 1+ million students worldwide
Carbon Tax Australia
reduce its marginal costs. If a firm has more emissions then it can buy more emissions. However,
then it must buy emissions. However, the firm cannot operate at a level where marginal costs are
greater than marginal revenue. Hence, the firm will be incentivized to reduce emissions to point
E. (Samuelson & Nordhaus, 2004)
“The arguments that proponents of the cap and trade schemes achieve abatement of emissions at
‘least cost’ since one the abatement targets are fixed, industries do not have the pressure to
reduce emissions further. Thus, industries have an incentive to make their process more efficient.
(Robson, 2014)
5. The popularity of carbon taxation
Australia’s ‘Carbon tax was introduced in February 2011 by Kevin Rudd government.
Currently, the cap and trade system has four broad variations. (Parliament of Australia, 2010)
‘Cap and Trade System There are trade-able permits that allow a set
amount of emissions on each permit.
‘Baseline and Credit’system A baseline of ‘allowable emissions’ (in
quantity are created and credit emissions must
be purchased for all emissions above this
baseline.
‘ Project based Emissions Market Clean development Mechanism based credits
can be purchased by projects within the
country or outside the country via Joint
Implementation Project
Hybrid Schemes A combination of the above schemes
According to a poll conducted in 2011, many Australian consumers were against the tax as they
believed that the tax would not help drastically reduce the total amount of carbon dioxide in the
market.(Roy Morgan Research, 2011)
9
Paraphrase This Document
Need a fresh take? Get an instant paraphrase of this document with our AI Paraphraser
Carbon Tax Australia
A majority of those surveyed also believed that the price of carbon over $23 dollars is
very high. Only 15% of those surveyed believed it should be higher.
A majority of respondents also believed that a carbon tax was not the best solution
towards an economy that priced carbon like a market good and that the tax would affect
the world carbon dioxide emissions.
Subsequently, the tax has been a major talking point during elections.
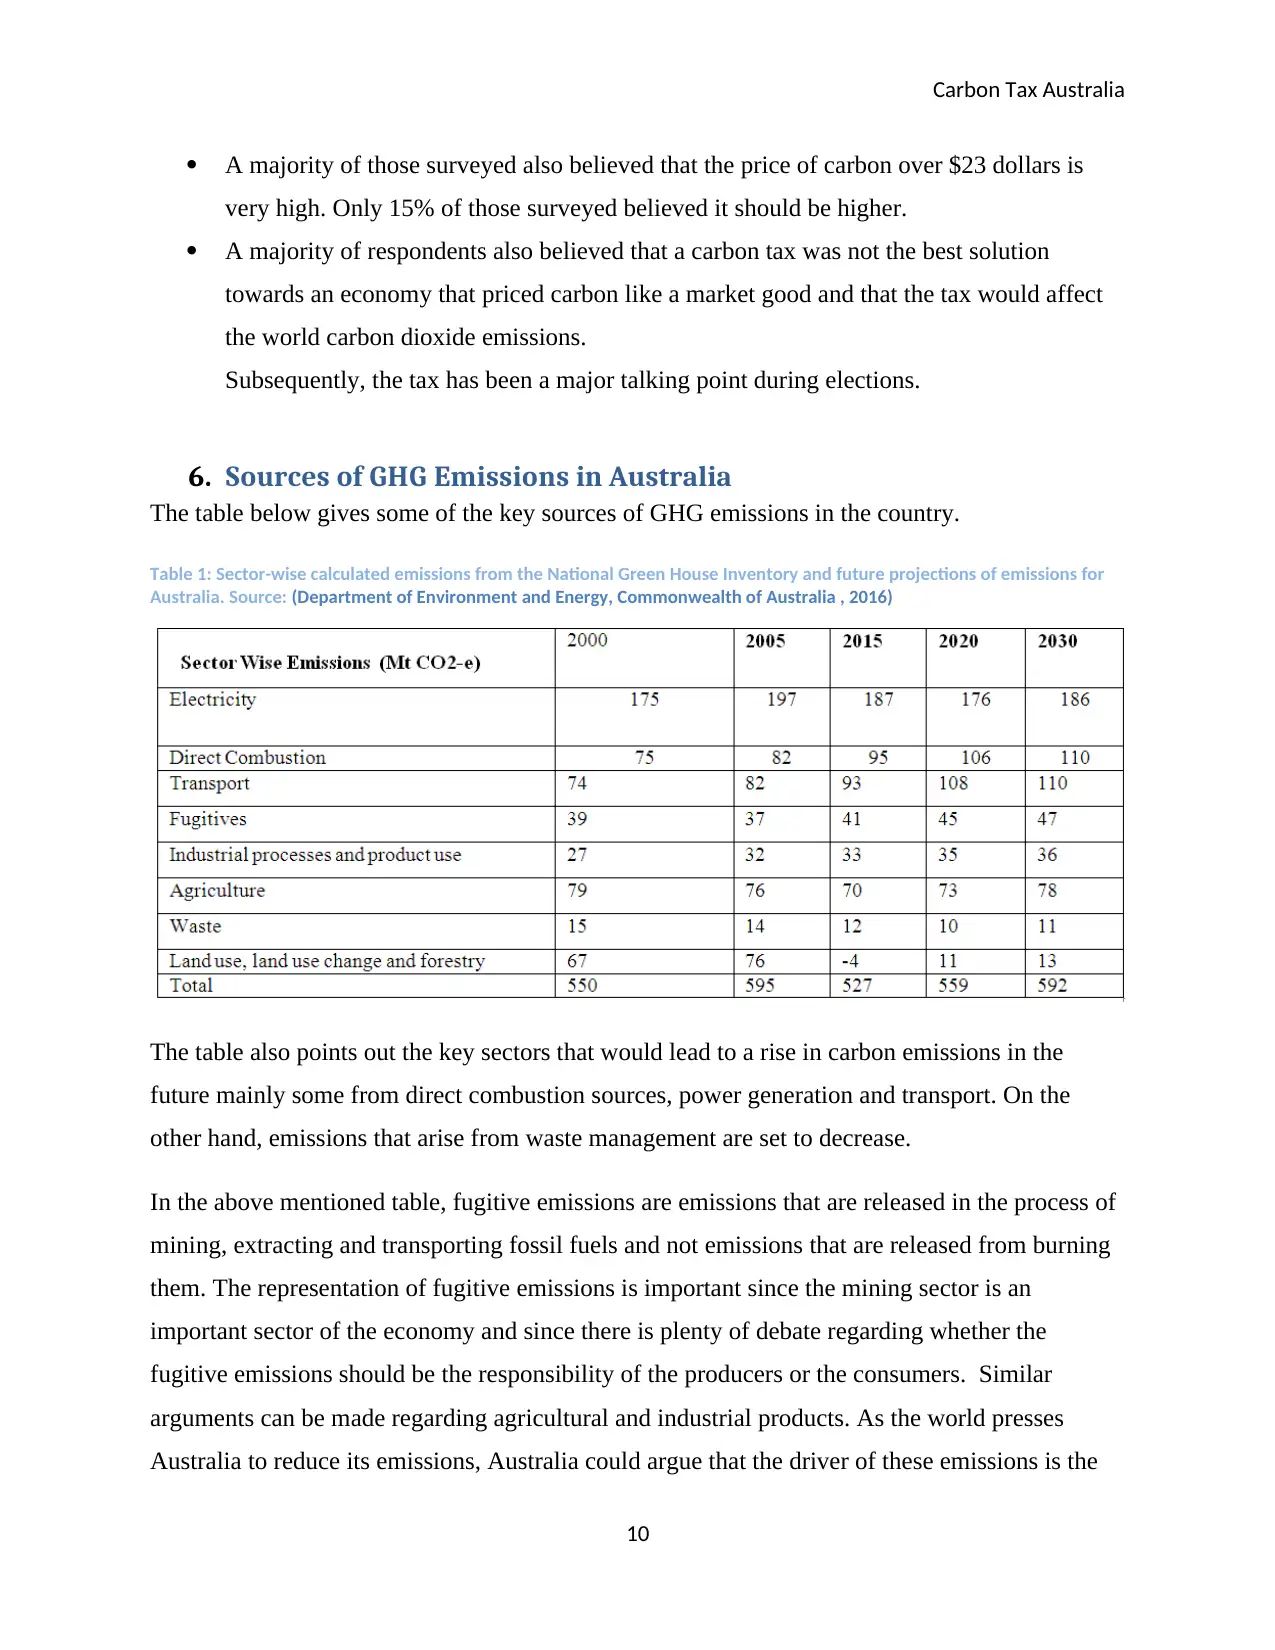
6. Sources of GHG Emissions in Australia
The table below gives some of the key sources of GHG emissions in the country.
Table 1: Sector-wise calculated emissions from the National Green House Inventory and future projections of emissions for
Australia. Source: (Department of Environment and Energy, Commonwealth of Australia , 2016)
The table also points out the key sectors that would lead to a rise in carbon emissions in the
future mainly some from direct combustion sources, power generation and transport. On the
other hand, emissions that arise from waste management are set to decrease.
In the above mentioned table, fugitive emissions are emissions that are released in the process of
mining, extracting and transporting fossil fuels and not emissions that are released from burning
them. The representation of fugitive emissions is important since the mining sector is an
important sector of the economy and since there is plenty of debate regarding whether the
fugitive emissions should be the responsibility of the producers or the consumers. Similar
arguments can be made regarding agricultural and industrial products. As the world presses
Australia to reduce its emissions, Australia could argue that the driver of these emissions is the
10
A majority of those surveyed also believed that the price of carbon over $23 dollars is
very high. Only 15% of those surveyed believed it should be higher.
A majority of respondents also believed that a carbon tax was not the best solution
towards an economy that priced carbon like a market good and that the tax would affect
the world carbon dioxide emissions.
Subsequently, the tax has been a major talking point during elections.
6. Sources of GHG Emissions in Australia
The table below gives some of the key sources of GHG emissions in the country.
Table 1: Sector-wise calculated emissions from the National Green House Inventory and future projections of emissions for
Australia. Source: (Department of Environment and Energy, Commonwealth of Australia , 2016)
The table also points out the key sectors that would lead to a rise in carbon emissions in the
future mainly some from direct combustion sources, power generation and transport. On the
other hand, emissions that arise from waste management are set to decrease.
In the above mentioned table, fugitive emissions are emissions that are released in the process of
mining, extracting and transporting fossil fuels and not emissions that are released from burning
them. The representation of fugitive emissions is important since the mining sector is an
important sector of the economy and since there is plenty of debate regarding whether the
fugitive emissions should be the responsibility of the producers or the consumers. Similar
arguments can be made regarding agricultural and industrial products. As the world presses
Australia to reduce its emissions, Australia could argue that the driver of these emissions is the
10
Carbon Tax Australia
demand for these goods and services which are consumed outside of the country. The same could
be said of the mineral resources of the country such as coal etc. (Lenzen, Murray, Sack, &
Weidmann, 2006)
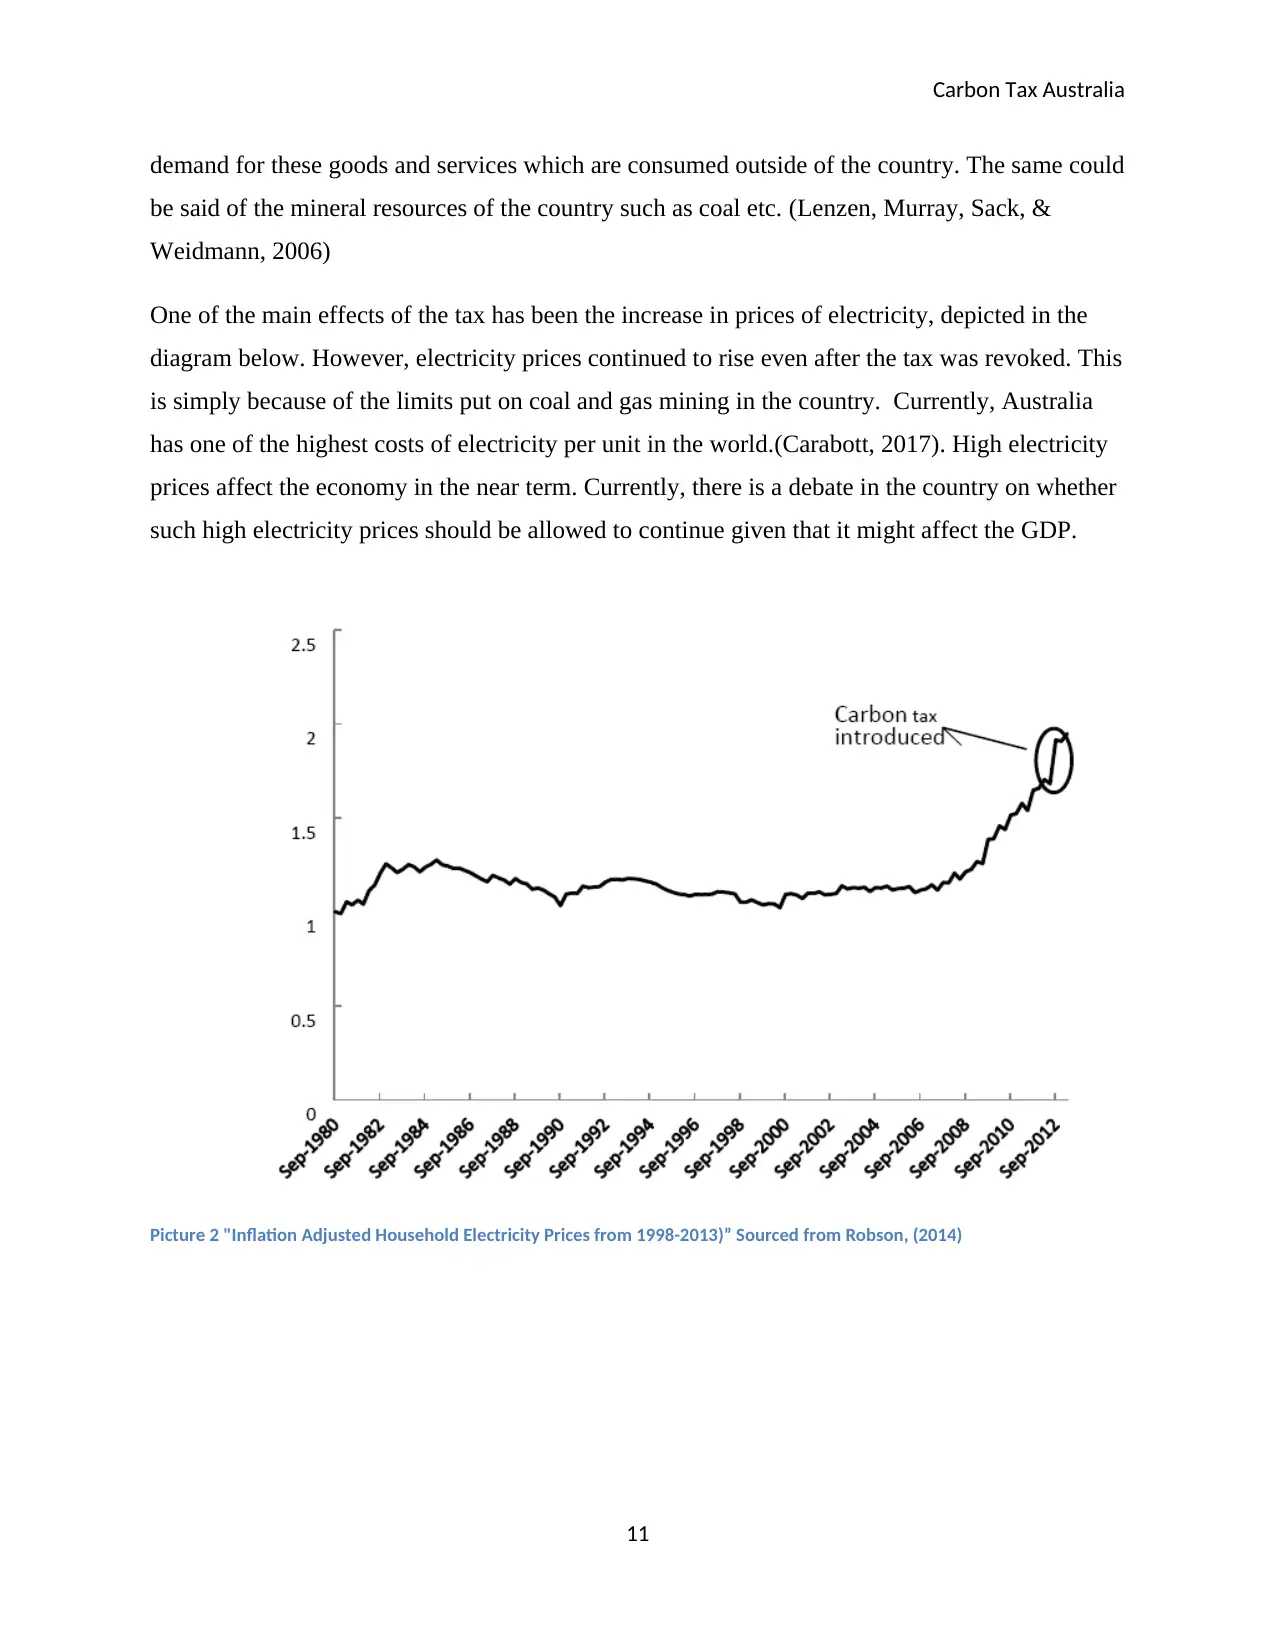
One of the main effects of the tax has been the increase in prices of electricity, depicted in the
diagram below. However, electricity prices continued to rise even after the tax was revoked. This
is simply because of the limits put on coal and gas mining in the country. Currently, Australia
has one of the highest costs of electricity per unit in the world.(Carabott, 2017). High electricity
prices affect the economy in the near term. Currently, there is a debate in the country on whether
such high electricity prices should be allowed to continue given that it might affect the GDP.
Picture 2 "Inflation Adjusted Household Electricity Prices from 1998-2013)” Sourced from Robson, (2014)
11
demand for these goods and services which are consumed outside of the country. The same could
be said of the mineral resources of the country such as coal etc. (Lenzen, Murray, Sack, &
Weidmann, 2006)
One of the main effects of the tax has been the increase in prices of electricity, depicted in the
diagram below. However, electricity prices continued to rise even after the tax was revoked. This
is simply because of the limits put on coal and gas mining in the country. Currently, Australia
has one of the highest costs of electricity per unit in the world.(Carabott, 2017). High electricity
prices affect the economy in the near term. Currently, there is a debate in the country on whether
such high electricity prices should be allowed to continue given that it might affect the GDP.
Picture 2 "Inflation Adjusted Household Electricity Prices from 1998-2013)” Sourced from Robson, (2014)
11
⊘ This is a preview!⊘
Do you want full access?
Subscribe today to unlock all pages.
Trusted by 1+ million students worldwide
1 out of 16
Related Documents


Your All-in-One AI-Powered Toolkit for Academic Success.
+13062052269
info@desklib.com
Available 24*7 on WhatsApp / Email
![[object Object]](/_next/static/media/star-bottom.7253800d.svg)
Unlock your academic potential
Copyright © 2020–2026 A2Z Services. All Rights Reserved. Developed and managed by ZUCOL.