Data Analysis Project: Card Fraud Analysis and Recommendations
VerifiedAdded on 2020/05/04
|19
|3736
|143
Project
AI Summary
This project, titled "Foundations of Data Analysis," investigates card fraud through statistical analysis. The research examines data from 420 customers to identify the frequency of online and offline card fraud, and the impact of various factors on customer satisfaction with the credit card fraud resolution team. The study employs t-tests, ANOVA, and regression analysis to test hypotheses related to gender, age groups, and the influence of response time, advice, and communication on overall customer satisfaction. The findings reveal that online card fraud is more prevalent than offline fraud, and that customer satisfaction is influenced by the fraud resolution team's response time, advice, and communication skills. The project concludes with recommendations for improving security measures and customer service to mitigate card fraud and enhance customer satisfaction.
Running Head: FOUNDATIONS OF DATA ANALYSIS
Foundations of Data Analysis
Name of the Student
Name of the University
Author Note
Foundations of Data Analysis
Name of the Student
Name of the University
Author Note
Paraphrase This Document
Need a fresh take? Get an instant paraphrase of this document with our AI Paraphraser
1FOUNDATIONS OF DATA ANALYSIS
Executive Summary
This research is conducted in order to identify the frequency of online and offline card frauds and
understand the need of reducing the card fraud and the service time that is required to solve the
issue. It has been observed that online card fraud is more likely to occur than offline card fraud
and the company should adopt better security plans to reduce this issue. Further, the overall
satisfaction of the customers is influenced by ‘response time’, ‘the level of advice’ and ‘the level
of communication’ of the credit card fraud resolution team. Thus, these services provided by the
company should also be improved.
2FOUNDATIONS OF DATA ANALYSIS
Table of Contents
1.0 Introduction................................................................................................................................3
2.0 Research Design........................................................................................................................4
3.0 Hypothesis Development...........................................................................................................5
4.0 Statistical Technique and Justification......................................................................................6
5.0 Results and Interpretations........................................................................................................7
5.1 Test for Question 1................................................................................................................7
5.2 Test for Question 2..............................................................................................................10
5.3 Test for Question 3..............................................................................................................12
5.4 Test for Question 4..............................................................................................................13
5.5 Test for Question 5..............................................................................................................14
6.0 Analysis and Summary of the Results.....................................................................................16
7.0 Recommendations....................................................................................................................16
REFERENCES..............................................................................................................................17
⊘ This is a preview!⊘
Do you want full access?
Subscribe today to unlock all pages.
Trusted by 1+ million students worldwide
3FOUNDATIONS OF DATA ANALYSIS
1.0 Introduction
One of the largest networks in the world in retail electronic payments is operated by the
company Visa Inc. The company is also one of the most recognized brands in financial services
across the world. The company provides a lot of facilities to the global commerce. These
facilities include information and value transfer within some financial institutions, consumers,
businesses, merchants and government entities.
There are a lot of types of fraud cases that are going on in the world nowadays. The most
frequent fraud case that is happening now is credit card fraud. This type of card fraud is
happening online as well as offline. Thus, this credit card company Visa Inc. is running this
research to identify some specific issues and reduce the frequency of card fraud.
The primary objectives of this research are discussed as follows.
To identify whether the number of card fraud is experienced differs across gender.
To identify whether there is any difference across age group of people regarding card
fraud.
To determine whether the average time that is required to resolve the problem of card
fraud is less than 12 hours or not.
To determine the frequency of occurrence of online or offline card fraud.
To determine whether there is any difference between the frequency of online and offline
card fraud.
To identify the influence of customers’ satisfaction scores of ‘response time’, ‘the level
of advice’ and ‘the level of communication’ on the overall satisfaction with the credit
card fraud resolution team.
Paraphrase This Document
Need a fresh take? Get an instant paraphrase of this document with our AI Paraphraser
4FOUNDATIONS OF DATA ANALYSIS
2.0 Research Design
In order to perform this research, data has to be collected. The data that is collected is on
the experience of the customers in personal fraud. 2000 customers were selected randomly using
the technique of simple random sampling. Among these 2000 customers who were selected to
fill the questionnaire, 420 only responded. Thus, the success rate of the responses is only 21
percent.
The ethical considerations that has to be kept in mind while collecting the data and doing
the research are given below (Cacciattolo, 2015):
The participants involved in the research should not be subjected to any types of harm.
Respect and priority should be given to the dignity of the participants involved in the
research.
The participants should give full consent before participating in the study.
The privacy of the participants taking part in the research must be assured.
The data collected for the research purpose should be kept confidentially and must not be
disclosed to anybody other than the individuals who are directly related to the research. .
The participants of the survey must be assured that their identities will not be disclosed
anywhere.
The research aims and objectives must not be exaggerated.
Any affiliations that are offered to the research or any sources from which the funding for
the research are obtained must be mentioned at the time of the research.
Communications that are necessary in doing the research must be done honestly and
transparently.
5FOUNDATIONS OF DATA ANALYSIS
Information that are misleading to the research and biasness of the data in analysis and
representation must not be done.
3.0 Hypothesis Development
For the purpose of the research, the following hypothesis can be framed:
Question 1: Is the number of card fraud experienced the same across gender?
Null Hypothesis (H01): There is no significant difference between the card fraud experienced by
males and females.
Alternate Hypothesis (HA1): There is significant difference between the card fraud experienced
by males and females.
Question 2: Are there differences across age groups regarding card fraud?
Null Hypothesis (H02): There is no significant difference across age groups regarding card fraud.
Alternate Hypothesis (HA2): There is no significant difference across age groups regarding card
fraud.
Question 3: Is 12 hours’ time significant as response time compared to what the customers have
experienced before?
Null Hypothesis (H03): There is no significant difference in the average response time from 12
hours
Alternate Hypothesis (HA3): The average response time is less than 12 hours.
Question 4: Is the frequency of online card fraud more than that of offline card fraud?
⊘ This is a preview!⊘
Do you want full access?
Subscribe today to unlock all pages.
Trusted by 1+ million students worldwide
6FOUNDATIONS OF DATA ANALYSIS
Null Hypothesis (H04): There is no significant difference in the frequency of online card fraud
from offline card fraud.
Alternate Hypothesis (HA4): There is significant difference in the frequency of online card fraud
from offline card fraud.
Question 5: Do any of the customers’ satisfaction scores of ‘response time, ‘the level of advice’
and ‘the level of communication’ influence the overall satisfaction with the credit card fraud
resolution team?
Null Hypothesis (H05): The customers’ satisfaction scores of ‘response time, ‘the level of
advice’ and ‘the level of communication’ do not influence the overall satisfaction with the credit
card fraud resolution team
Alternate Hypothesis (HA5): The customers’ satisfaction scores of ‘response time, ‘the level of
advice’ and ‘the level of communication’ influence the overall satisfaction with the credit card
fraud resolution team.
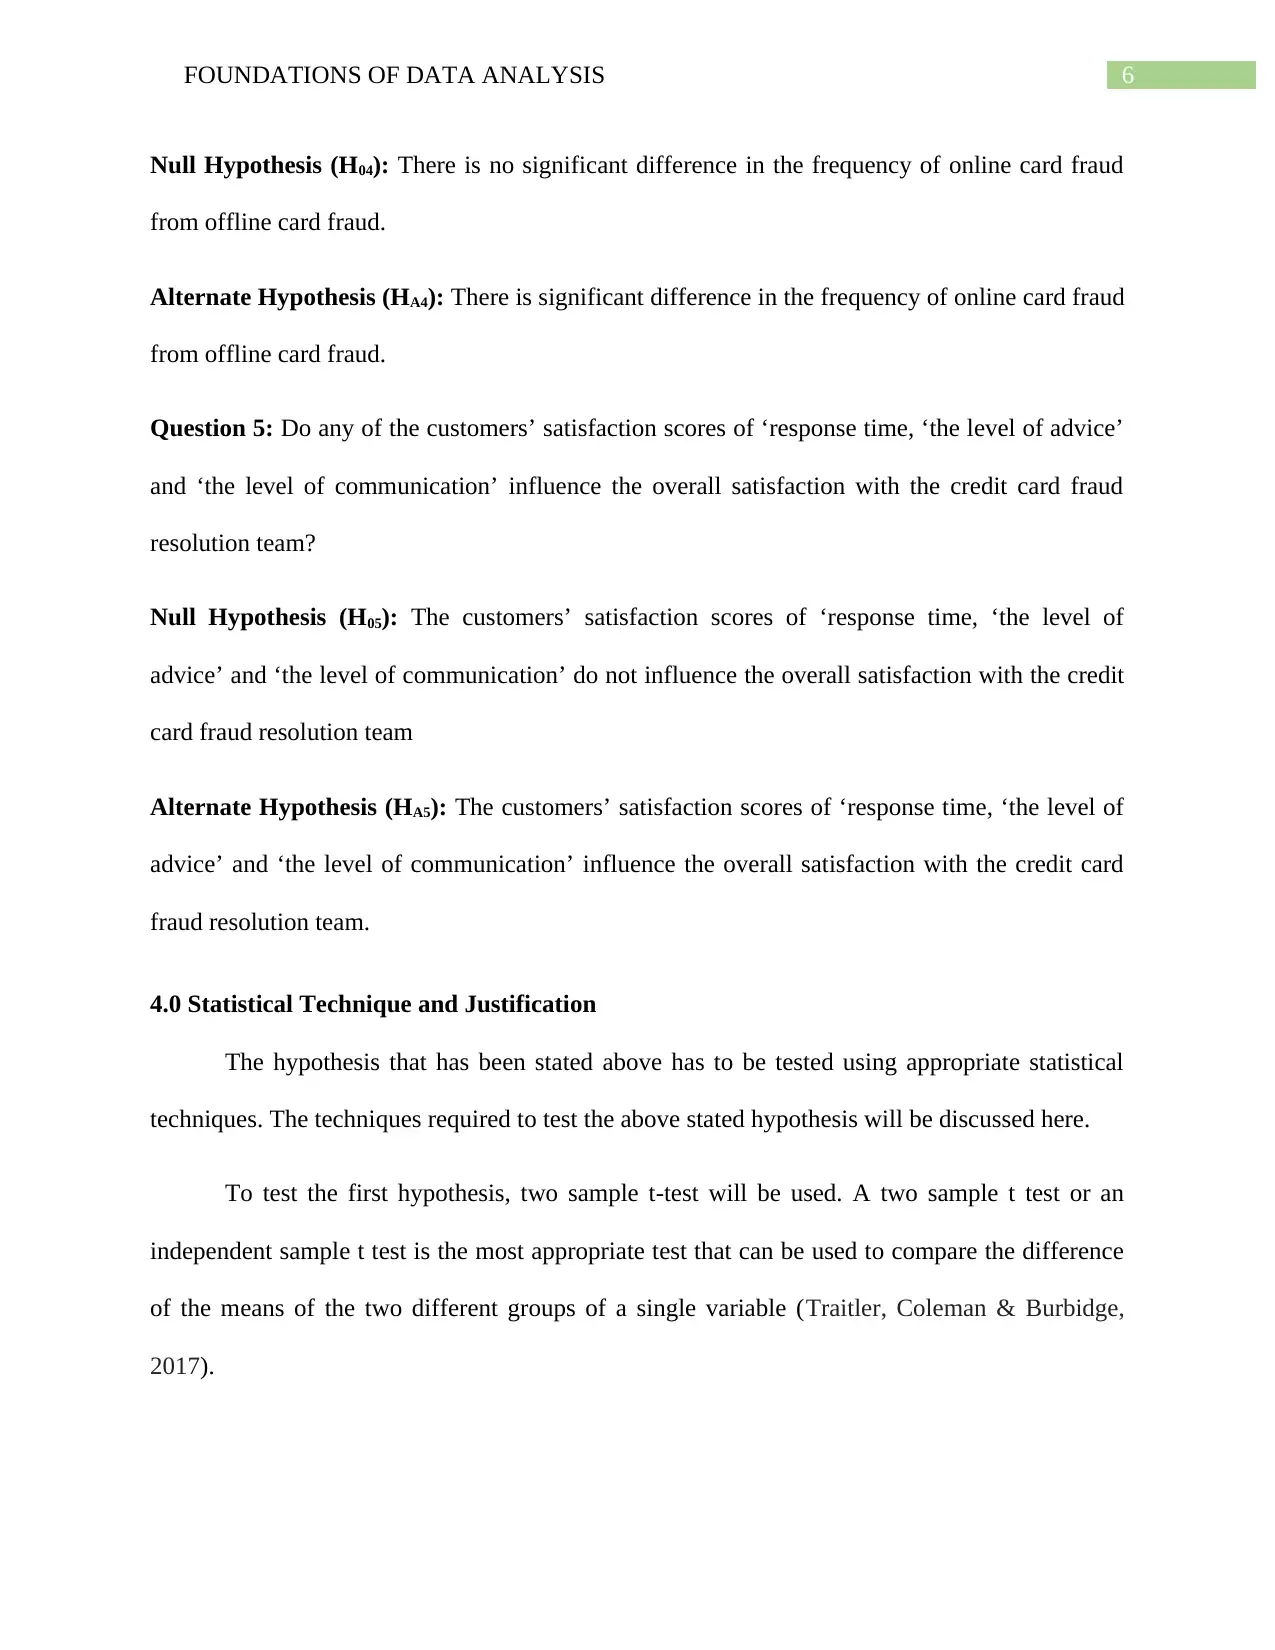
4.0 Statistical Technique and Justification
The hypothesis that has been stated above has to be tested using appropriate statistical
techniques. The techniques required to test the above stated hypothesis will be discussed here.
To test the first hypothesis, two sample t-test will be used. A two sample t test or an
independent sample t test is the most appropriate test that can be used to compare the difference
of the means of the two different groups of a single variable (Traitler, Coleman & Burbidge,
2017).
Null Hypothesis (H04): There is no significant difference in the frequency of online card fraud
from offline card fraud.
Alternate Hypothesis (HA4): There is significant difference in the frequency of online card fraud
from offline card fraud.
Question 5: Do any of the customers’ satisfaction scores of ‘response time, ‘the level of advice’
and ‘the level of communication’ influence the overall satisfaction with the credit card fraud
resolution team?
Null Hypothesis (H05): The customers’ satisfaction scores of ‘response time, ‘the level of
advice’ and ‘the level of communication’ do not influence the overall satisfaction with the credit
card fraud resolution team
Alternate Hypothesis (HA5): The customers’ satisfaction scores of ‘response time, ‘the level of
advice’ and ‘the level of communication’ influence the overall satisfaction with the credit card
fraud resolution team.
4.0 Statistical Technique and Justification
The hypothesis that has been stated above has to be tested using appropriate statistical
techniques. The techniques required to test the above stated hypothesis will be discussed here.
To test the first hypothesis, two sample t-test will be used. A two sample t test or an
independent sample t test is the most appropriate test that can be used to compare the difference
of the means of the two different groups of a single variable (Traitler, Coleman & Burbidge,
2017).
Paraphrase This Document
Need a fresh take? Get an instant paraphrase of this document with our AI Paraphraser
7FOUNDATIONS OF DATA ANALYSIS
To test the second hypothesis, analysis of variance (ANOVA) test will be used as this the
most appropriate test to compare the means of more than two groups of a single variable (Wiley
& Pace, 2015).
To test the third hypothesis, a one-sample t-test will be used as this is the most
appropriate test to compare the mean of one variable with a pre determined mean of the variable
(Chachi, Taheri & Viertl, 2016).
To test the fourth hypothesis, two sample t-test will be performed as this is the most
appropriate test that can be used to compare the difference of the means of the two different
groups of a single variable.
To test the fifth hypothesis, regression analysis will be used as with the help of regression
analysis only it is possible to find out whether there is any influence of the independent variables
on the dependent variable (Draper & Smith, 2014).
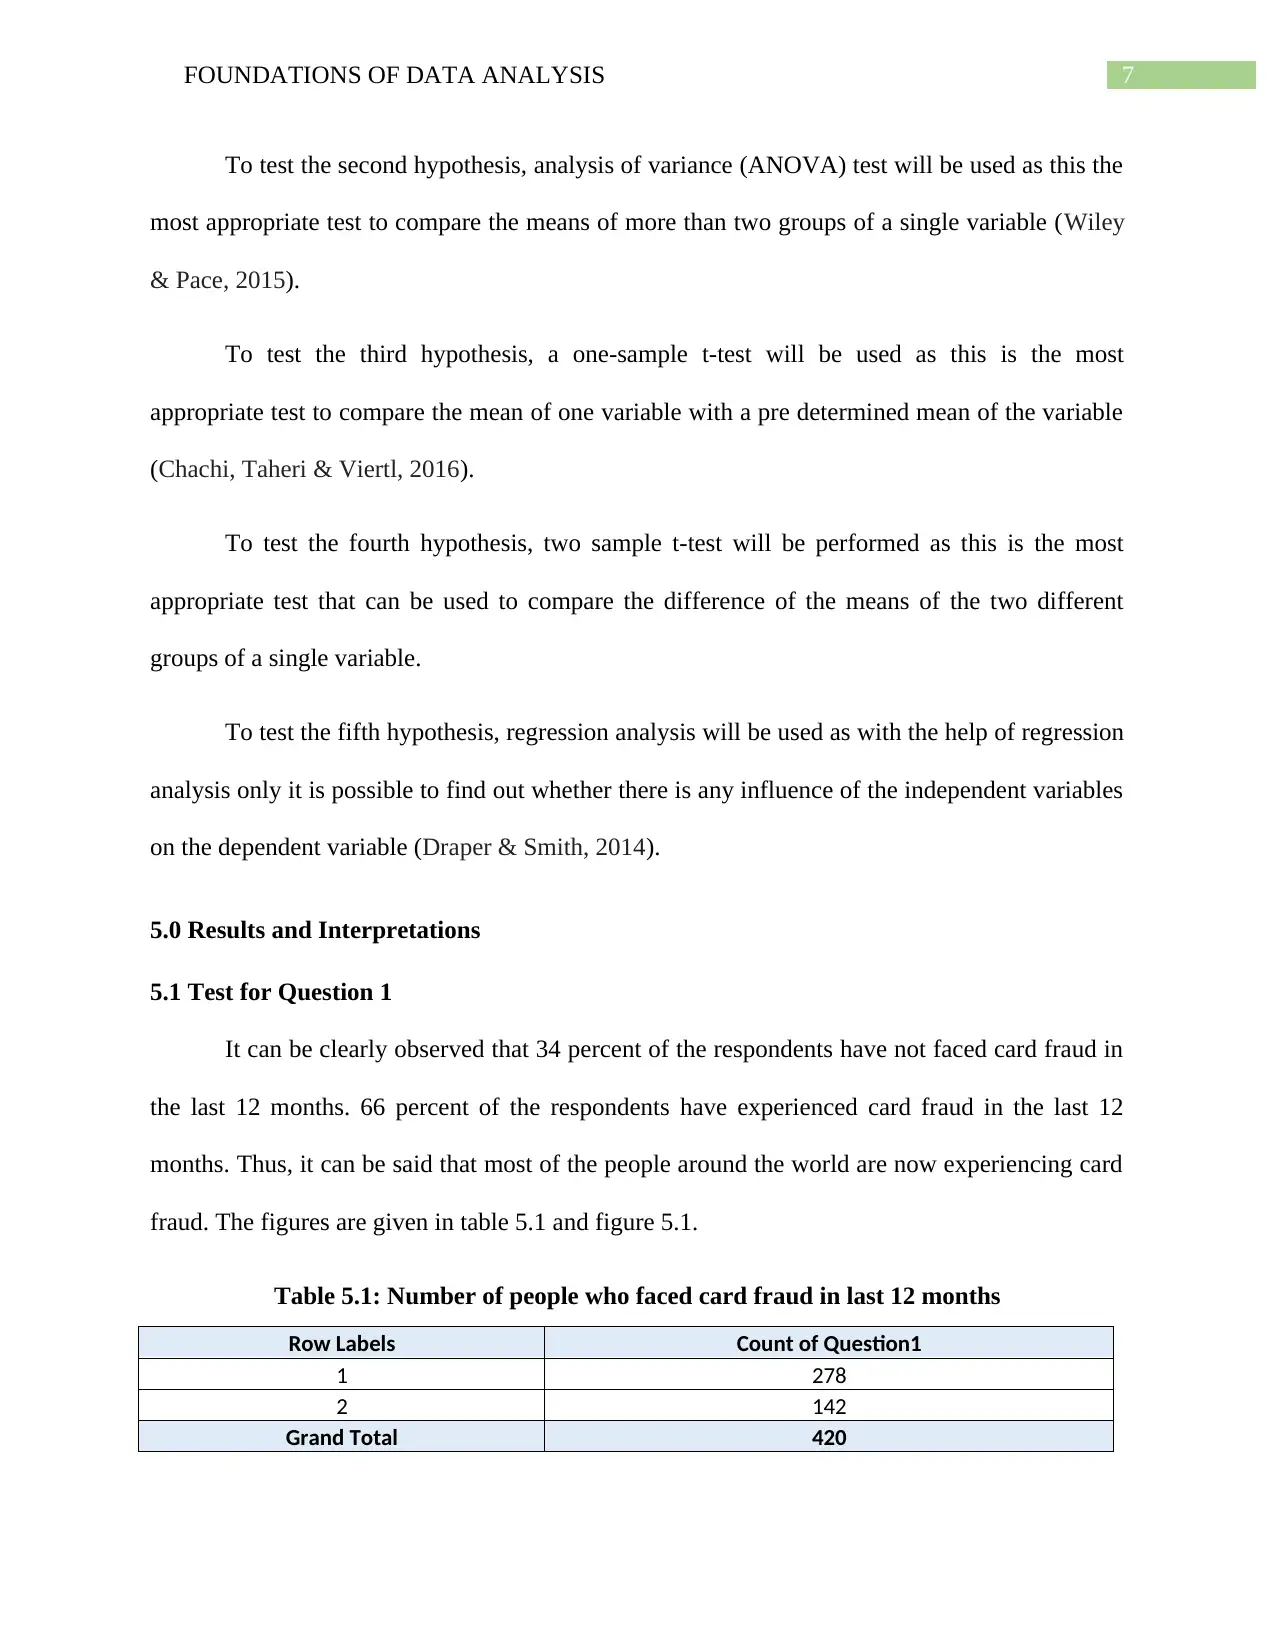
5.0 Results and Interpretations
5.1 Test for Question 1
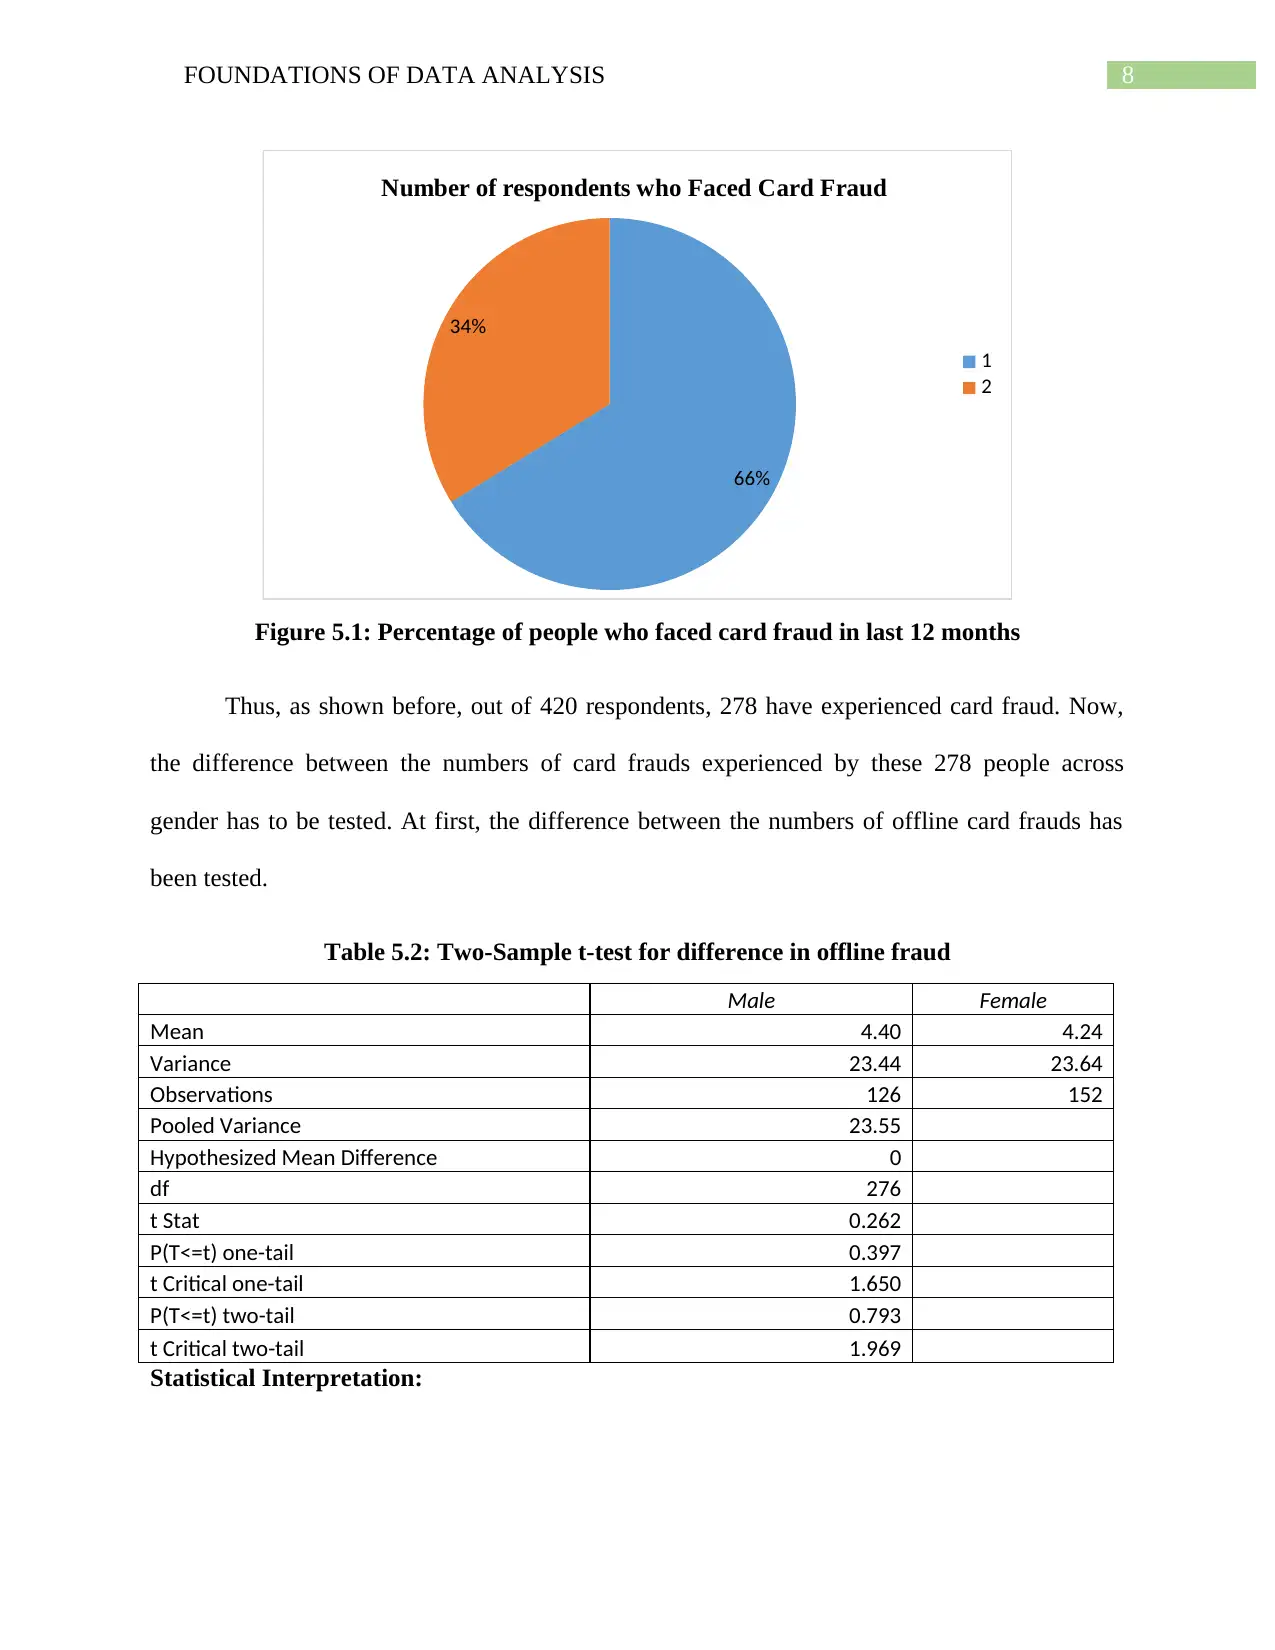
It can be clearly observed that 34 percent of the respondents have not faced card fraud in
the last 12 months. 66 percent of the respondents have experienced card fraud in the last 12
months. Thus, it can be said that most of the people around the world are now experiencing card
fraud. The figures are given in table 5.1 and figure 5.1.
Table 5.1: Number of people who faced card fraud in last 12 months
Row Labels Count of Question1
1 278
2 142
Grand Total 420
To test the second hypothesis, analysis of variance (ANOVA) test will be used as this the
most appropriate test to compare the means of more than two groups of a single variable (Wiley
& Pace, 2015).
To test the third hypothesis, a one-sample t-test will be used as this is the most
appropriate test to compare the mean of one variable with a pre determined mean of the variable
(Chachi, Taheri & Viertl, 2016).
To test the fourth hypothesis, two sample t-test will be performed as this is the most
appropriate test that can be used to compare the difference of the means of the two different
groups of a single variable.
To test the fifth hypothesis, regression analysis will be used as with the help of regression
analysis only it is possible to find out whether there is any influence of the independent variables
on the dependent variable (Draper & Smith, 2014).
5.0 Results and Interpretations
5.1 Test for Question 1
It can be clearly observed that 34 percent of the respondents have not faced card fraud in
the last 12 months. 66 percent of the respondents have experienced card fraud in the last 12
months. Thus, it can be said that most of the people around the world are now experiencing card
fraud. The figures are given in table 5.1 and figure 5.1.
Table 5.1: Number of people who faced card fraud in last 12 months
Row Labels Count of Question1
1 278
2 142
Grand Total 420
8FOUNDATIONS OF DATA ANALYSIS
66%
34%
Number of respondents who Faced Card Fraud
1
2
Figure 5.1: Percentage of people who faced card fraud in last 12 months
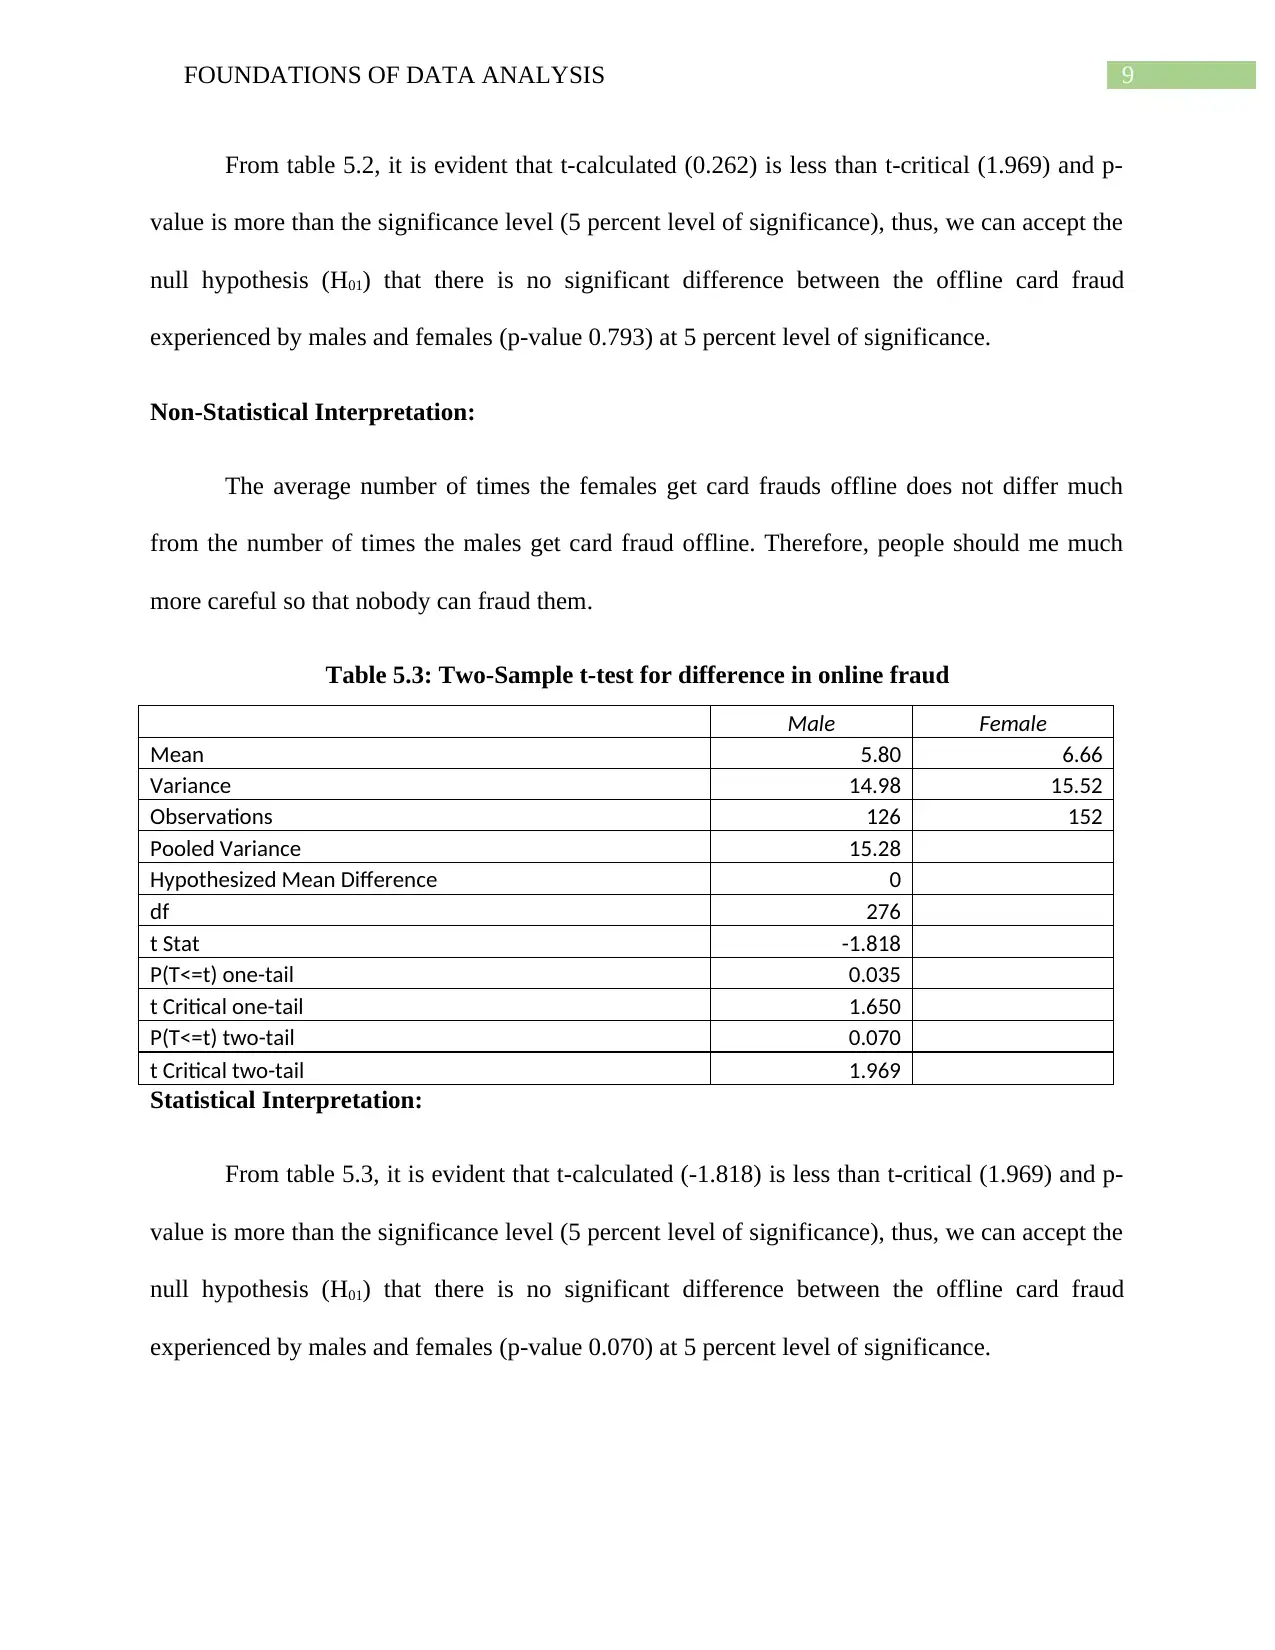
Thus, as shown before, out of 420 respondents, 278 have experienced card fraud. Now,
the difference between the numbers of card frauds experienced by these 278 people across
gender has to be tested. At first, the difference between the numbers of offline card frauds has
been tested.
Table 5.2: Two-Sample t-test for difference in offline fraud
Male Female
Mean 4.40 4.24
Variance 23.44 23.64
Observations 126 152
Pooled Variance 23.55
Hypothesized Mean Difference 0
df 276
t Stat 0.262
P(T<=t) one-tail 0.397
t Critical one-tail 1.650
P(T<=t) two-tail 0.793
t Critical two-tail 1.969
Statistical Interpretation:
66%
34%
Number of respondents who Faced Card Fraud
1
2
Figure 5.1: Percentage of people who faced card fraud in last 12 months
Thus, as shown before, out of 420 respondents, 278 have experienced card fraud. Now,
the difference between the numbers of card frauds experienced by these 278 people across
gender has to be tested. At first, the difference between the numbers of offline card frauds has
been tested.
Table 5.2: Two-Sample t-test for difference in offline fraud
Male Female
Mean 4.40 4.24
Variance 23.44 23.64
Observations 126 152
Pooled Variance 23.55
Hypothesized Mean Difference 0
df 276
t Stat 0.262
P(T<=t) one-tail 0.397
t Critical one-tail 1.650
P(T<=t) two-tail 0.793
t Critical two-tail 1.969
Statistical Interpretation:
⊘ This is a preview!⊘
Do you want full access?
Subscribe today to unlock all pages.
Trusted by 1+ million students worldwide
9FOUNDATIONS OF DATA ANALYSIS
From table 5.2, it is evident that t-calculated (0.262) is less than t-critical (1.969) and p-
value is more than the significance level (5 percent level of significance), thus, we can accept the
null hypothesis (H01) that there is no significant difference between the offline card fraud
experienced by males and females (p-value 0.793) at 5 percent level of significance.
Non-Statistical Interpretation:
The average number of times the females get card frauds offline does not differ much
from the number of times the males get card fraud offline. Therefore, people should me much
more careful so that nobody can fraud them.
Table 5.3: Two-Sample t-test for difference in online fraud
Male Female
Mean 5.80 6.66
Variance 14.98 15.52
Observations 126 152
Pooled Variance 15.28
Hypothesized Mean Difference 0
df 276
t Stat -1.818
P(T<=t) one-tail 0.035
t Critical one-tail 1.650
P(T<=t) two-tail 0.070
t Critical two-tail 1.969
Statistical Interpretation:
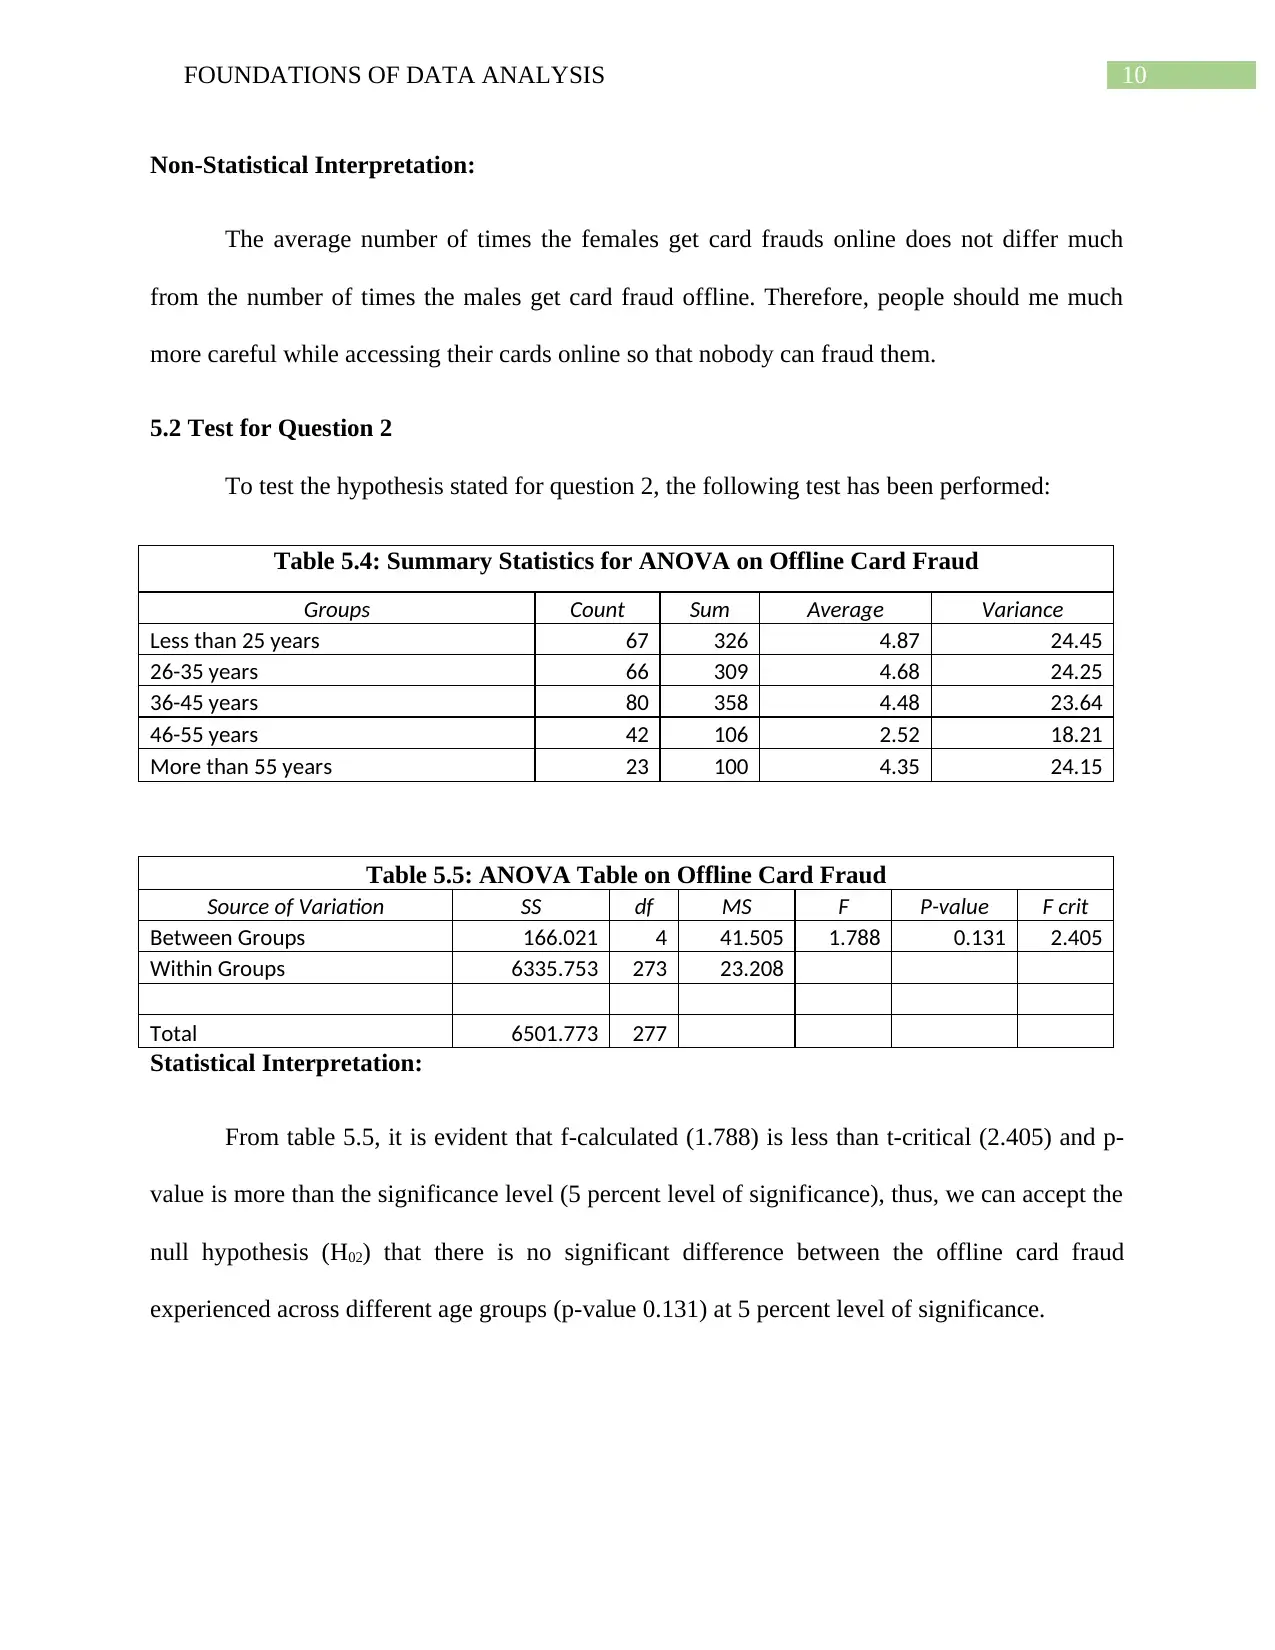
From table 5.3, it is evident that t-calculated (-1.818) is less than t-critical (1.969) and p-
value is more than the significance level (5 percent level of significance), thus, we can accept the
null hypothesis (H01) that there is no significant difference between the offline card fraud
experienced by males and females (p-value 0.070) at 5 percent level of significance.
From table 5.2, it is evident that t-calculated (0.262) is less than t-critical (1.969) and p-
value is more than the significance level (5 percent level of significance), thus, we can accept the
null hypothesis (H01) that there is no significant difference between the offline card fraud
experienced by males and females (p-value 0.793) at 5 percent level of significance.
Non-Statistical Interpretation:
The average number of times the females get card frauds offline does not differ much
from the number of times the males get card fraud offline. Therefore, people should me much
more careful so that nobody can fraud them.
Table 5.3: Two-Sample t-test for difference in online fraud
Male Female
Mean 5.80 6.66
Variance 14.98 15.52
Observations 126 152
Pooled Variance 15.28
Hypothesized Mean Difference 0
df 276
t Stat -1.818
P(T<=t) one-tail 0.035
t Critical one-tail 1.650
P(T<=t) two-tail 0.070
t Critical two-tail 1.969
Statistical Interpretation:
From table 5.3, it is evident that t-calculated (-1.818) is less than t-critical (1.969) and p-
value is more than the significance level (5 percent level of significance), thus, we can accept the
null hypothesis (H01) that there is no significant difference between the offline card fraud
experienced by males and females (p-value 0.070) at 5 percent level of significance.
Paraphrase This Document
Need a fresh take? Get an instant paraphrase of this document with our AI Paraphraser
10FOUNDATIONS OF DATA ANALYSIS
Non-Statistical Interpretation:
The average number of times the females get card frauds online does not differ much
from the number of times the males get card fraud offline. Therefore, people should me much
more careful while accessing their cards online so that nobody can fraud them.
5.2 Test for Question 2
To test the hypothesis stated for question 2, the following test has been performed:
Table 5.4: Summary Statistics for ANOVA on Offline Card Fraud
Groups Count Sum Average Variance
Less than 25 years 67 326 4.87 24.45
26-35 years 66 309 4.68 24.25
36-45 years 80 358 4.48 23.64
46-55 years 42 106 2.52 18.21
More than 55 years 23 100 4.35 24.15
Table 5.5: ANOVA Table on Offline Card Fraud
Source of Variation SS df MS F P-value F crit
Between Groups 166.021 4 41.505 1.788 0.131 2.405
Within Groups 6335.753 273 23.208
Total 6501.773 277
Statistical Interpretation:
From table 5.5, it is evident that f-calculated (1.788) is less than t-critical (2.405) and p-
value is more than the significance level (5 percent level of significance), thus, we can accept the
null hypothesis (H02) that there is no significant difference between the offline card fraud
experienced across different age groups (p-value 0.131) at 5 percent level of significance.
11FOUNDATIONS OF DATA ANALYSIS
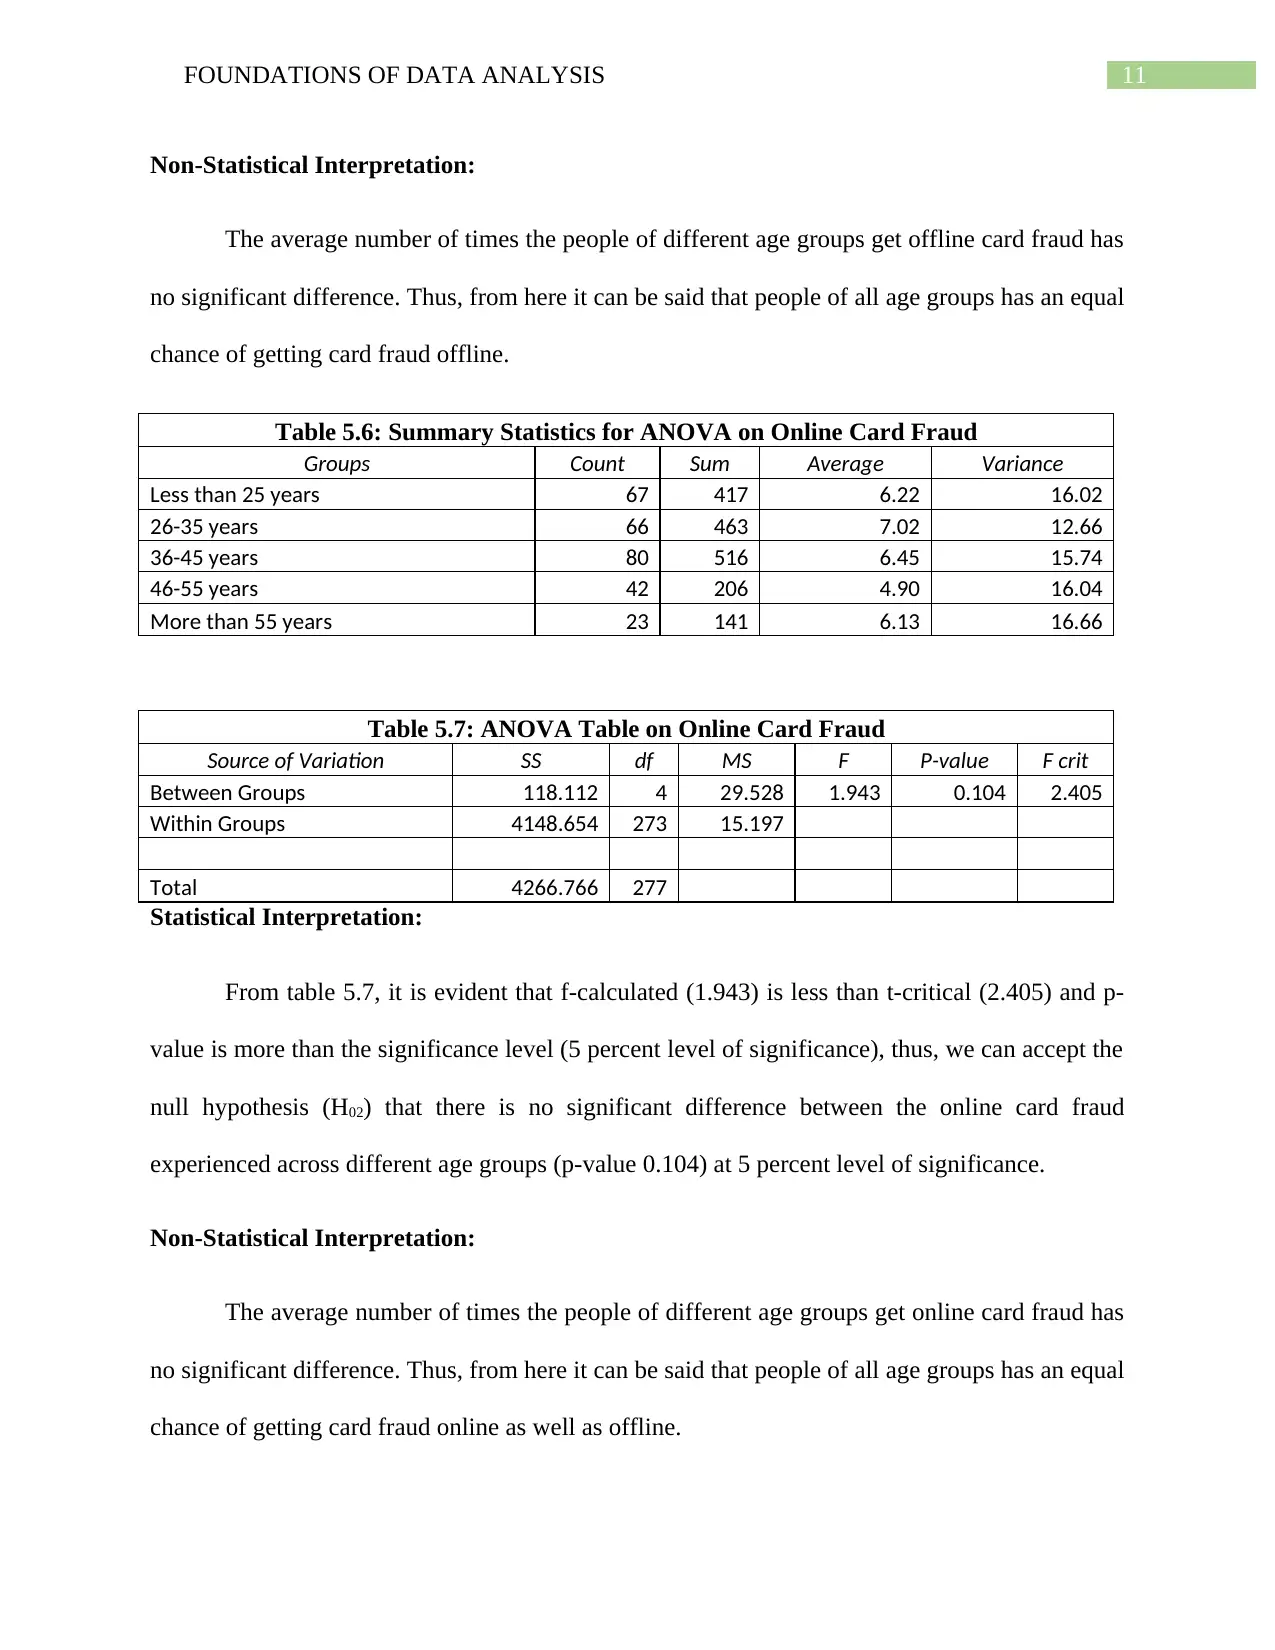
Non-Statistical Interpretation:
The average number of times the people of different age groups get offline card fraud has
no significant difference. Thus, from here it can be said that people of all age groups has an equal
chance of getting card fraud offline.
Table 5.6: Summary Statistics for ANOVA on Online Card Fraud
Groups Count Sum Average Variance
Less than 25 years 67 417 6.22 16.02
26-35 years 66 463 7.02 12.66
36-45 years 80 516 6.45 15.74
46-55 years 42 206 4.90 16.04
More than 55 years 23 141 6.13 16.66
Table 5.7: ANOVA Table on Online Card Fraud
Source of Variation SS df MS F P-value F crit
Between Groups 118.112 4 29.528 1.943 0.104 2.405
Within Groups 4148.654 273 15.197
Total 4266.766 277
Statistical Interpretation:
From table 5.7, it is evident that f-calculated (1.943) is less than t-critical (2.405) and p-
value is more than the significance level (5 percent level of significance), thus, we can accept the
null hypothesis (H02) that there is no significant difference between the online card fraud
experienced across different age groups (p-value 0.104) at 5 percent level of significance.
Non-Statistical Interpretation:
The average number of times the people of different age groups get online card fraud has
no significant difference. Thus, from here it can be said that people of all age groups has an equal
chance of getting card fraud online as well as offline.
Non-Statistical Interpretation:
The average number of times the people of different age groups get offline card fraud has
no significant difference. Thus, from here it can be said that people of all age groups has an equal
chance of getting card fraud offline.
Table 5.6: Summary Statistics for ANOVA on Online Card Fraud
Groups Count Sum Average Variance
Less than 25 years 67 417 6.22 16.02
26-35 years 66 463 7.02 12.66
36-45 years 80 516 6.45 15.74
46-55 years 42 206 4.90 16.04
More than 55 years 23 141 6.13 16.66
Table 5.7: ANOVA Table on Online Card Fraud
Source of Variation SS df MS F P-value F crit
Between Groups 118.112 4 29.528 1.943 0.104 2.405
Within Groups 4148.654 273 15.197
Total 4266.766 277
Statistical Interpretation:
From table 5.7, it is evident that f-calculated (1.943) is less than t-critical (2.405) and p-
value is more than the significance level (5 percent level of significance), thus, we can accept the
null hypothesis (H02) that there is no significant difference between the online card fraud
experienced across different age groups (p-value 0.104) at 5 percent level of significance.
Non-Statistical Interpretation:
The average number of times the people of different age groups get online card fraud has
no significant difference. Thus, from here it can be said that people of all age groups has an equal
chance of getting card fraud online as well as offline.
⊘ This is a preview!⊘
Do you want full access?
Subscribe today to unlock all pages.
Trusted by 1+ million students worldwide
1 out of 19
Related Documents


Your All-in-One AI-Powered Toolkit for Academic Success.
+13062052269
info@desklib.com
Available 24*7 on WhatsApp / Email
![[object Object]](/_next/static/media/star-bottom.7253800d.svg)
Unlock your academic potential
Copyright © 2020–2026 A2Z Services. All Rights Reserved. Developed and managed by ZUCOL.