Advanced Biostatistics Assignment 2: Cardiac & Thyroid Data Analysis

Verified

Added on  2022/11/29

|32
|6283
|306
Homework Assignment
AI Summary
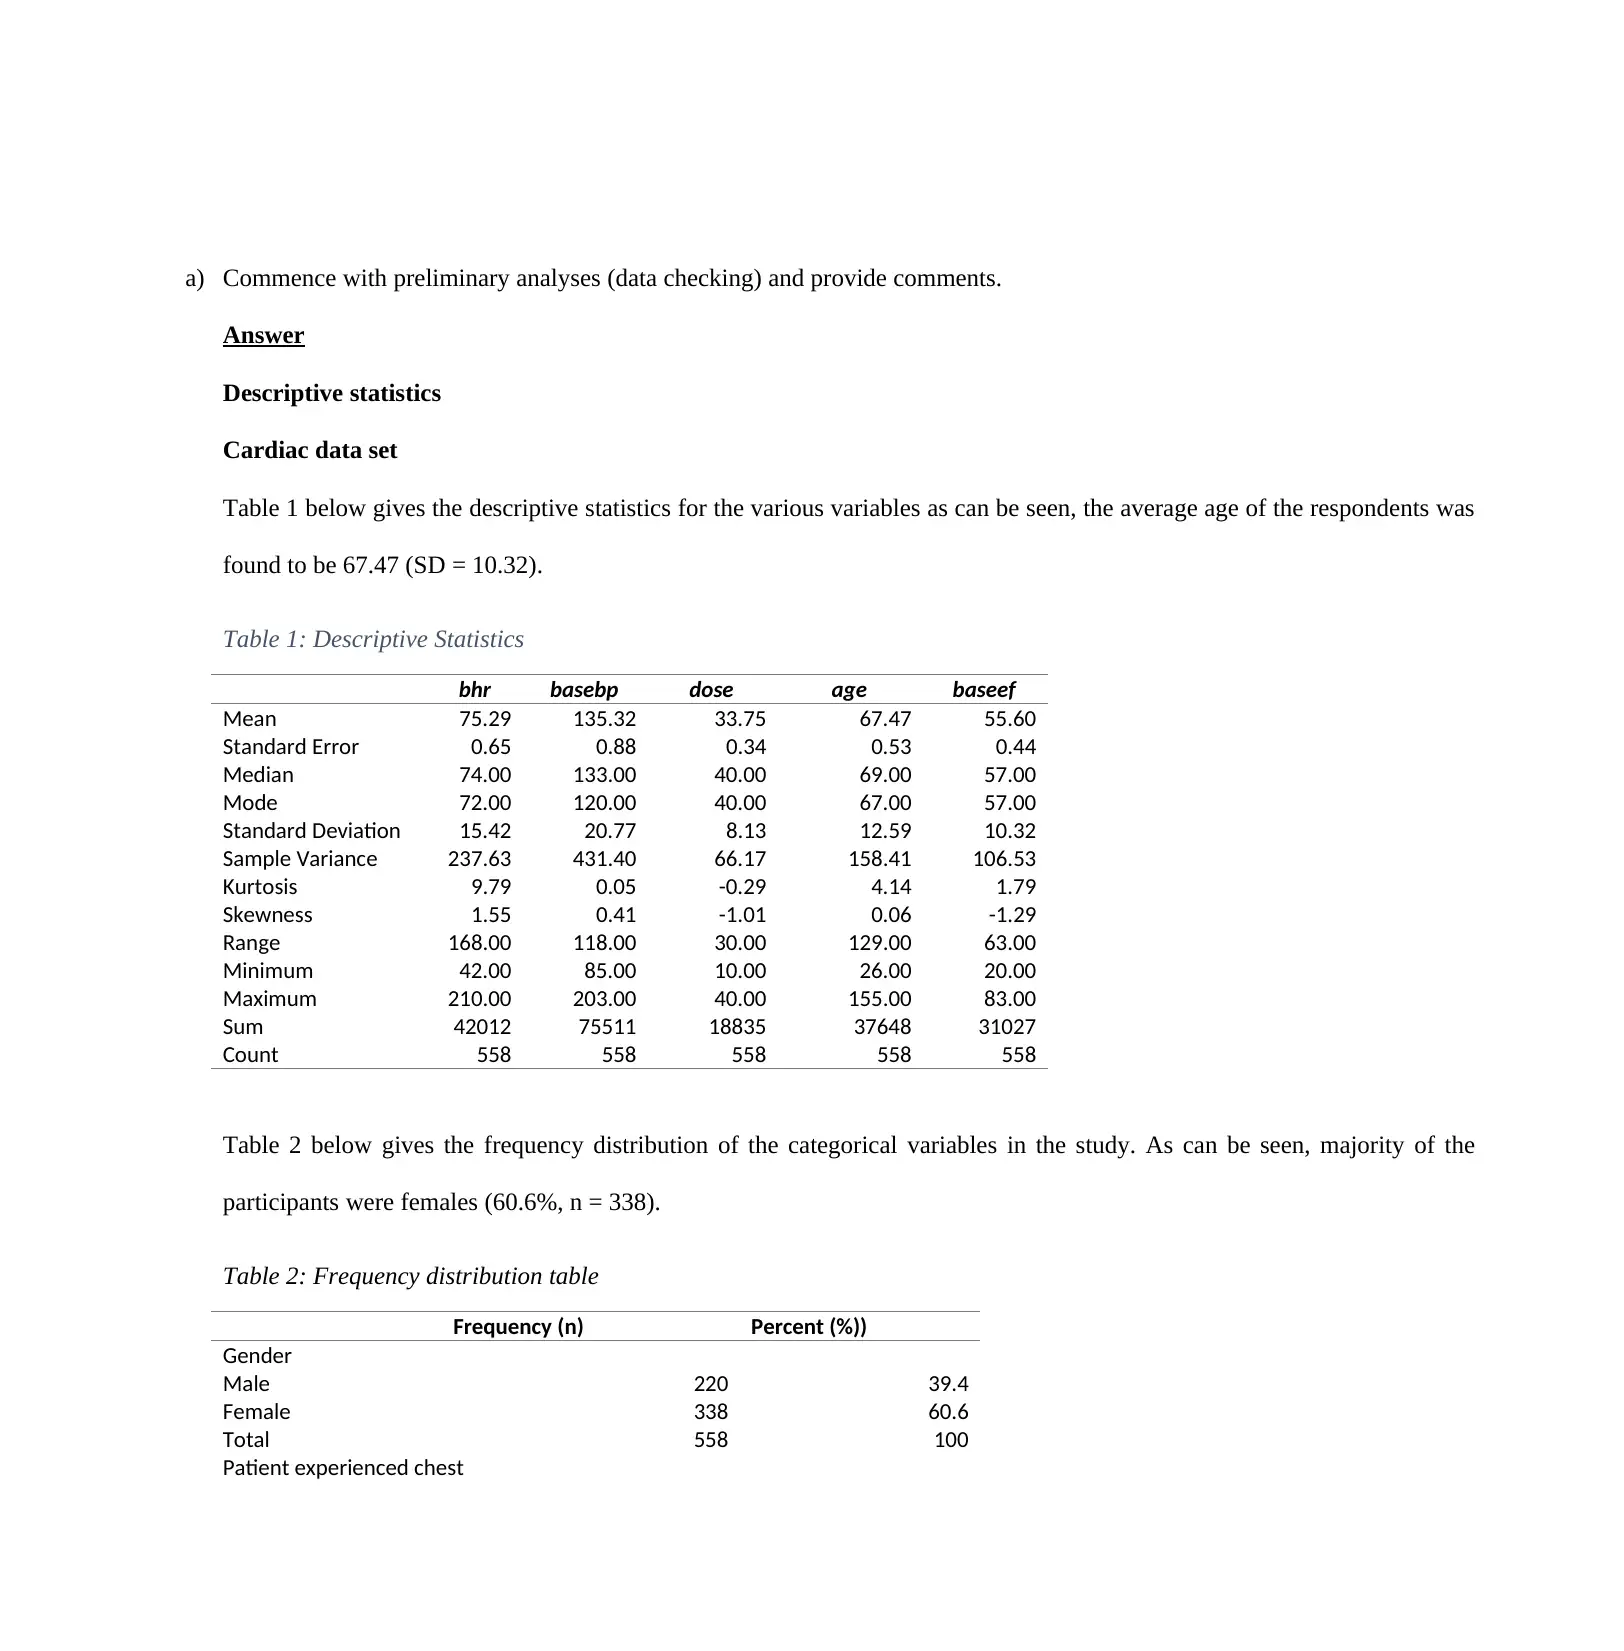
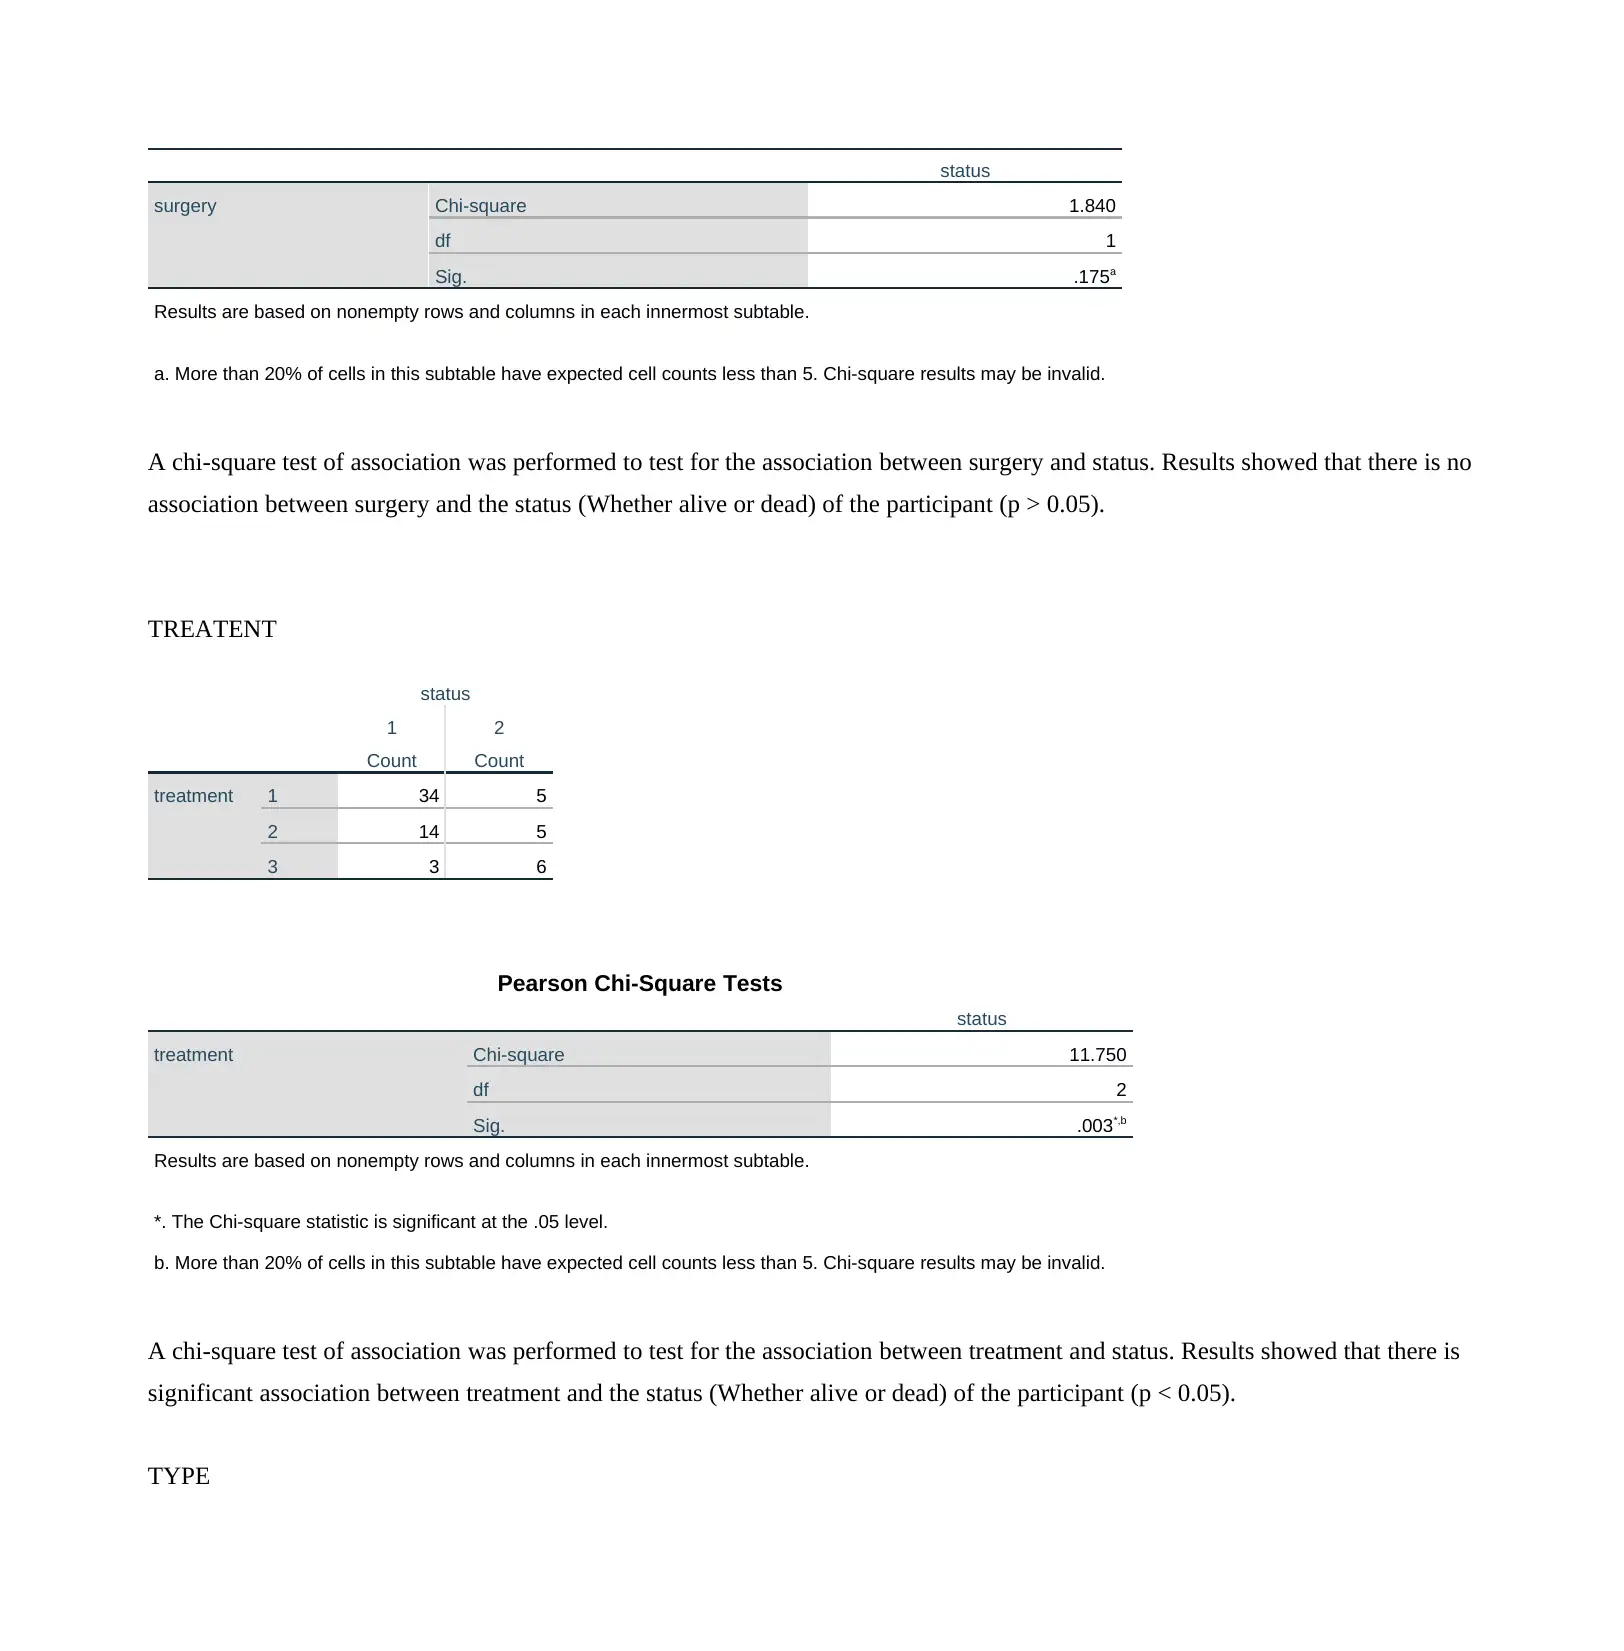
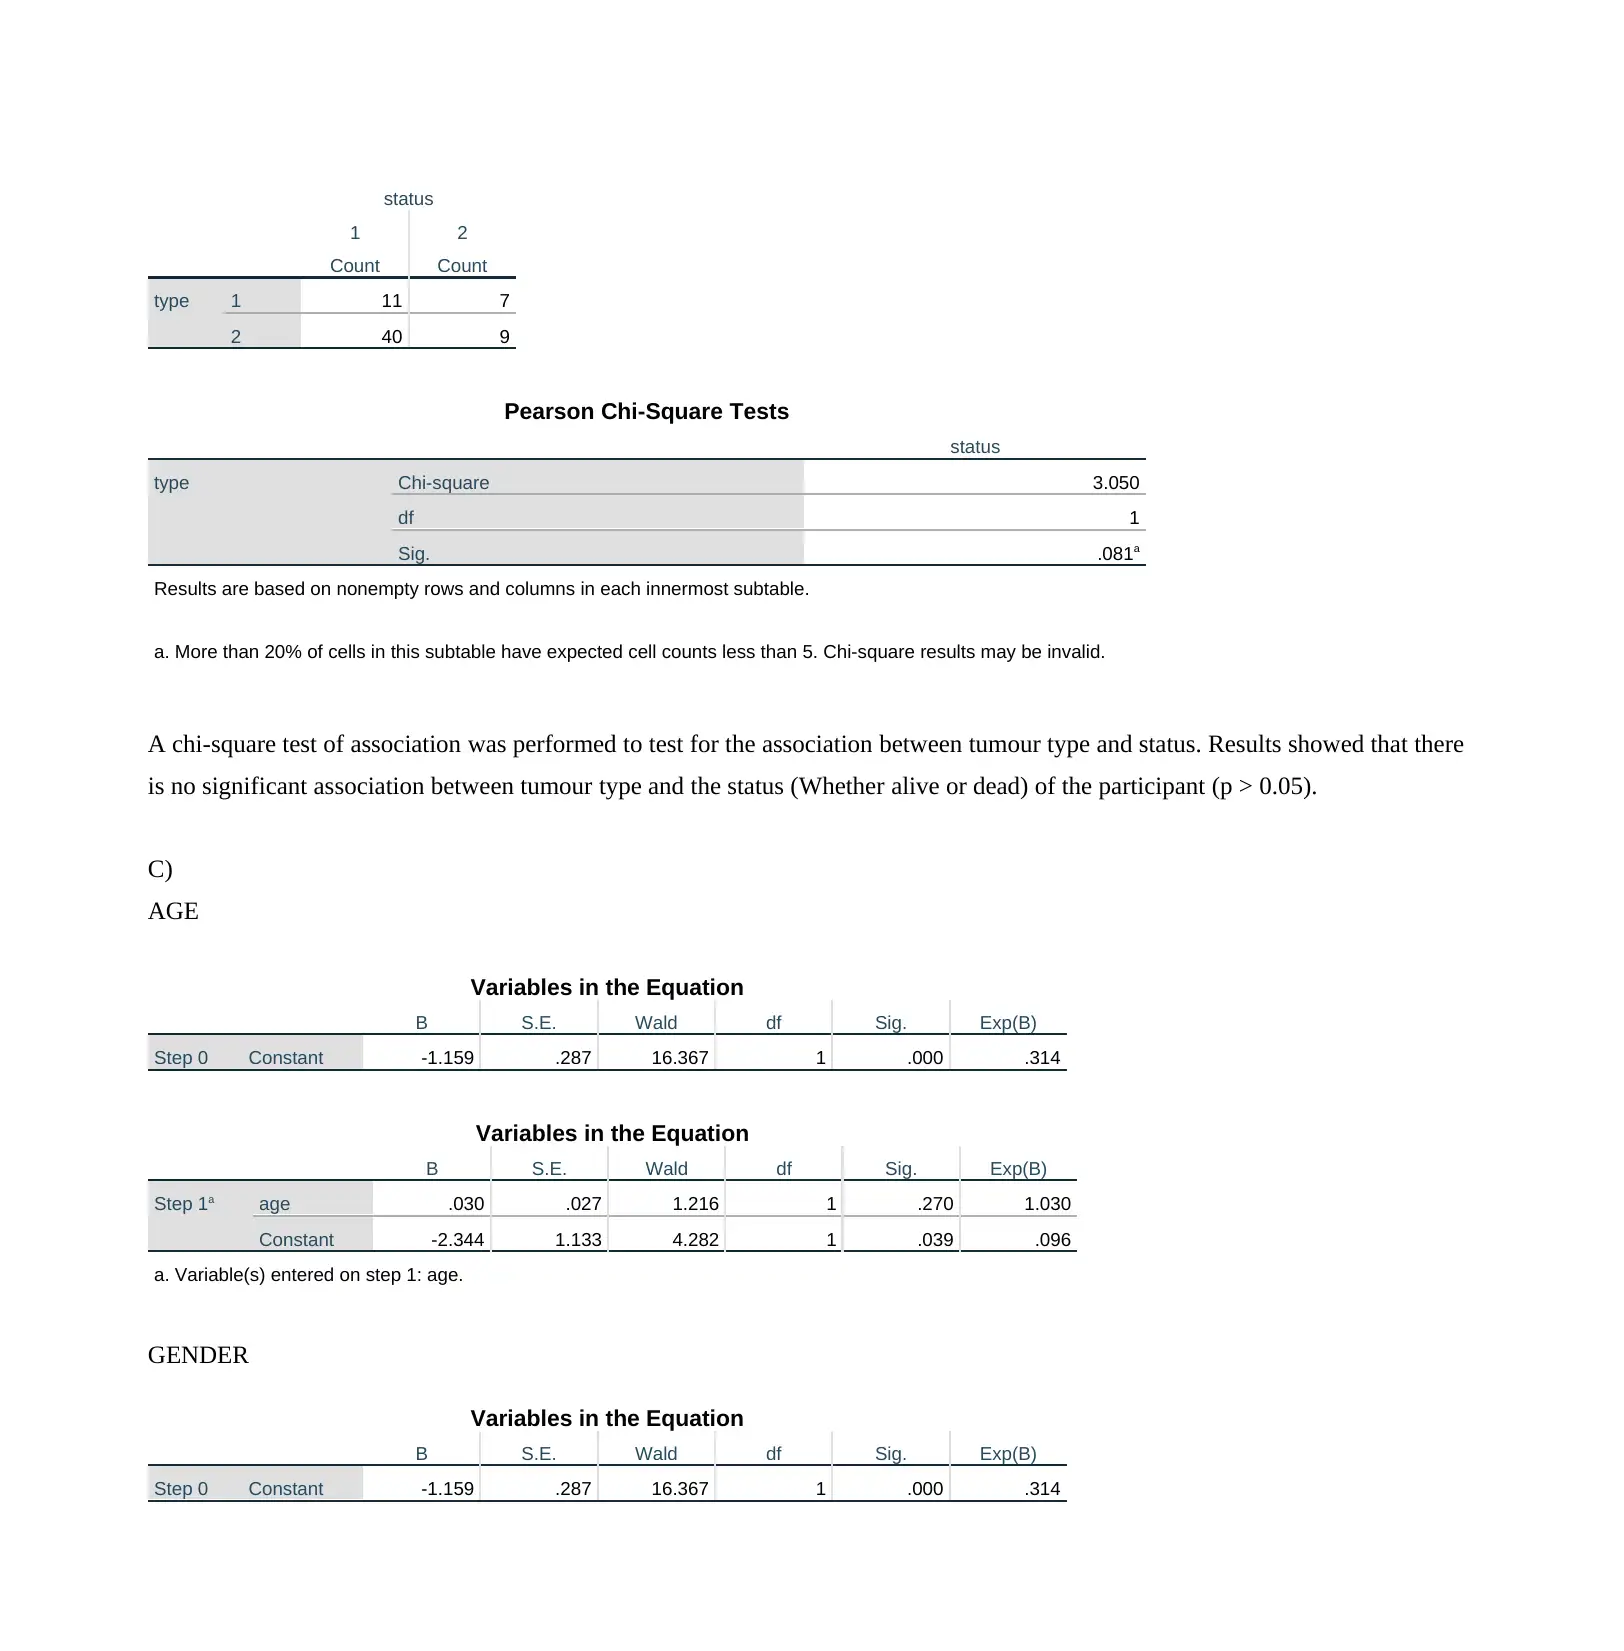
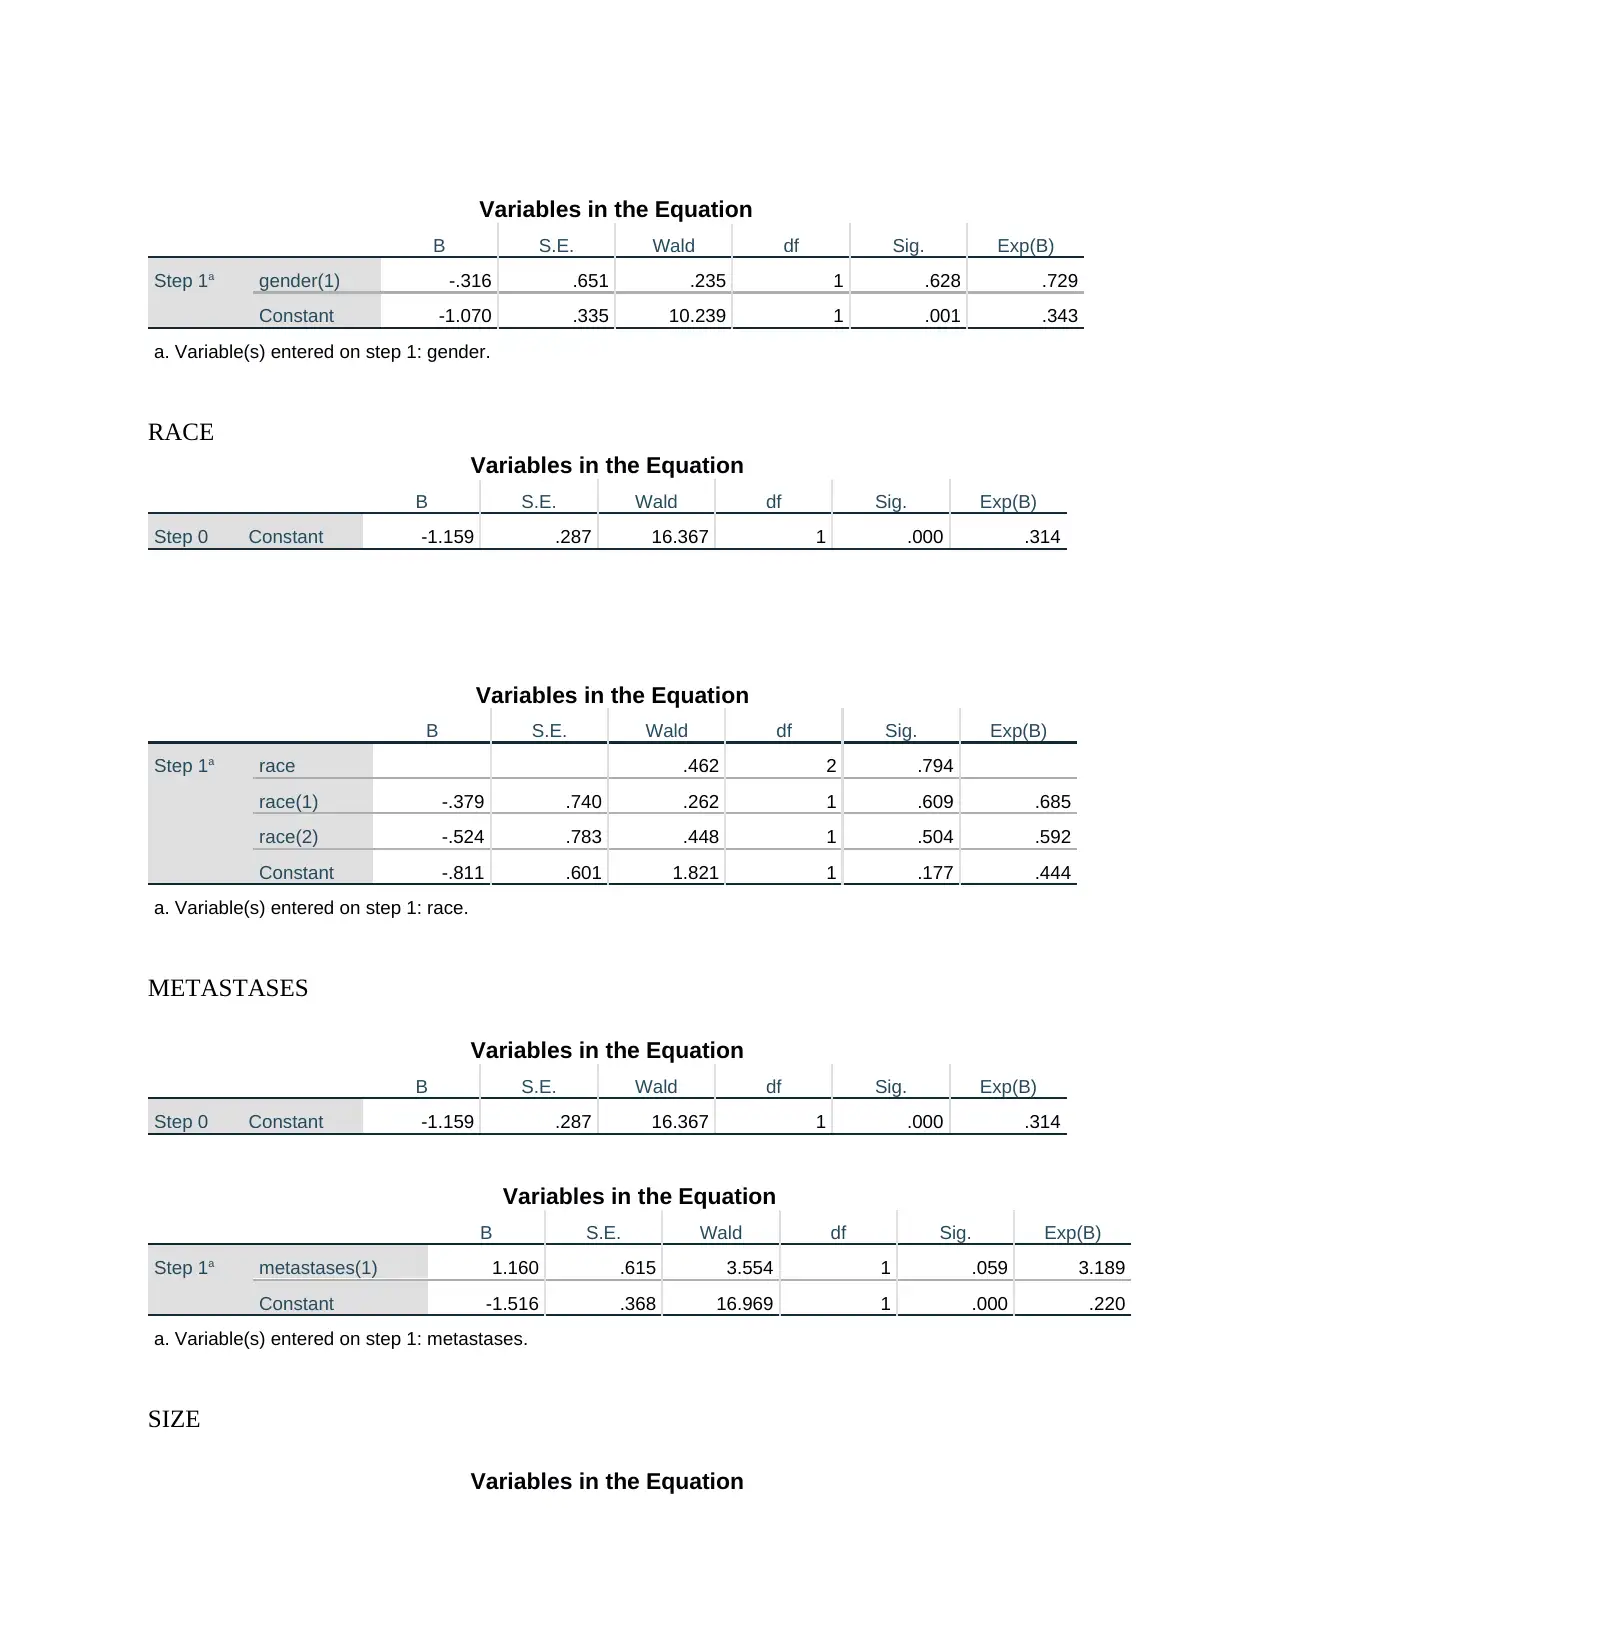
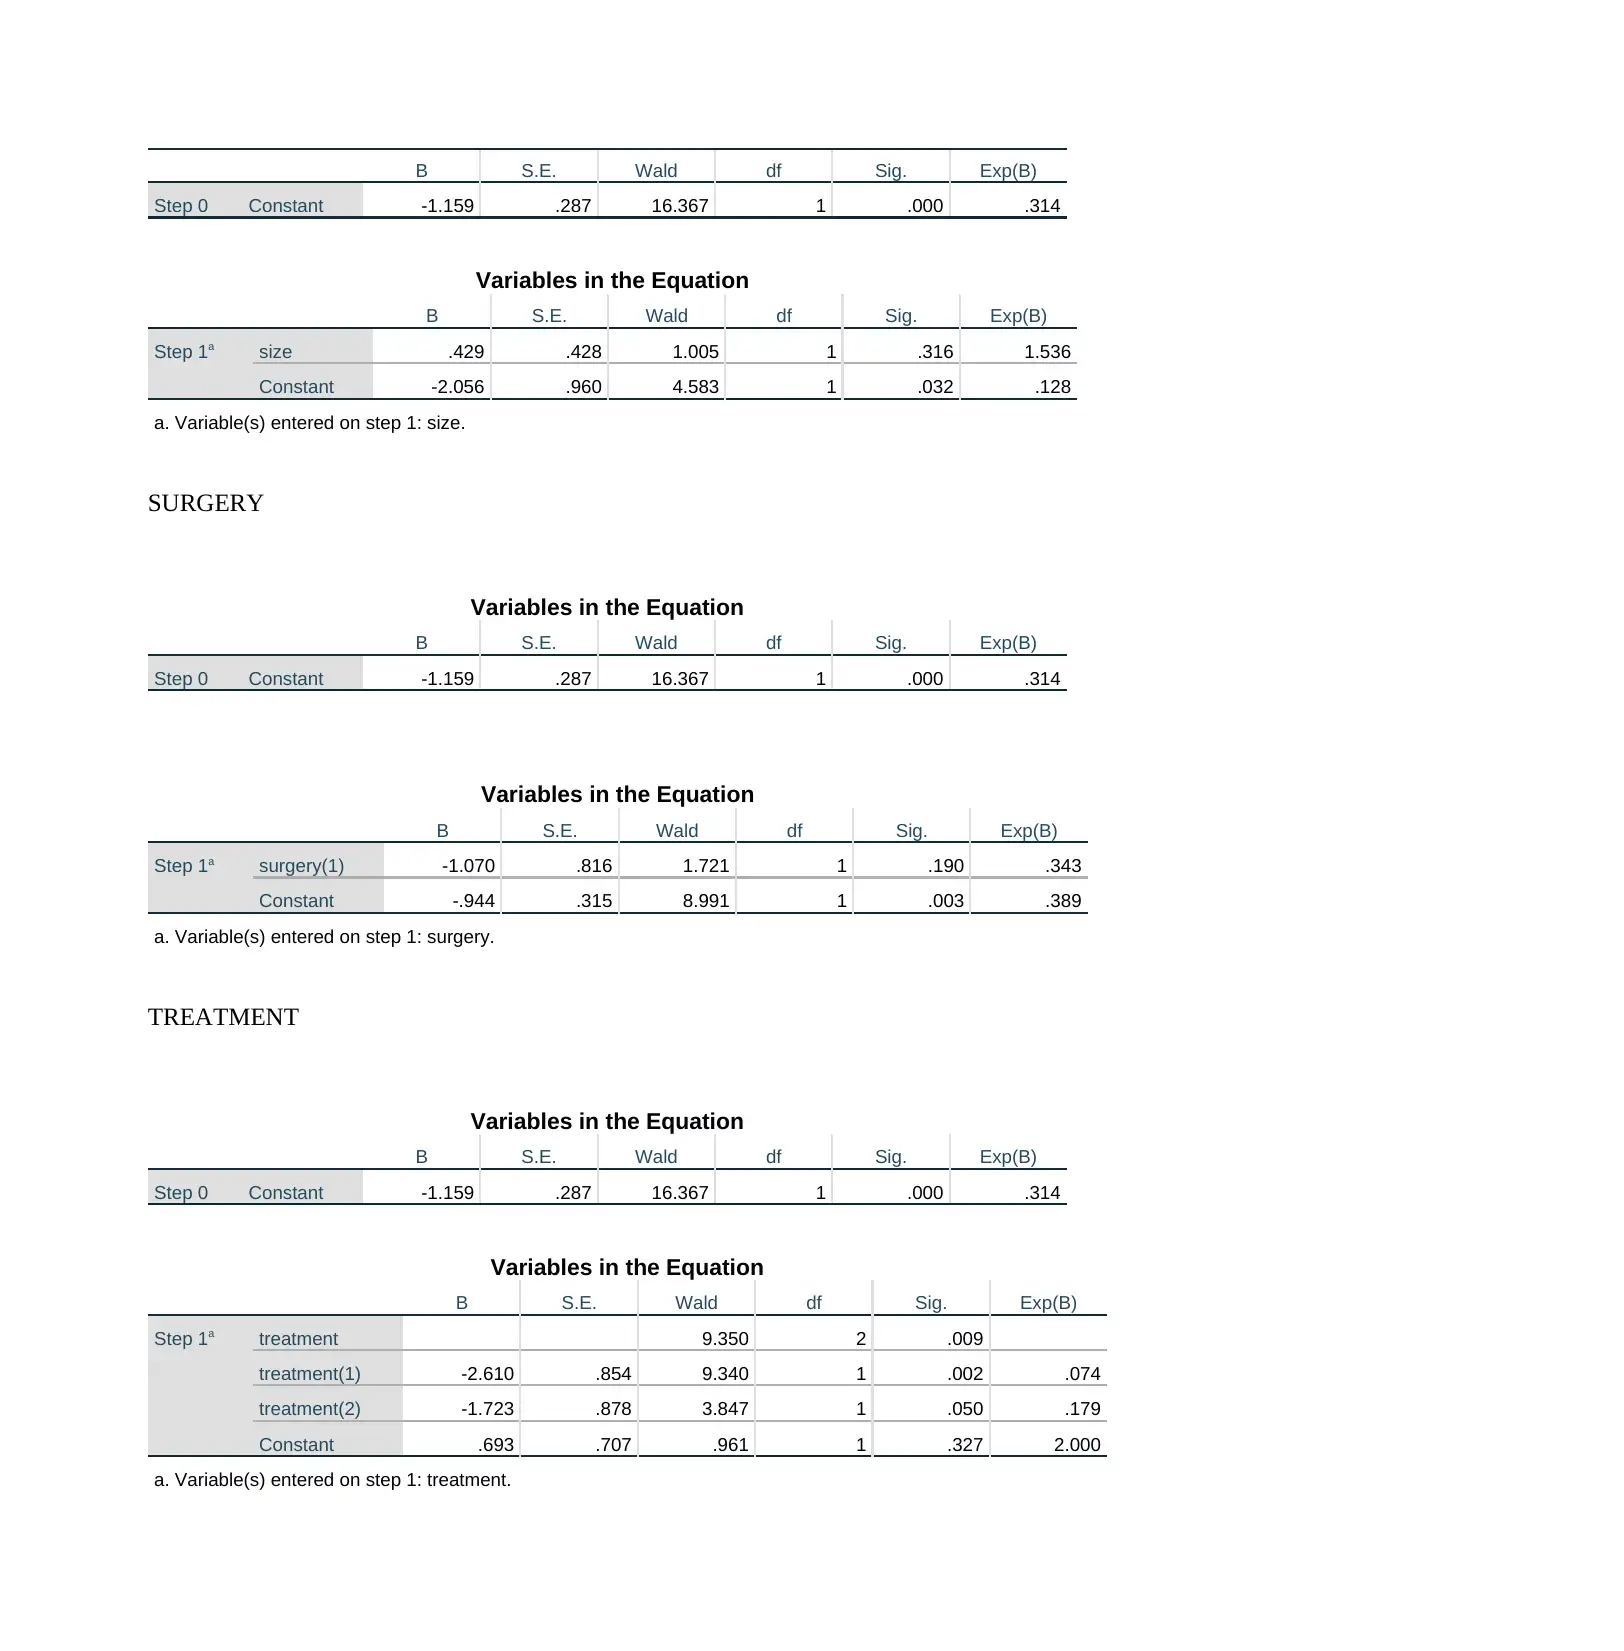
This assignment involves a comprehensive analysis of two datasets: a cardiac dataset and a thyroid dataset. The cardiac dataset explores the effectiveness of dobutamine in assessing heart attack risk, employing descriptive statistics, frequency distributions, and tests such as t-tests and chi-square tests to analyze various factors like age, gender, and medical history. The thyroid dataset focuses on patient characteristics and outcomes, using similar statistical techniques to examine factors related to tumor size, treatment, and survival status. The analysis includes descriptive statistics, t-tests, and logistic regression models to identify significant associations and predictors of outcomes, such as the impact of treatment on survival, providing insights into the relationships between various clinical variables and patient outcomes. The findings highlight the importance of specific factors like treatment and tumor type in predicting patient status. The analysis also includes the use of multiple regression models to predict survival status based on various factors.
Document Page
a) Commence with preliminary analyses (data checking) and provide comments.
Answer
Descriptive statistics
Cardiac data set
Table 1 below gives the descriptive statistics for the various variables as can be seen, the average age of the respondents was
found to be 67.47 (SD = 10.32).
Table 1: Descriptive Statistics
bhr basebp dose age baseef
Mean 75.29 135.32 33.75 67.47 55.60
Standard Error 0.65 0.88 0.34 0.53 0.44
Median 74.00 133.00 40.00 69.00 57.00
Mode 72.00 120.00 40.00 67.00 57.00
Standard Deviation 15.42 20.77 8.13 12.59 10.32
Sample Variance 237.63 431.40 66.17 158.41 106.53
Kurtosis 9.79 0.05 -0.29 4.14 1.79
Skewness 1.55 0.41 -1.01 0.06 -1.29
Range 168.00 118.00 30.00 129.00 63.00
Minimum 42.00 85.00 10.00 26.00 20.00
Maximum 210.00 203.00 40.00 155.00 83.00
Sum 42012 75511 18835 37648 31027
Count 558 558 558 558 558
Table 2 below gives the frequency distribution of the categorical variables in the study. As can be seen, majority of the
participants were females (60.6%, n = 338).
Table 2: Frequency distribution table
Frequency (n) Percent (%))
Gender
Male 220 39.4
Female 338 60.6
Total 558 100
Patient experienced chest
tabler-icon-diamond-filled.svg

Paraphrase This Document

Need a fresh take? Get an instant paraphrase of this document with our AI Paraphraser
Document Page
Yes 172 30.8
No 386 69.2
Total 558 100
Signs of heart attack on the ECG
Yes 71 12.7
No 487 87.3
Total 558 100
Stress Echocardiogram was positive
Yes 136 24.4
No 422 75.6
Total 558 100
Patient has a history of hypertension
Yes 393 70.4
No 165 29.6
Total 558 100
Patient has a history of diabetes
Yes 206 36.9
No 352 63.1
Total 558 100
Patient has a history of smoking
Yes 122 21.9
No 436 78.1
Total 558 100
Patient has a history of heart attack
Yes 154 27.6
No 404 72.4
Total 558 100
Patient has a history of angioplasty
Yes 41 7.3
No 517 92.7
Total 558 100
Patient has a history of bypass surgery
Yes 88 15.8
No 470 84.2
Total 558 100
The patient died
Yes 25 4.5
No 533 95.5
Total 558 100
Thyroid dataset
Document Page
The average age of the participants in this study was found to be 38.97 (SD = 10.48) with the average time being 41.60 (SD
= 16.78).
Table 3: Descriptive statistics
age time
Mean 38.97 41.60
Standard Error 1.28 2.05
Median 37.00 44.00
Mode 33.00 55.00
Standard Deviation 10.48 16.78
Sample Variance 109.91 281.70
Kurtosis 0.15 -0.58
Skewness 0.65 -0.73
Range 49.00 58.00
Minimum 19.00 2.00
Maximum 68.00 60.00
Sum 2611 2787
Count 67 67
For the frequencies, we found out that the female patients were the majority (70.1%, n = 29.9). In terms of race, majority
were the whites (44.8%, n = 30) followed by the Blacks (35.8%, n = 24) and lastly the Asians were represented by 19.4% (n
= 13).
Table 4: Frequency distribution
Frequency (n) Percent (%)
Patient Gender
Male 20 29.9
Female 47 70.1
Total 67 100.0
Patient Race
White 30 44.8
Black 24 35.8
Asian/other 13 19.4
Total 67 100.0
Presence of regional lymph node metastases at diagnosis
Yes 17 25.4
No 50 74.6
Total 67 100.0
Tumor Size
Document Page
< 1.5cm 14 20.9
1.5-4.4cm 37 55.2
>=4.5cm 16 23.9
Total 67 100.0
Surgery greater than lobectomy
Yes 17 25.4
No 50 74.6
Total 67 100.0
Time to treatment
< 4 months 39 58.2
4-8 months 19 28.4
>=8 months 9 13.4
Total 67 100.0
Five year survival status
Alive 51 76.1
Dead 16 23.9
Total 67 100.0
Tumor Type
Papillary 18 26.9
Follicular 49 73.1
Total 67 100.0
tabler-icon-diamond-filled.svg

Paraphrase This Document

Need a fresh take? Get an instant paraphrase of this document with our AI Paraphraser
Document Page
b) AGE
The above boxplot shows that the age distribution for the status (those alive and dead) are not normally distributed.
T-test
Group Statistics
status N Mean Std. Deviation Std. Error Mean
age 1 51 38.18 10.543 1.476
2 16 41.50 10.205 2.551
Independent Samples Test
Levene's Test for Equality of Variances t-test for Equality of Means
F Sig. t df Sig. (2-tailed) Mean Difference
Std. Error
Difference
age Equal variances assumed .008 .929 -1.108 65 .272 -3.324 2.999
Equal variances not assumed -1.128 25.858 .270 -3.324 2.947
Document Page
The results of the t-test for determining the average age difference between those alive and those dead shows that there is no
significant difference in the age of the two groups (p > 0.05). The average age for those alive was 38.18 (SD = 10.54) while the
average age for the dead was 41.50 (SD = 10.21).
GENDER
status
1 2
Count Count
gender 1 16 4
2 35 12
CHI-TEST
Pearson Chi-Square Tests
status
gender Chi-square .236
df 1
Sig. .627a
Results are based on nonempty rows and columns in each innermost subtable.
a. More than 20% of cells in this subtable have expected cell counts less than 5. Chi-square
results may be invalid.
A chi-square test of association was performed to test for the association between gender and status. Results showed that there is no
association between gender of the participant and the status (Whether alive or dead) of the participant (p > 0.05).
RACE
Variables in the Equation
B S.E. Wald df Sig. Exp(B)
Step 1a race .149 .373 .159 1 .690 1.161
Constant -1.423 .727 3.825 1 .050 .241
a. Variable(s) entered on step 1: race.
Document Page
METASTASES
status
1 2
Count Count
metastases 1 10 7
2 41 9
Pearson Chi-Square Tests
status
metastases Chi-square 3.749
df 1
Sig. .053a
Results are based on nonempty rows and columns in each innermost subtable.
a. More than 20% of cells in this subtable have expected cell counts less than 5. Chi-square results may be invalid.
A chi-square test of association was performed to test for the association between presence of metastases and status. Results showed
that there is no association between presence of metastases and the status (Whether alive or dead) of the participant (p > 0.05).
SIZE
tabler-icon-diamond-filled.svg

Paraphrase This Document

Need a fresh take? Get an instant paraphrase of this document with our AI Paraphraser
Document Page
T-Test
Variables in the Equation
B S.E. Wald df Sig. Exp(B)
Step 1a size 2.547 3 .467
size(1) 19.904 40192.486 .000 1 1.000 440580337.853
size(2) 19.748 40192.486 .000 1 1.000 376940955.718
size(3) 20.797 40192.486 .000 1 1.000 1076974159.195
Constant -21.203 40192.486 .000 1 1.000 .000
a. Variable(s) entered on step 1: size.
SURGERY
status
1 2
Count Count
surgery 1 15 2
2 36 14
Pearson Chi-Square Tests
Document Page
status
surgery Chi-square 1.840
df 1
Sig. .175a
Results are based on nonempty rows and columns in each innermost subtable.
a. More than 20% of cells in this subtable have expected cell counts less than 5. Chi-square results may be invalid.
A chi-square test of association was performed to test for the association between surgery and status. Results showed that there is no
association between surgery and the status (Whether alive or dead) of the participant (p > 0.05).
TREATENT
status
1 2
Count Count
treatment 1 34 5
2 14 5
3 3 6
Pearson Chi-Square Tests
status
treatment Chi-square 11.750
df 2
Sig. .003*,b
Results are based on nonempty rows and columns in each innermost subtable.
*. The Chi-square statistic is significant at the .05 level.
b. More than 20% of cells in this subtable have expected cell counts less than 5. Chi-square results may be invalid.
A chi-square test of association was performed to test for the association between treatment and status. Results showed that there is
significant association between treatment and the status (Whether alive or dead) of the participant (p < 0.05).
TYPE
Document Page
status
1 2
Count Count
type 1 11 7
2 40 9
Pearson Chi-Square Tests
status
type Chi-square 3.050
df 1
Sig. .081a
Results are based on nonempty rows and columns in each innermost subtable.
a. More than 20% of cells in this subtable have expected cell counts less than 5. Chi-square results may be invalid.
A chi-square test of association was performed to test for the association between tumour type and status. Results showed that there
is no significant association between tumour type and the status (Whether alive or dead) of the participant (p > 0.05).
C)
AGE
Variables in the Equation
B S.E. Wald df Sig. Exp(B)
Step 0 Constant -1.159 .287 16.367 1 .000 .314
Variables in the Equation
B S.E. Wald df Sig. Exp(B)
Step 1a age .030 .027 1.216 1 .270 1.030
Constant -2.344 1.133 4.282 1 .039 .096
a. Variable(s) entered on step 1: age.
GENDER
Variables in the Equation
B S.E. Wald df Sig. Exp(B)
Step 0 Constant -1.159 .287 16.367 1 .000 .314
tabler-icon-diamond-filled.svg

Paraphrase This Document

Need a fresh take? Get an instant paraphrase of this document with our AI Paraphraser
Document Page
Variables in the Equation
B S.E. Wald df Sig. Exp(B)
Step 1a gender(1) -.316 .651 .235 1 .628 .729
Constant -1.070 .335 10.239 1 .001 .343
a. Variable(s) entered on step 1: gender.
RACE
Variables in the Equation
B S.E. Wald df Sig. Exp(B)
Step 0 Constant -1.159 .287 16.367 1 .000 .314
Variables in the Equation
B S.E. Wald df Sig. Exp(B)
Step 1a race .462 2 .794
race(1) -.379 .740 .262 1 .609 .685
race(2) -.524 .783 .448 1 .504 .592
Constant -.811 .601 1.821 1 .177 .444
a. Variable(s) entered on step 1: race.
METASTASES
Variables in the Equation
B S.E. Wald df Sig. Exp(B)
Step 0 Constant -1.159 .287 16.367 1 .000 .314
Variables in the Equation
B S.E. Wald df Sig. Exp(B)
Step 1a metastases(1) 1.160 .615 3.554 1 .059 3.189
Constant -1.516 .368 16.969 1 .000 .220
a. Variable(s) entered on step 1: metastases.
SIZE
Variables in the Equation
Document Page
B S.E. Wald df Sig. Exp(B)
Step 0 Constant -1.159 .287 16.367 1 .000 .314
Variables in the Equation
B S.E. Wald df Sig. Exp(B)
Step 1a size .429 .428 1.005 1 .316 1.536
Constant -2.056 .960 4.583 1 .032 .128
a. Variable(s) entered on step 1: size.
SURGERY
Variables in the Equation
B S.E. Wald df Sig. Exp(B)
Step 0 Constant -1.159 .287 16.367 1 .000 .314
Variables in the Equation
B S.E. Wald df Sig. Exp(B)
Step 1a surgery(1) -1.070 .816 1.721 1 .190 .343
Constant -.944 .315 8.991 1 .003 .389
a. Variable(s) entered on step 1: surgery.
TREATMENT
Variables in the Equation
B S.E. Wald df Sig. Exp(B)
Step 0 Constant -1.159 .287 16.367 1 .000 .314
Variables in the Equation
B S.E. Wald df Sig. Exp(B)
Step 1a treatment 9.350 2 .009
treatment(1) -2.610 .854 9.340 1 .002 .074
treatment(2) -1.723 .878 3.847 1 .050 .179
Constant .693 .707 .961 1 .327 2.000
a. Variable(s) entered on step 1: treatment.
chevron_up_icon
1 out of 32
circle_padding
hide_on_mobile
zoom_out_icon
[object Object]