BS2SX2 - Treforest Transport: Cardiff Car Sales Analysis Report
VerifiedAdded on 2022/09/02
|22
|3726
|23
Report
AI Summary
This case study examines the passenger car sales performance of Treforest Transport in Cardiff, with a focus on revenue analysis and strategic planning for expansion into Belfast. The report employs a quantitative exploratory approach, analyzing primary data on customer demographics, car preferences, and travel patterns. It also includes an analysis of regional industry trends and a comparative analysis between Cardiff and Belfast, with findings suggesting that higher-income males and married customers prefer Sports and Estate variants, while lower-income females and singles favor Hatchback and City cars. The study assesses financial performance, tests hypotheses regarding average sales revenue, and proposes marketing strategies. Key findings highlight the importance of factors like licensed car registrations and customer demographics in influencing car sales, and that the sports and estate variant of cars are noted to be the best two possible models for sales to new customers.

1
A Case Study on Passenger Cars of Treforest Transport in Cardiff
A Case Study on Passenger Cars of Treforest Transport in Cardiff
Paraphrase This Document
Need a fresh take? Get an instant paraphrase of this document with our AI Paraphraser
2
Executive Summary
This case study provides analysis of the self-assessment of revenues and future strategic plan
for sales of passenger cars of Treforest Transport to setup business in Northern Island city of
Belfast. The report has profound marketing implications, as it investigates and addresses
customers’ preference centred on evidence-based decision making. A quantitative exploratory
approach was adopted for this study. Research was conducted using primary data collected on
income of customers; types of car, distance covered, and job status along with some
demographic properties of customers in Cardiff. Annual car sales data from Great Britain
region was analysed to find that a significantly strong relation existed between sale of cars
and number of licensed cars in that area. Comparative investigation was done between key
findings from Belfast and Cardiff car sales. Key findings conclude that: Higher income
group, males, and married customers preferred Sports and Estate variants. Hatchback and city
cars are favoured by lower income group, females, singles, and students. A strong relation
between number of licensed cars and number of cars sold is also noted, implying that any
government policy of increasing number of licensed cars will improve car sales. Belfast and
Cardiff customers’ preference of car variants (sports) is found to be same corresponding to
age group of 30-39 years, but no such result is obtained in case of gender wise usage of city
cars. Average revenue for car sales in Cardiff is found to be significantly behind other
regional offices in GB. Finally, sports and estate variant of cars are noted to be the best two
possible models for sales to new customers.
3
Table of Contents
Executive Summary...................................................................................................................2
Introduction................................................................................................................................5
Company Overview...................................................................................................................5
1. Customer Analysis.................................................................................................................6
Customers and their preferred car types..........................................................................6
Travelling patterns based on average traveling distance and preferred cars.................10
2. Regional Industry Analysis..................................................................................................12
3. Comparative Analysis..........................................................................................................14
Age comparison of Hatchback Customers....................................................................14
Gender wise comparison for City Cars buyers.............................................................14
Income groups by Car types..........................................................................................15
4. Financial Assessment and Marketing Plan..........................................................................16
Monthly Sales Revenue Calculation.............................................................................16
Hypothesis testing for average sales revenue in Cardiff...............................................17
Marketing strategy of new cars.....................................................................................18
Conclusion................................................................................................................................19
Recommendation......................................................................................................................20
References................................................................................................................................21
Table of Figures
⊘ This is a preview!⊘
Do you want full access?
Subscribe today to unlock all pages.
Trusted by 1+ million students worldwide
4
Figure 1: Distribution of age of customers................................................................................6
Figure 2: Gender percentage in customers’ data for Cardiff......................................................7
Figure 3: Distribution of income of customers..........................................................................7
Figure 4: Average income by gender in Cardiff customer sales data........................................8
Figure 5: Car type usage by two gender.....................................................................................8
Figure 6: Car type usage by marital status.................................................................................9
Figure 7: Car type usage by job type of customers....................................................................9
Figure 8: Distribution of driving years for the Cardiff customers...........................................10
Figure 9: Distribution of the distance covered by the cars.......................................................11
Figure 10: Side-by-side boxplot for distance travelled by car types........................................11
Figure 11: Scatterplot for correlation between car sales and number of licensed registered
cars...........................................................................................................................................12
Figure 12: Scatterplot for correlation between car sales and population.................................13
Figure 13: Scatterplot for correlation between car sales and GVA.........................................13
Figure 14: Car type by age groups of Cardiff customers.........................................................14
Figure 15: Car type by gender for Cardiff customers..............................................................14
Figure 16: Car type usage by Income groups of less than and greater than 50k......................15
Figure 17: Car type usage by marital status in Cardiff............................................................16
Figure 18: Monthly number of car sales by car types..............................................................16
Figure 19: Monthly sales revenue of Cardiff sales by car type................................................17
Figure 20: Pareto Analysis of Car Sales by numbers in Cardiff..............................................18
Figure 21: Pareto Analysis of Car Sales by revenue in Cardiff...............................................18
Paraphrase This Document
Need a fresh take? Get an instant paraphrase of this document with our AI Paraphraser
5
Introduction
There is no doubt that the automotive industry will continue to have a significant impact on
the world economy (Kumaraswamy et. al., 2012, pp.368-395). It has always been a
fundamental quest that tries to understand the structure of the automotive industry (Jacobides,
MacDuffie, and Tae, 2016, pp.1942-1967). The study focused on Treforest transport
performance in the passenger car sector in Cardiff. The aim is to identify a number of
strategies on which this decision is based and which will enable the company to gain in the
Northern Ireland market, particularly in the highly competitive market in Belfast.
This research uses knowledge from previous literatures on case studies with the empirical
data to look at the details of automobile market within the paradigm (Blankesteijn, Jong, and
Bossink, 2019, pp.74-103). Decision is based on revenue generation, customer preference of
cars with driving distance, and demographic information of customers in Cardiff. Regional
car sales data annual data of Great Britain was assessed for scrutinizing the relationship
between sales and population, GVA, and number of licensed cars. Comparative analysis of
customers’ preference between Cardiff and Belfast was also conducted. Finally, an inferential
analysis is accomplished with monthly average revenue earned from sales of cars in Cardiff
and other regional offices of the company. Decision based analysis with 80-20 rule is also
implemented for finding out the most profitable car that can be marketed to future customers
(Banduka et. al., 2016, pp.487-493).
Company Overview
Treforest Transport is a global enterprise that designs, manufactures and markets passenger
cars (City Cars, Estates, Hatchbacks, Saloons, Sports, and SUVs) across Great Britain and
European countries. At present, the company is interested in expanding its business to
Northern Ireland, and is looking forward to opening an outlet in Belfast. Consequently,
6
Treforest Transport is interested in summarising its performance in Cardiff centred on
relation between annual sales figure and regional population, licenced cars registered, and
GVA in £million. Simultaneously, the sales results of Cardiff have been compared with other
regional offices to assess the performance of the regional office.
1. Customer Analysis
Customers and their preferred car types
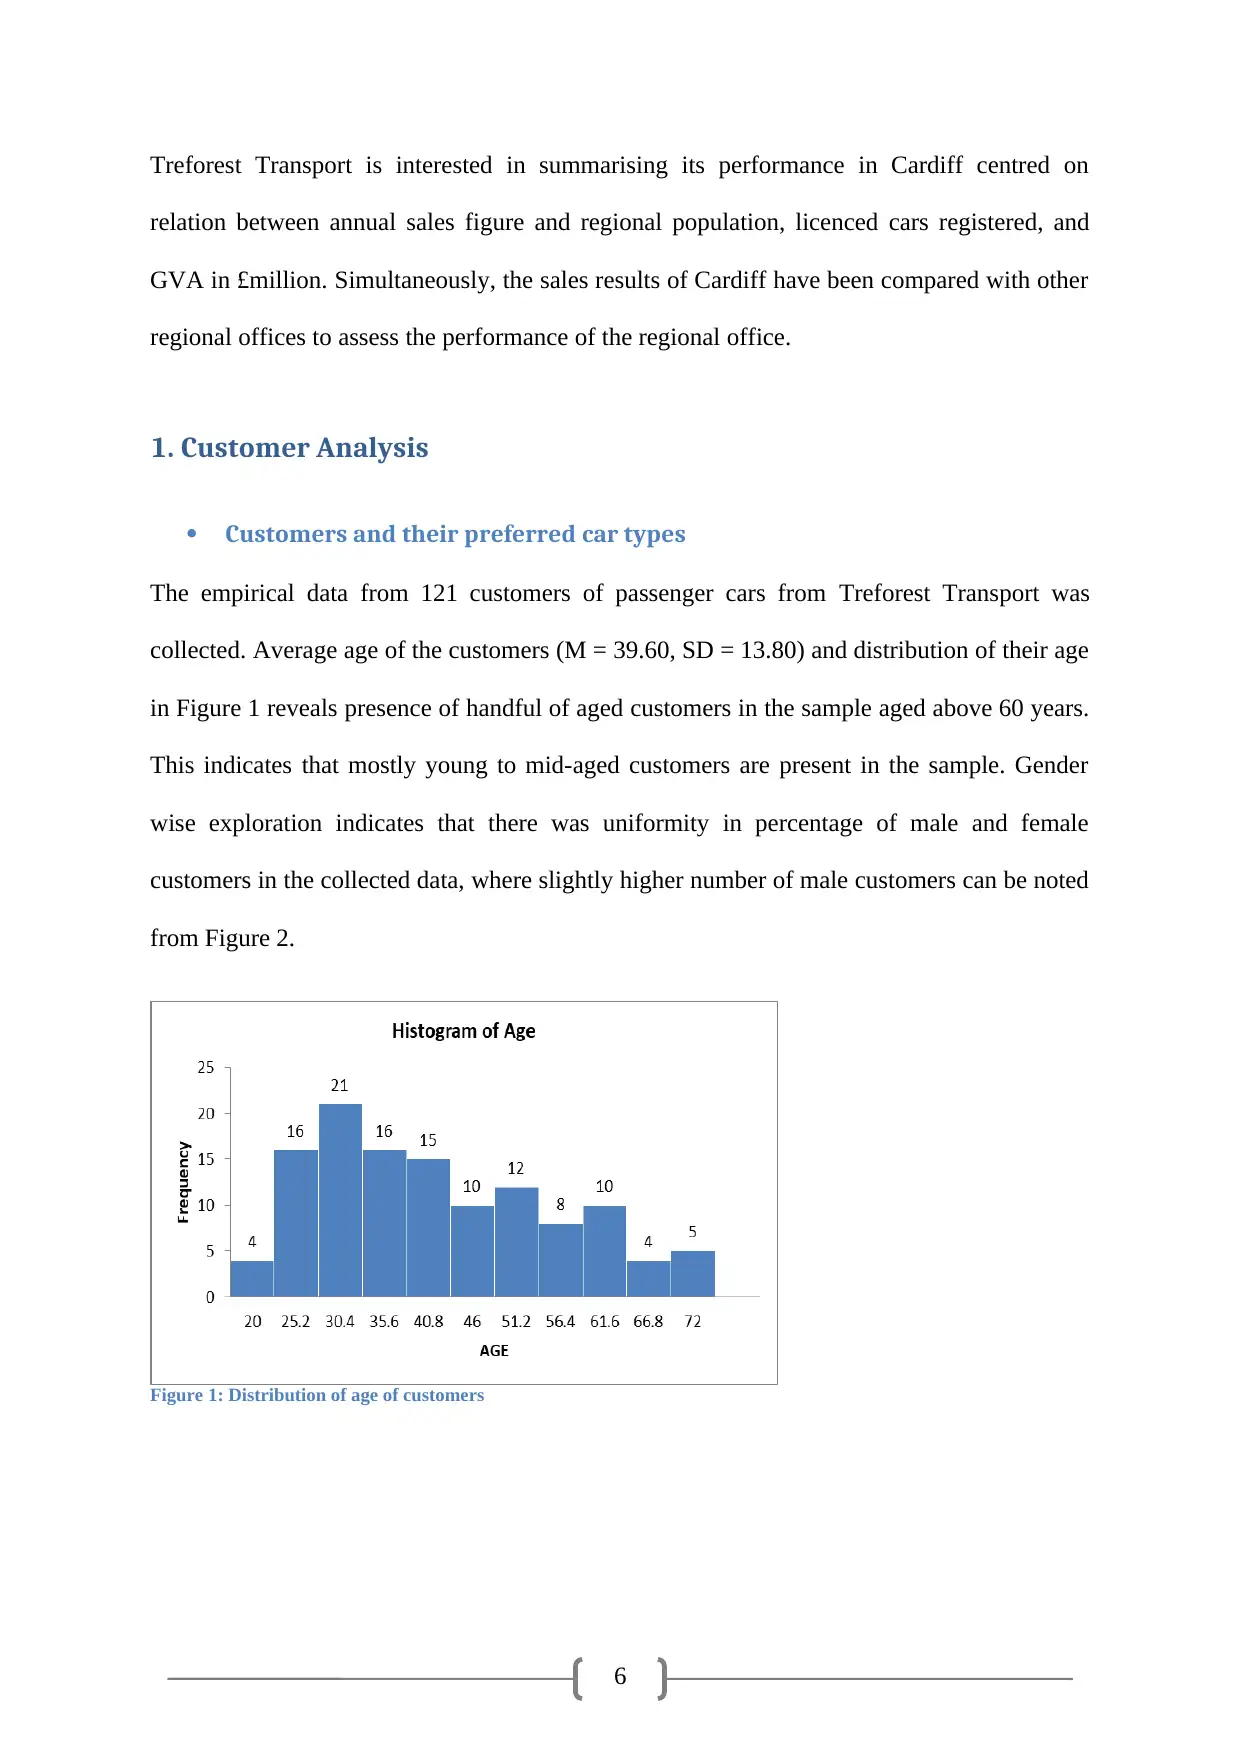
The empirical data from 121 customers of passenger cars from Treforest Transport was
collected. Average age of the customers (M = 39.60, SD = 13.80) and distribution of their age
in Figure 1 reveals presence of handful of aged customers in the sample aged above 60 years.
This indicates that mostly young to mid-aged customers are present in the sample. Gender
wise exploration indicates that there was uniformity in percentage of male and female
customers in the collected data, where slightly higher number of male customers can be noted
from Figure 2.
Figure 1: Distribution of age of customers
Treforest Transport is interested in summarising its performance in Cardiff centred on
relation between annual sales figure and regional population, licenced cars registered, and
GVA in £million. Simultaneously, the sales results of Cardiff have been compared with other
regional offices to assess the performance of the regional office.
1. Customer Analysis
Customers and their preferred car types
The empirical data from 121 customers of passenger cars from Treforest Transport was
collected. Average age of the customers (M = 39.60, SD = 13.80) and distribution of their age
in Figure 1 reveals presence of handful of aged customers in the sample aged above 60 years.
This indicates that mostly young to mid-aged customers are present in the sample. Gender
wise exploration indicates that there was uniformity in percentage of male and female
customers in the collected data, where slightly higher number of male customers can be noted
from Figure 2.
Figure 1: Distribution of age of customers
⊘ This is a preview!⊘
Do you want full access?
Subscribe today to unlock all pages.
Trusted by 1+ million students worldwide
7
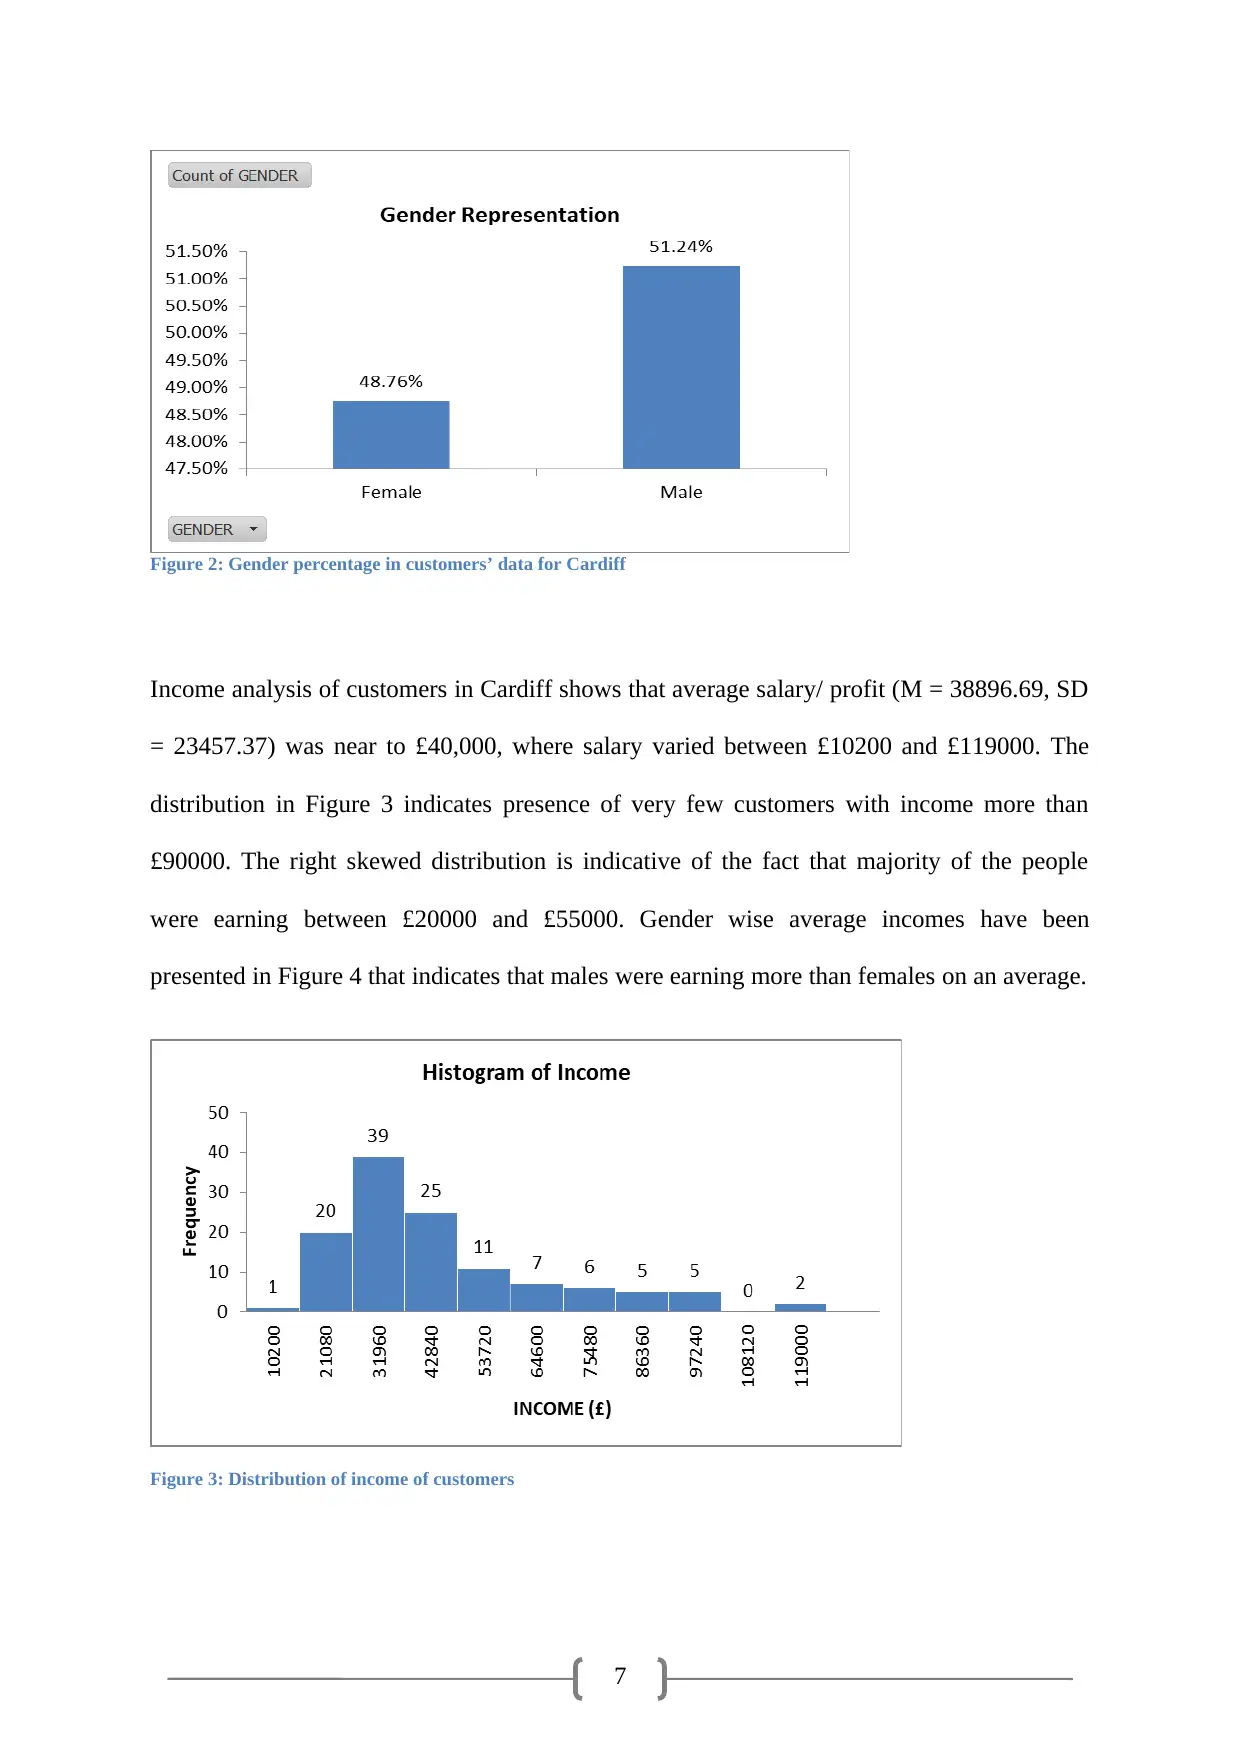
Figure 2: Gender percentage in customers’ data for Cardiff
Income analysis of customers in Cardiff shows that average salary/ profit (M = 38896.69, SD
= 23457.37) was near to £40,000, where salary varied between £10200 and £119000. The
distribution in Figure 3 indicates presence of very few customers with income more than
£90000. The right skewed distribution is indicative of the fact that majority of the people
were earning between £20000 and £55000. Gender wise average incomes have been
presented in Figure 4 that indicates that males were earning more than females on an average.
Figure 3: Distribution of income of customers
Paraphrase This Document
Need a fresh take? Get an instant paraphrase of this document with our AI Paraphraser
8
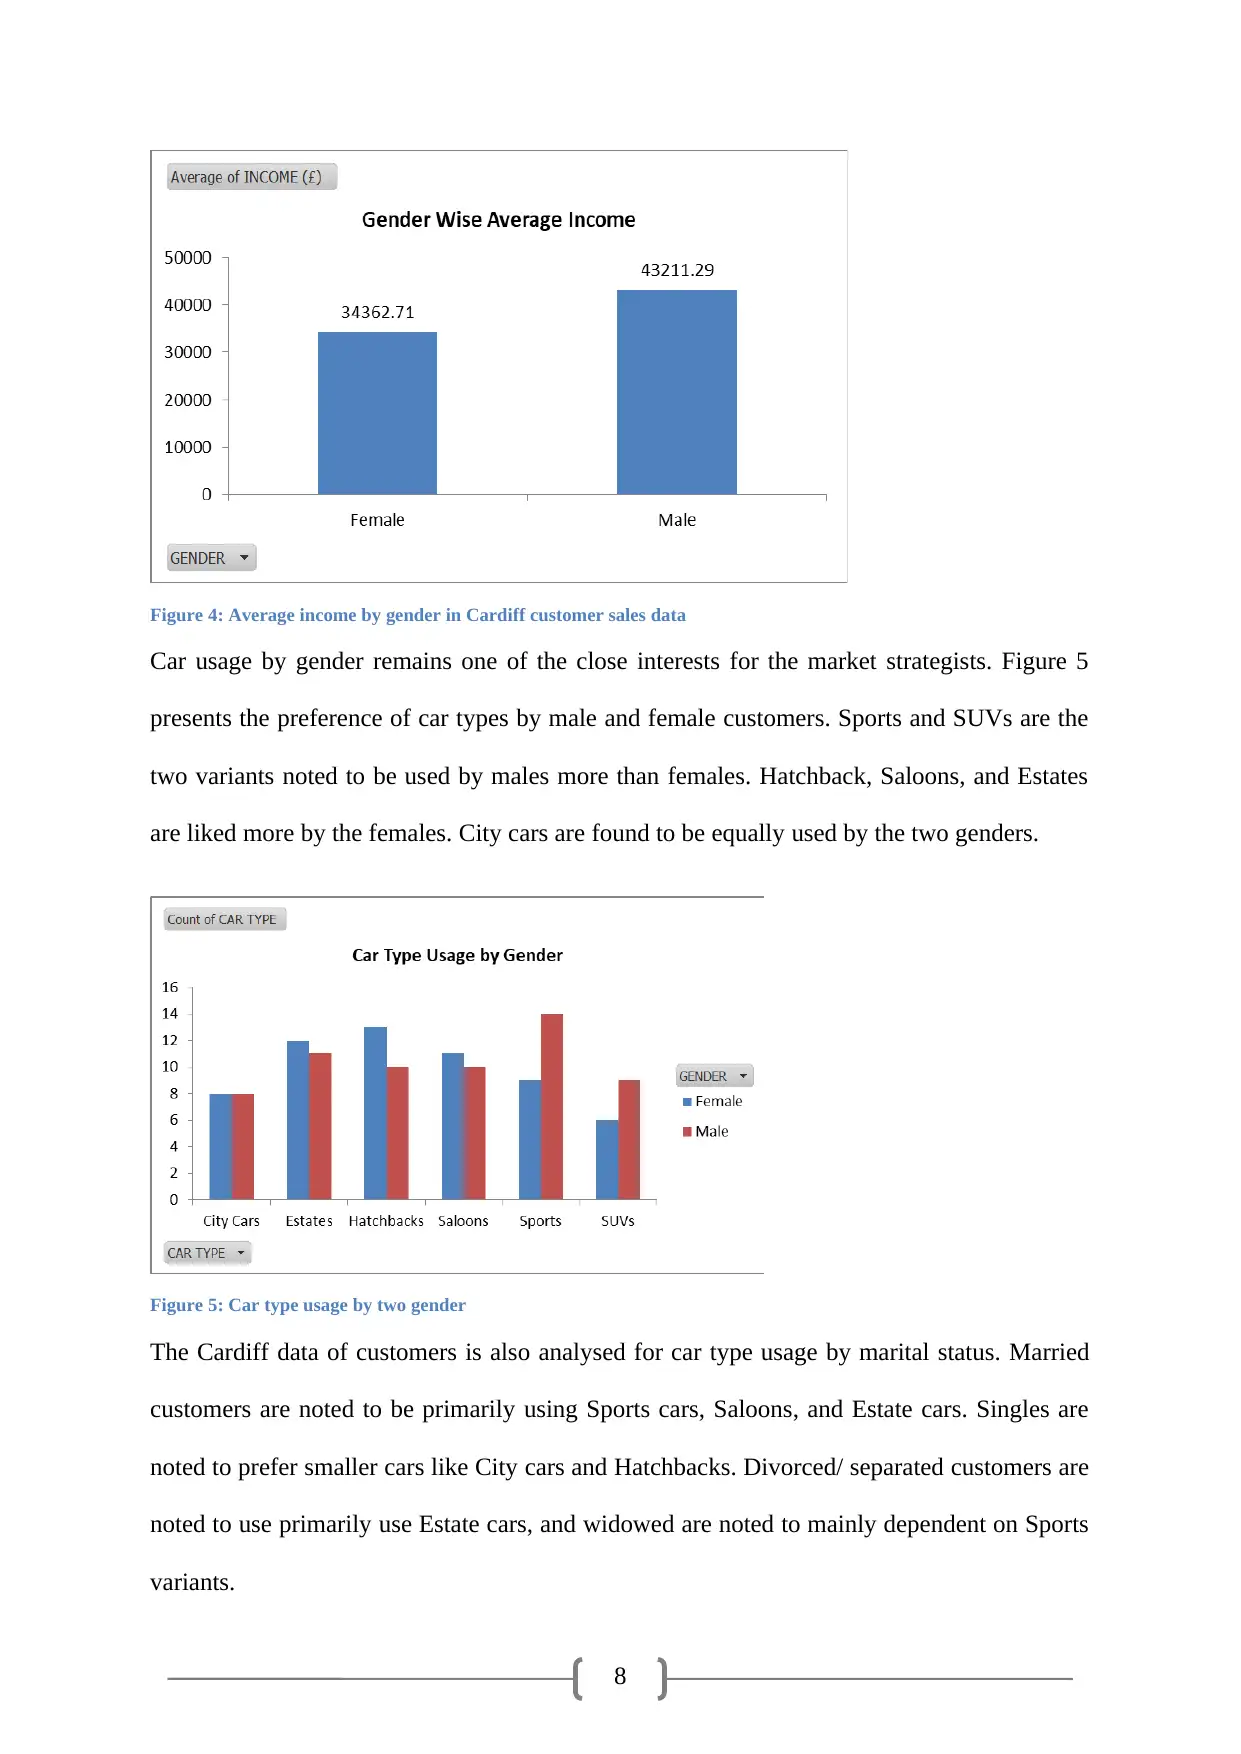
Figure 4: Average income by gender in Cardiff customer sales data
Car usage by gender remains one of the close interests for the market strategists. Figure 5
presents the preference of car types by male and female customers. Sports and SUVs are the
two variants noted to be used by males more than females. Hatchback, Saloons, and Estates
are liked more by the females. City cars are found to be equally used by the two genders.
Figure 5: Car type usage by two gender
The Cardiff data of customers is also analysed for car type usage by marital status. Married
customers are noted to be primarily using Sports cars, Saloons, and Estate cars. Singles are
noted to prefer smaller cars like City cars and Hatchbacks. Divorced/ separated customers are
noted to use primarily use Estate cars, and widowed are noted to mainly dependent on Sports
variants.
9
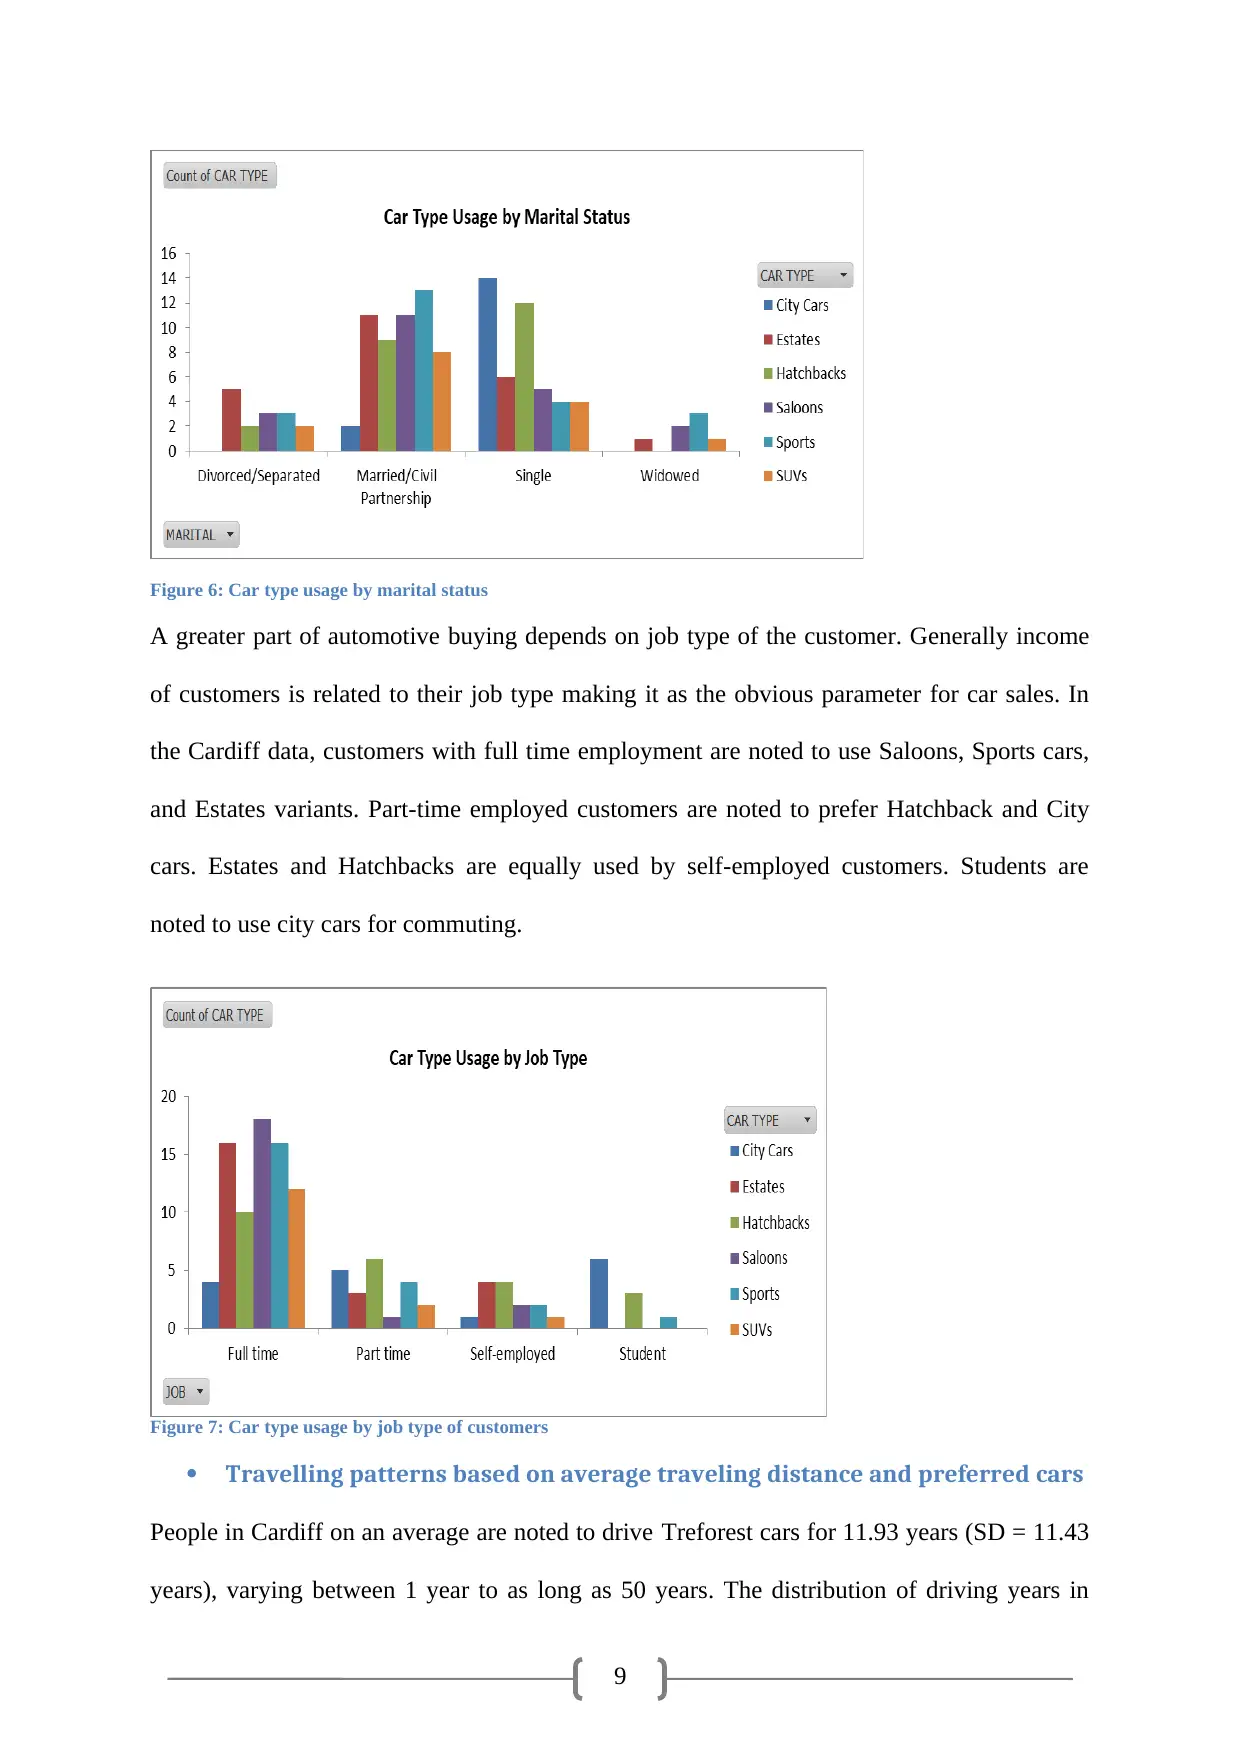
Figure 6: Car type usage by marital status
A greater part of automotive buying depends on job type of the customer. Generally income
of customers is related to their job type making it as the obvious parameter for car sales. In
the Cardiff data, customers with full time employment are noted to use Saloons, Sports cars,
and Estates variants. Part-time employed customers are noted to prefer Hatchback and City
cars. Estates and Hatchbacks are equally used by self-employed customers. Students are
noted to use city cars for commuting.
Figure 7: Car type usage by job type of customers
Travelling patterns based on average traveling distance and preferred cars
People in Cardiff on an average are noted to drive Treforest cars for 11.93 years (SD = 11.43
years), varying between 1 year to as long as 50 years. The distribution of driving years in
⊘ This is a preview!⊘
Do you want full access?
Subscribe today to unlock all pages.
Trusted by 1+ million students worldwide
10
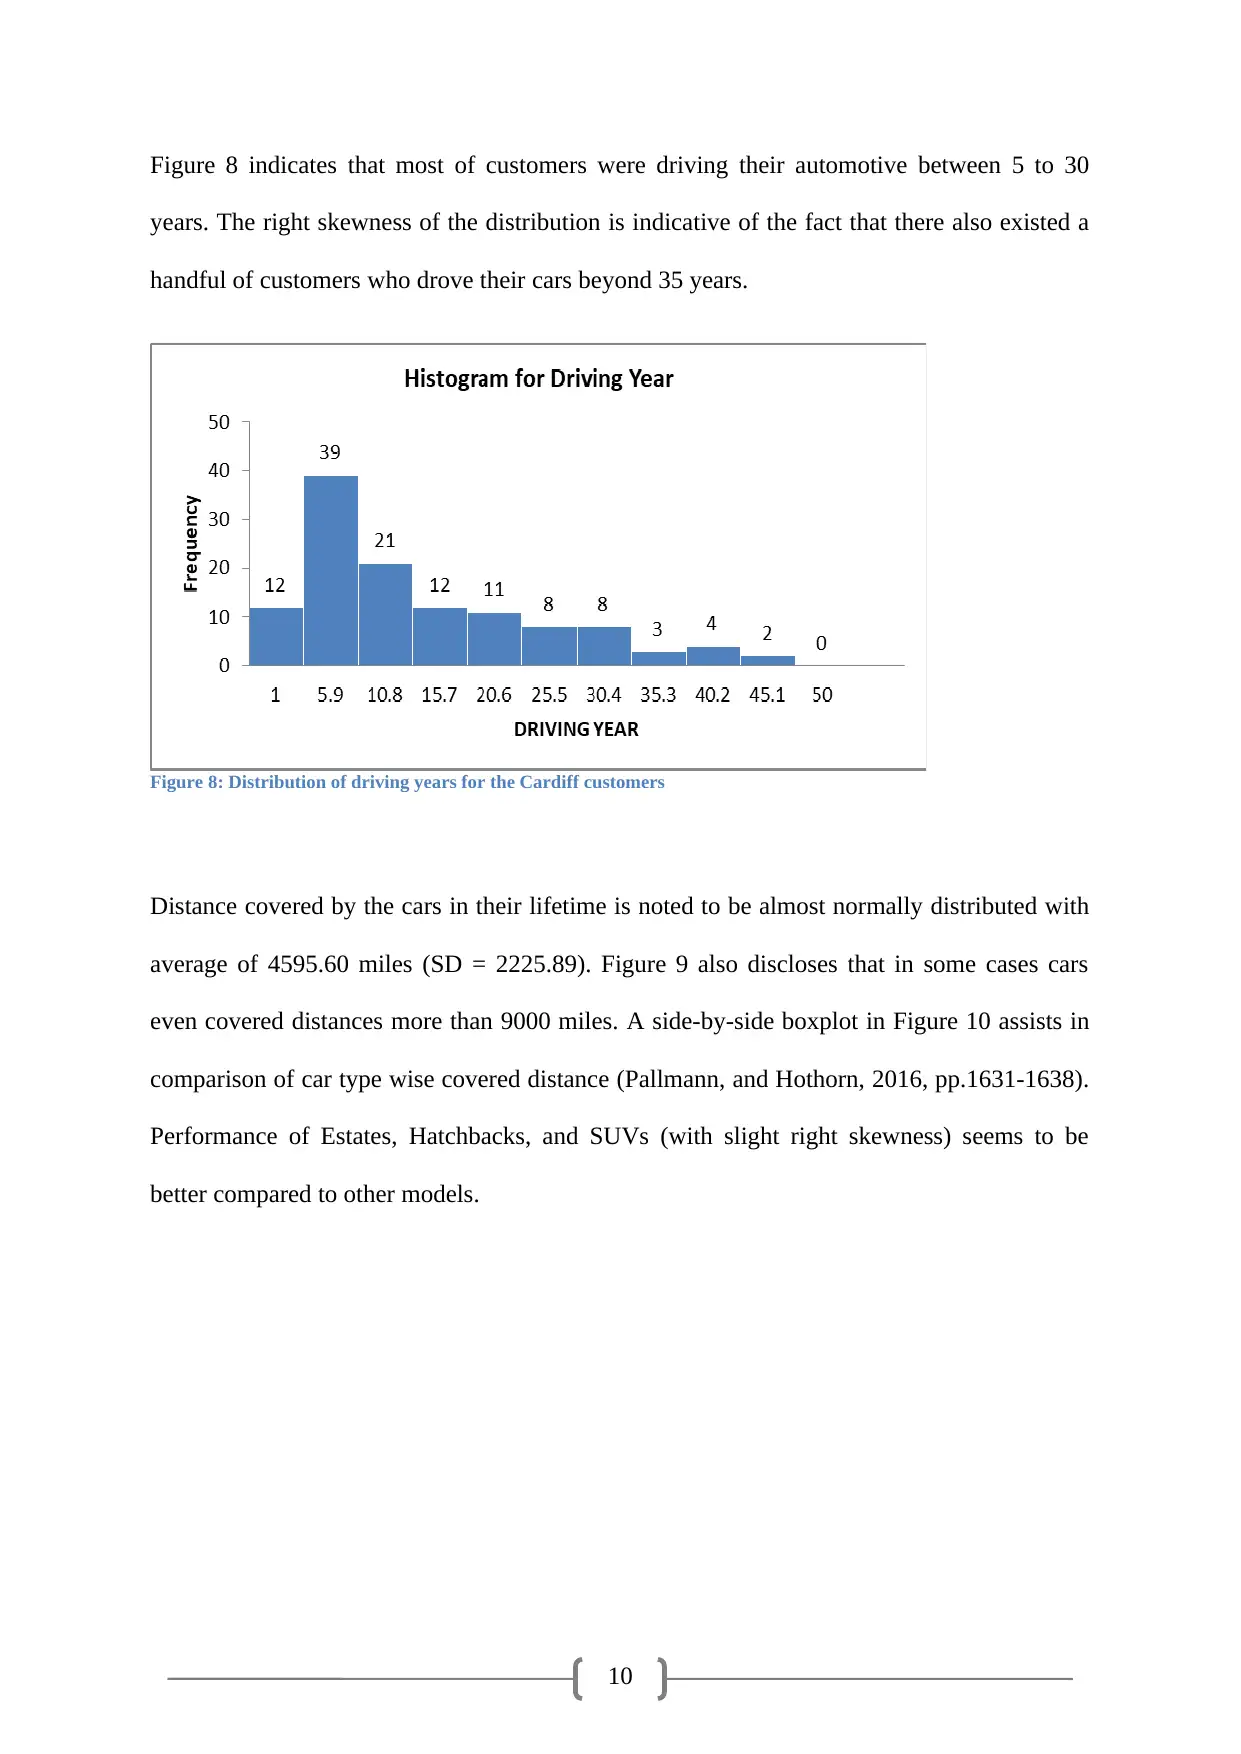
Figure 8 indicates that most of customers were driving their automotive between 5 to 30
years. The right skewness of the distribution is indicative of the fact that there also existed a
handful of customers who drove their cars beyond 35 years.
Figure 8: Distribution of driving years for the Cardiff customers
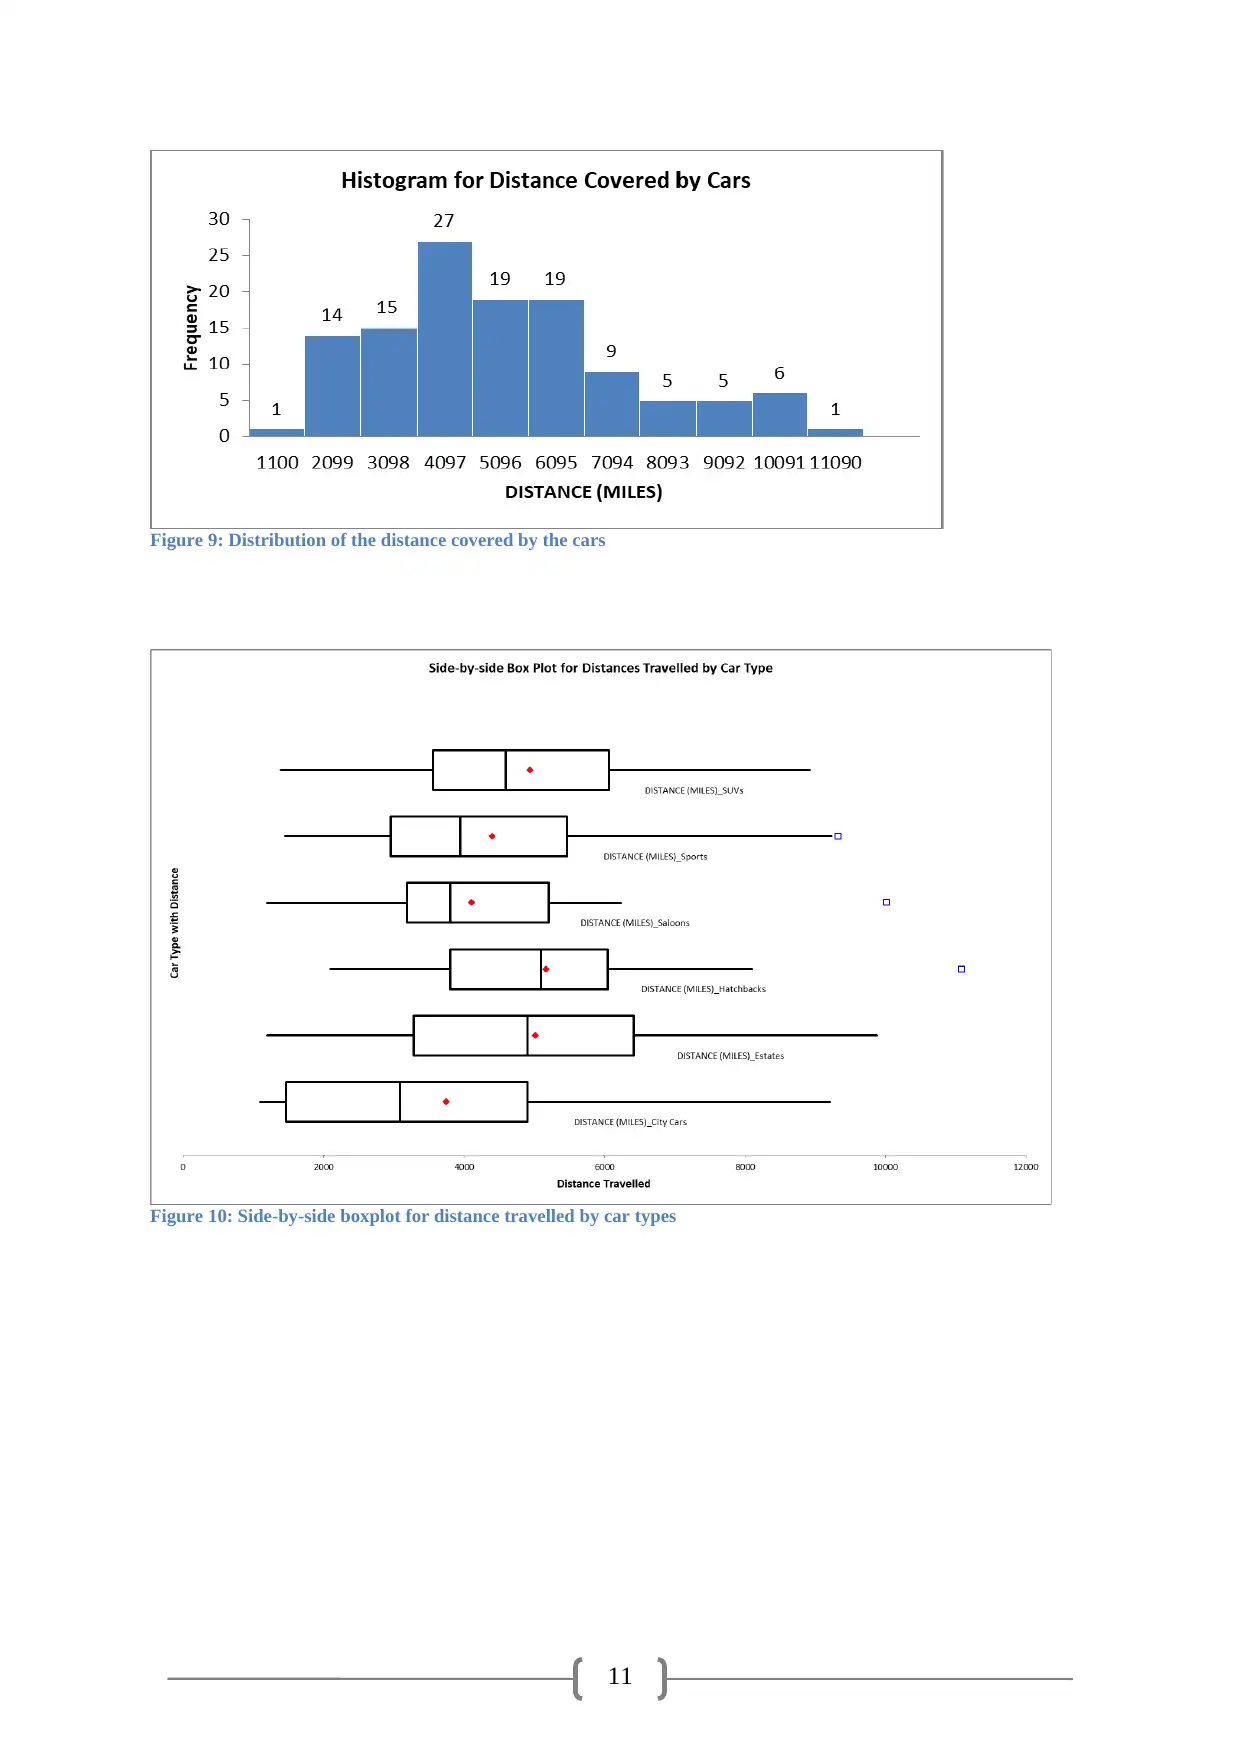
Distance covered by the cars in their lifetime is noted to be almost normally distributed with
average of 4595.60 miles (SD = 2225.89). Figure 9 also discloses that in some cases cars
even covered distances more than 9000 miles. A side-by-side boxplot in Figure 10 assists in
comparison of car type wise covered distance (Pallmann, and Hothorn, 2016, pp.1631-1638).
Performance of Estates, Hatchbacks, and SUVs (with slight right skewness) seems to be
better compared to other models.
Figure 8 indicates that most of customers were driving their automotive between 5 to 30
years. The right skewness of the distribution is indicative of the fact that there also existed a
handful of customers who drove their cars beyond 35 years.
Figure 8: Distribution of driving years for the Cardiff customers
Distance covered by the cars in their lifetime is noted to be almost normally distributed with
average of 4595.60 miles (SD = 2225.89). Figure 9 also discloses that in some cases cars
even covered distances more than 9000 miles. A side-by-side boxplot in Figure 10 assists in
comparison of car type wise covered distance (Pallmann, and Hothorn, 2016, pp.1631-1638).
Performance of Estates, Hatchbacks, and SUVs (with slight right skewness) seems to be
better compared to other models.
Paraphrase This Document
Need a fresh take? Get an instant paraphrase of this document with our AI Paraphraser
11
Figure 9: Distribution of the distance covered by the cars
Figure 10: Side-by-side boxplot for distance travelled by car types
Figure 9: Distribution of the distance covered by the cars
Figure 10: Side-by-side boxplot for distance travelled by car types
12
2. Regional Industry Analysis
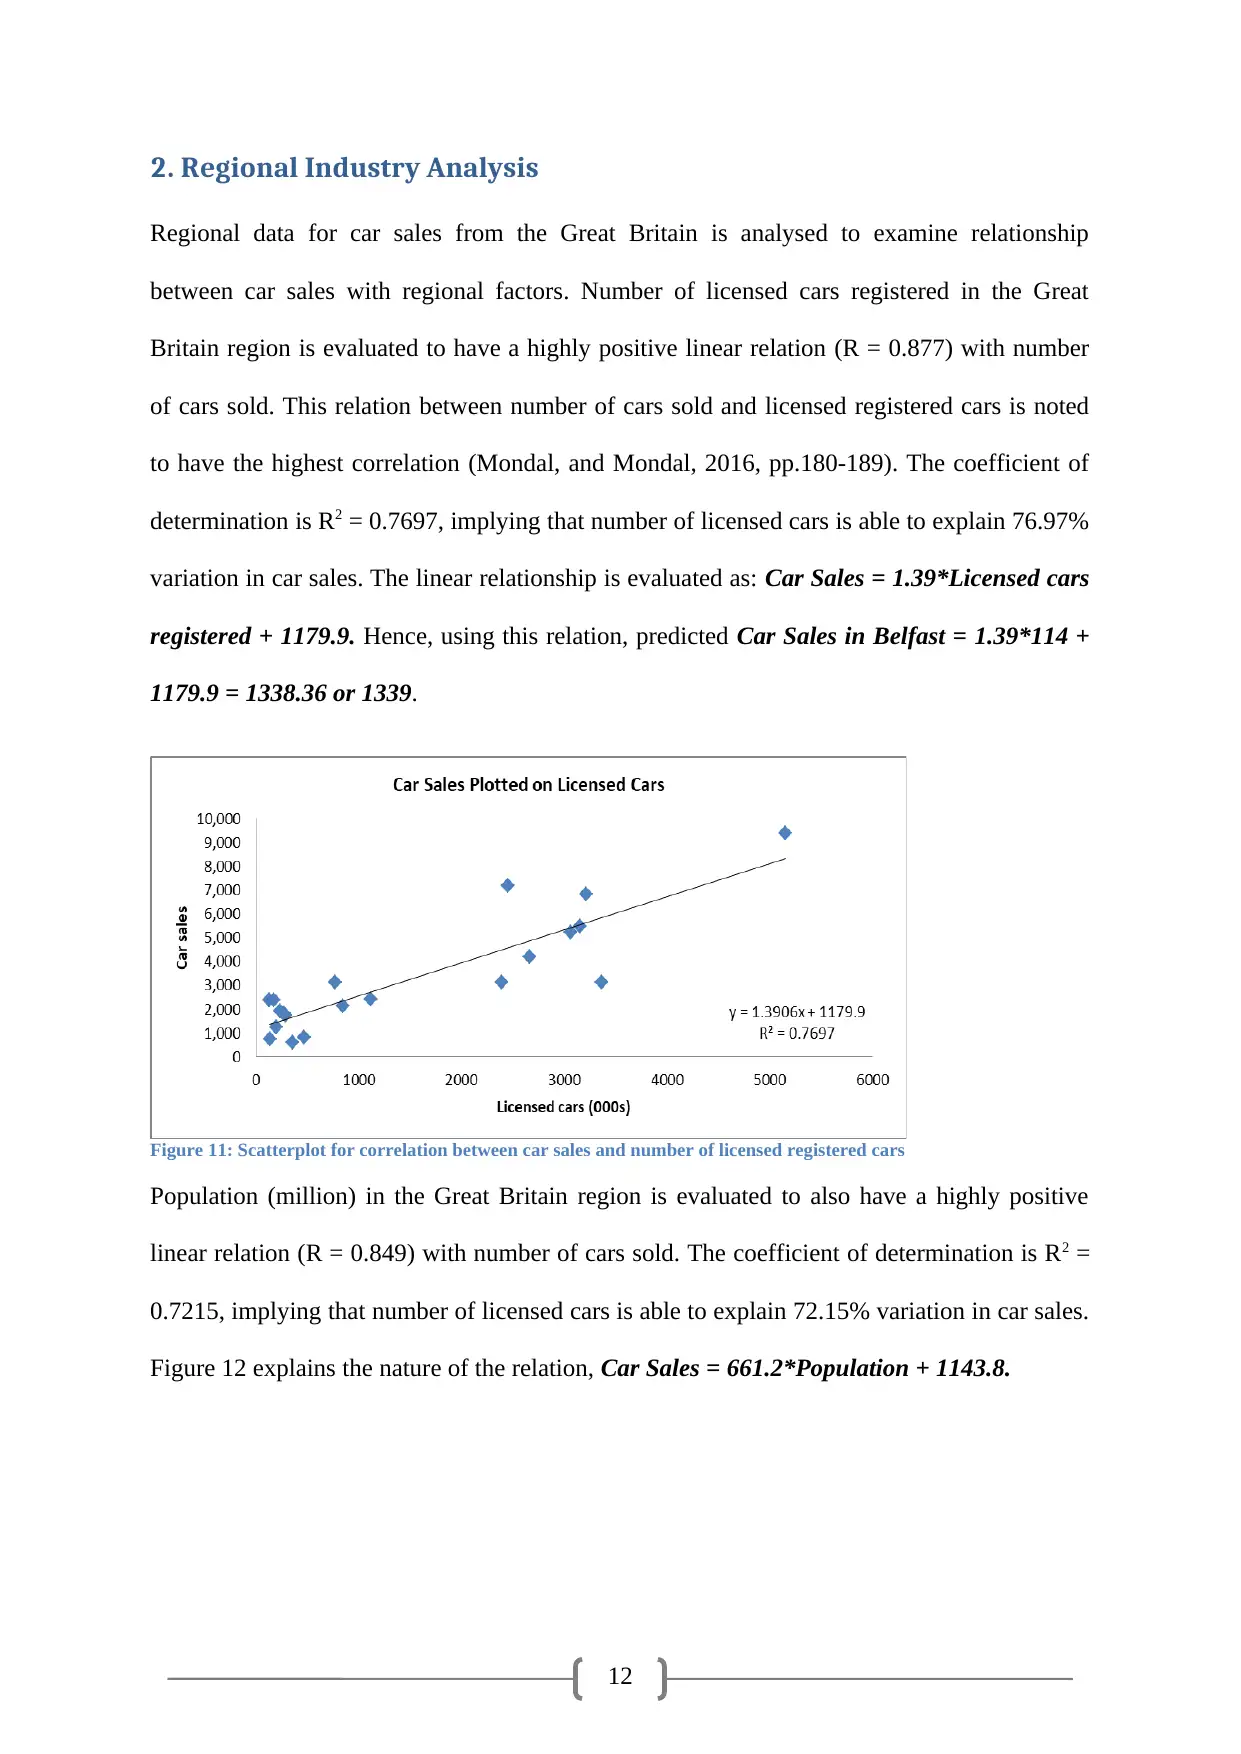
Regional data for car sales from the Great Britain is analysed to examine relationship
between car sales with regional factors. Number of licensed cars registered in the Great
Britain region is evaluated to have a highly positive linear relation (R = 0.877) with number
of cars sold. This relation between number of cars sold and licensed registered cars is noted
to have the highest correlation (Mondal, and Mondal, 2016, pp.180-189). The coefficient of
determination is R2 = 0.7697, implying that number of licensed cars is able to explain 76.97%
variation in car sales. The linear relationship is evaluated as: Car Sales = 1.39*Licensed cars
registered + 1179.9. Hence, using this relation, predicted Car Sales in Belfast = 1.39*114 +
1179.9 = 1338.36 or 1339.
Figure 11: Scatterplot for correlation between car sales and number of licensed registered cars
Population (million) in the Great Britain region is evaluated to also have a highly positive
linear relation (R = 0.849) with number of cars sold. The coefficient of determination is R2 =
0.7215, implying that number of licensed cars is able to explain 72.15% variation in car sales.
Figure 12 explains the nature of the relation, Car Sales = 661.2*Population + 1143.8.
2. Regional Industry Analysis
Regional data for car sales from the Great Britain is analysed to examine relationship
between car sales with regional factors. Number of licensed cars registered in the Great
Britain region is evaluated to have a highly positive linear relation (R = 0.877) with number
of cars sold. This relation between number of cars sold and licensed registered cars is noted
to have the highest correlation (Mondal, and Mondal, 2016, pp.180-189). The coefficient of
determination is R2 = 0.7697, implying that number of licensed cars is able to explain 76.97%
variation in car sales. The linear relationship is evaluated as: Car Sales = 1.39*Licensed cars
registered + 1179.9. Hence, using this relation, predicted Car Sales in Belfast = 1.39*114 +
1179.9 = 1338.36 or 1339.
Figure 11: Scatterplot for correlation between car sales and number of licensed registered cars
Population (million) in the Great Britain region is evaluated to also have a highly positive
linear relation (R = 0.849) with number of cars sold. The coefficient of determination is R2 =
0.7215, implying that number of licensed cars is able to explain 72.15% variation in car sales.
Figure 12 explains the nature of the relation, Car Sales = 661.2*Population + 1143.8.
⊘ This is a preview!⊘
Do you want full access?
Subscribe today to unlock all pages.
Trusted by 1+ million students worldwide
1 out of 22
Your All-in-One AI-Powered Toolkit for Academic Success.
+13062052269
info@desklib.com
Available 24*7 on WhatsApp / Email
![[object Object]](/_next/static/media/star-bottom.7253800d.svg)
Unlock your academic potential
Copyright © 2020–2026 A2Z Services. All Rights Reserved. Developed and managed by ZUCOL.