Data Analysis Techniques: Forecasting Wind Speed in Cardiff, Wales

Verified

Added on  2021/02/21

|10
|1447
|137
Report
AI Summary
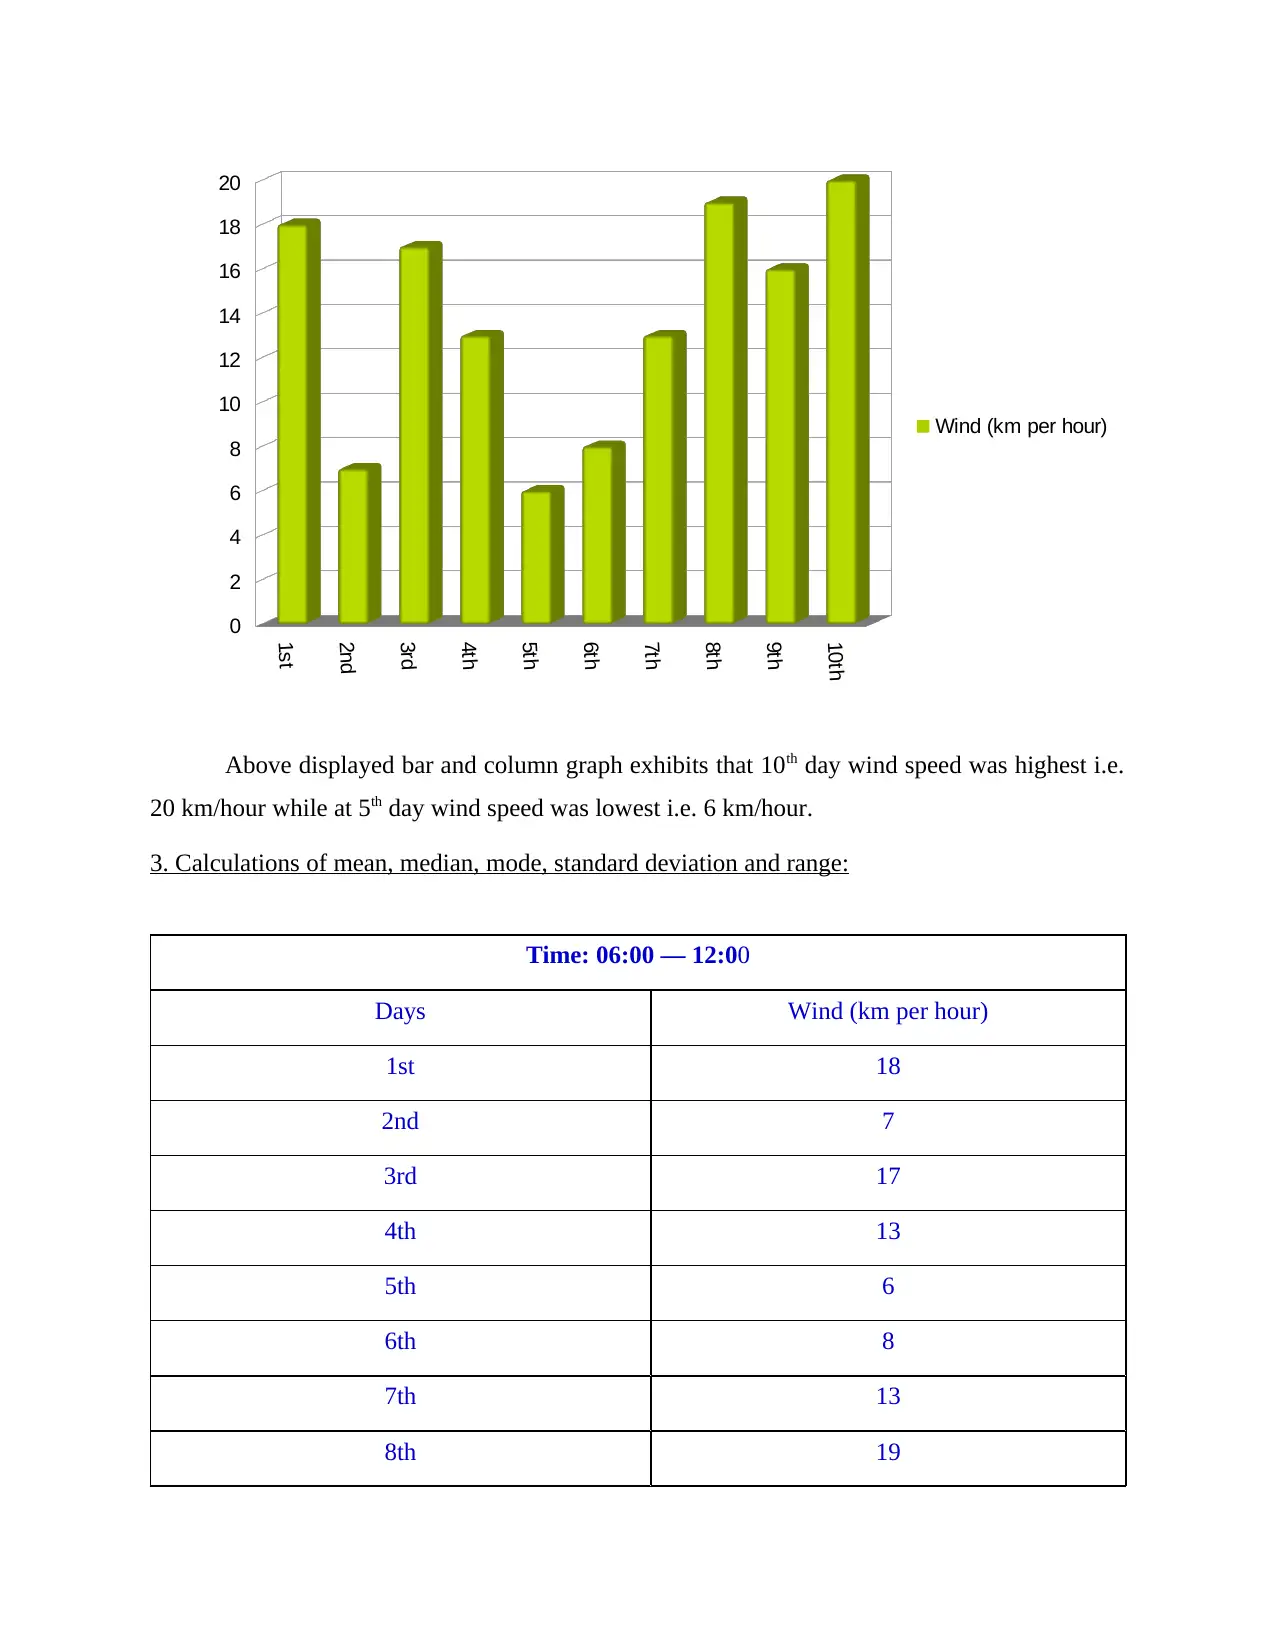
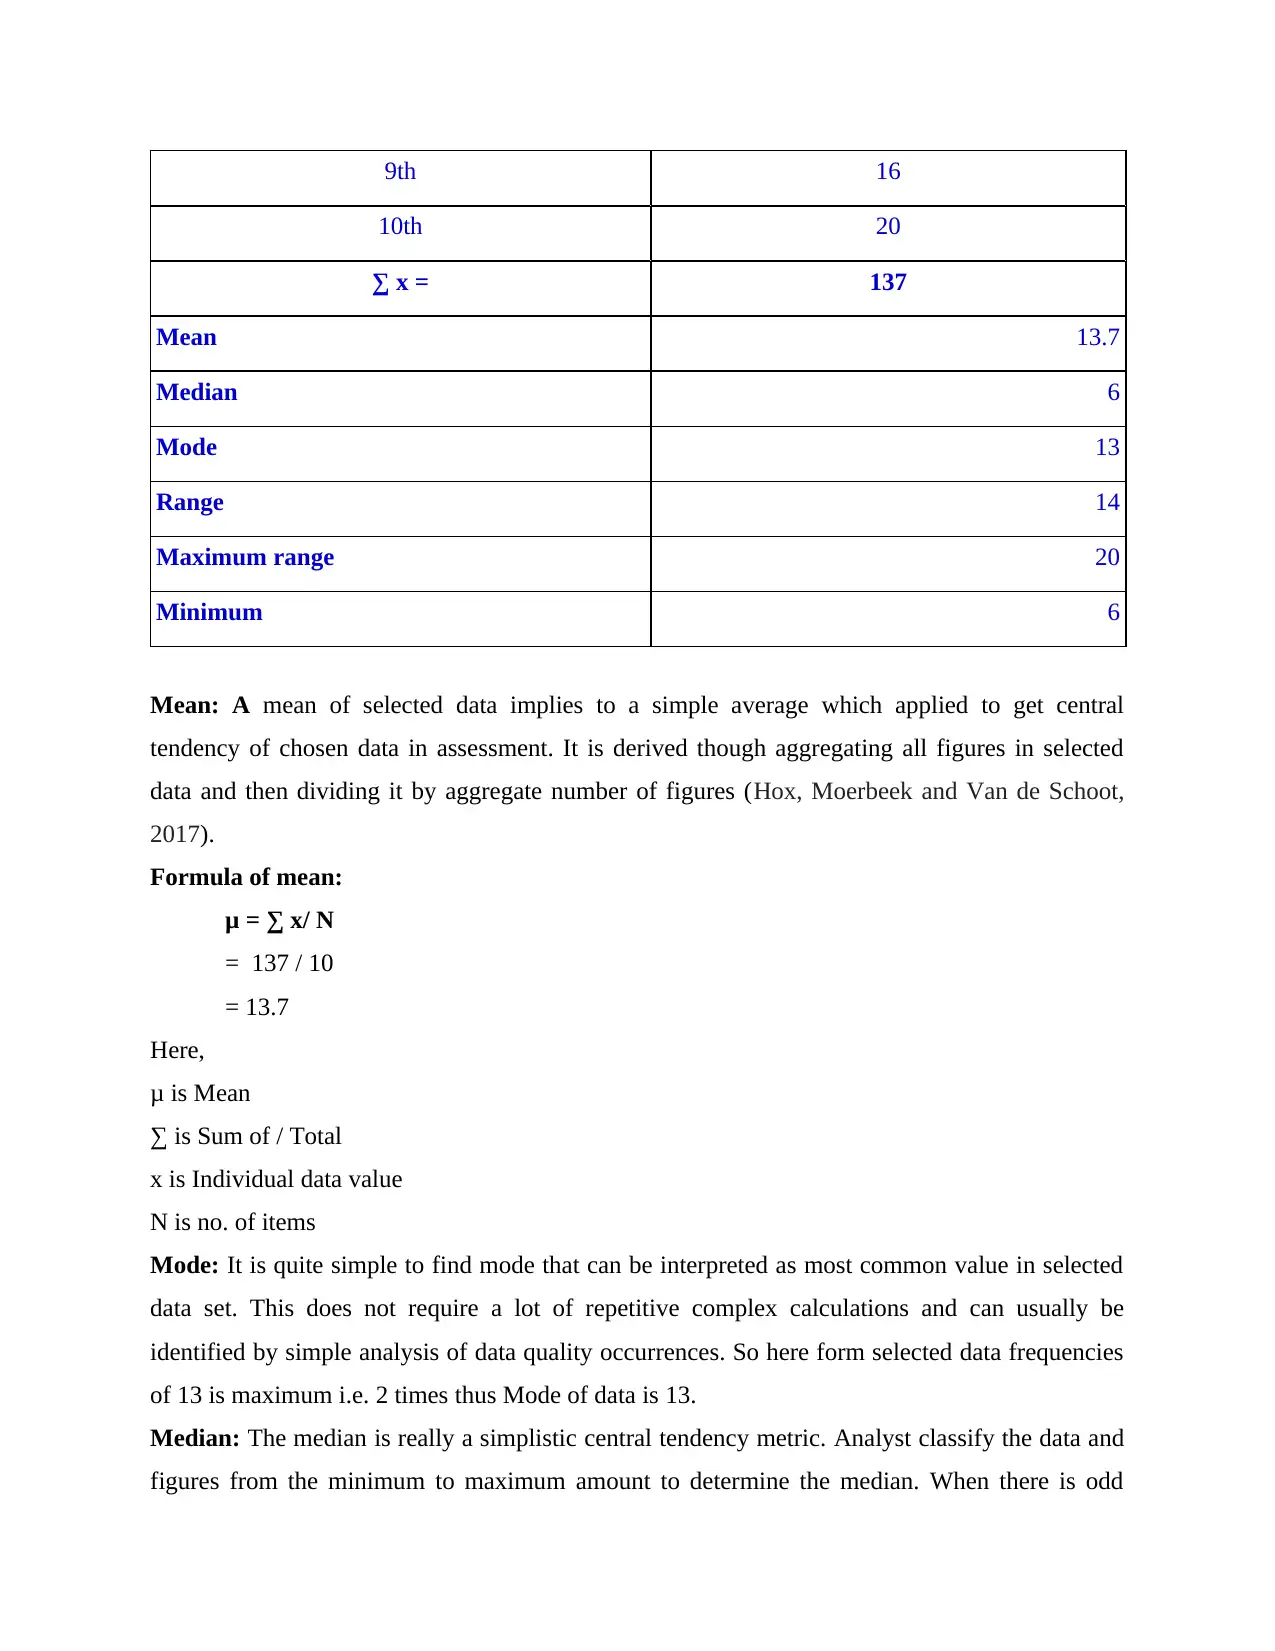
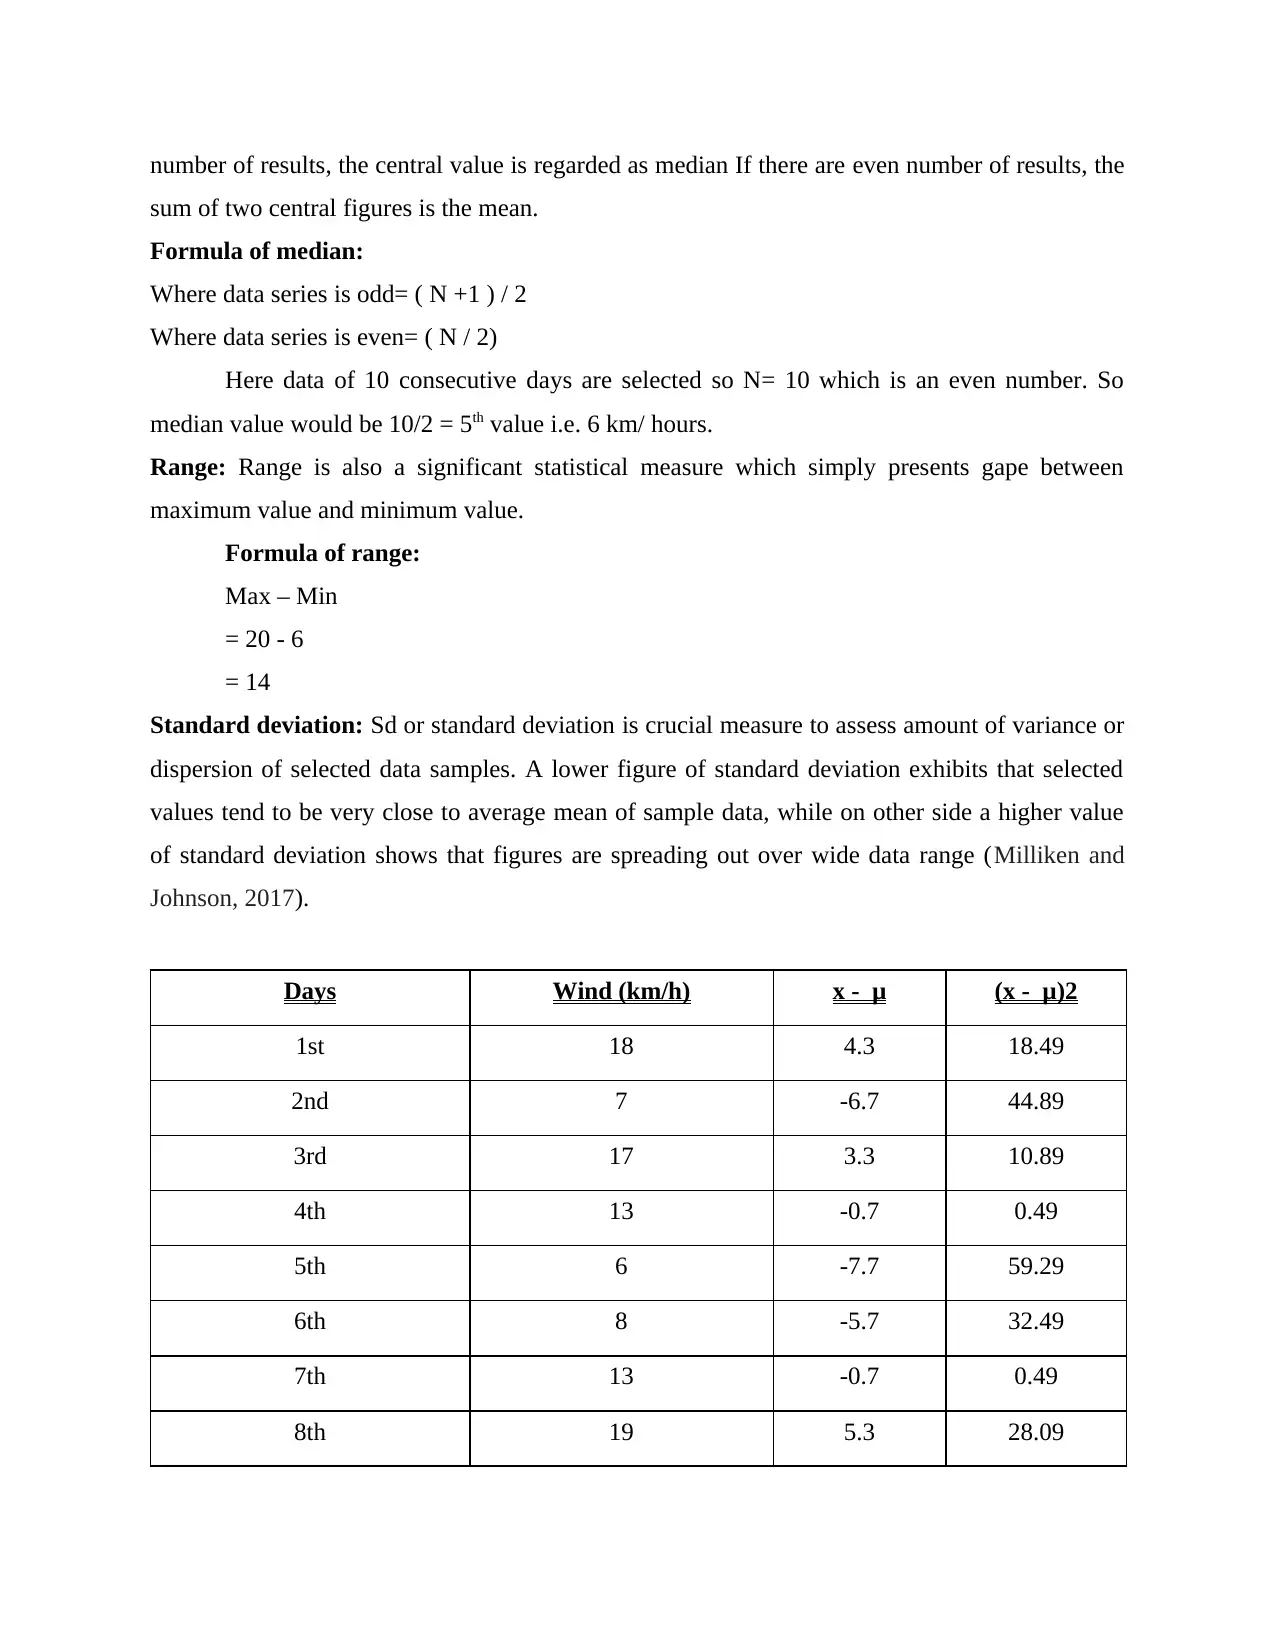
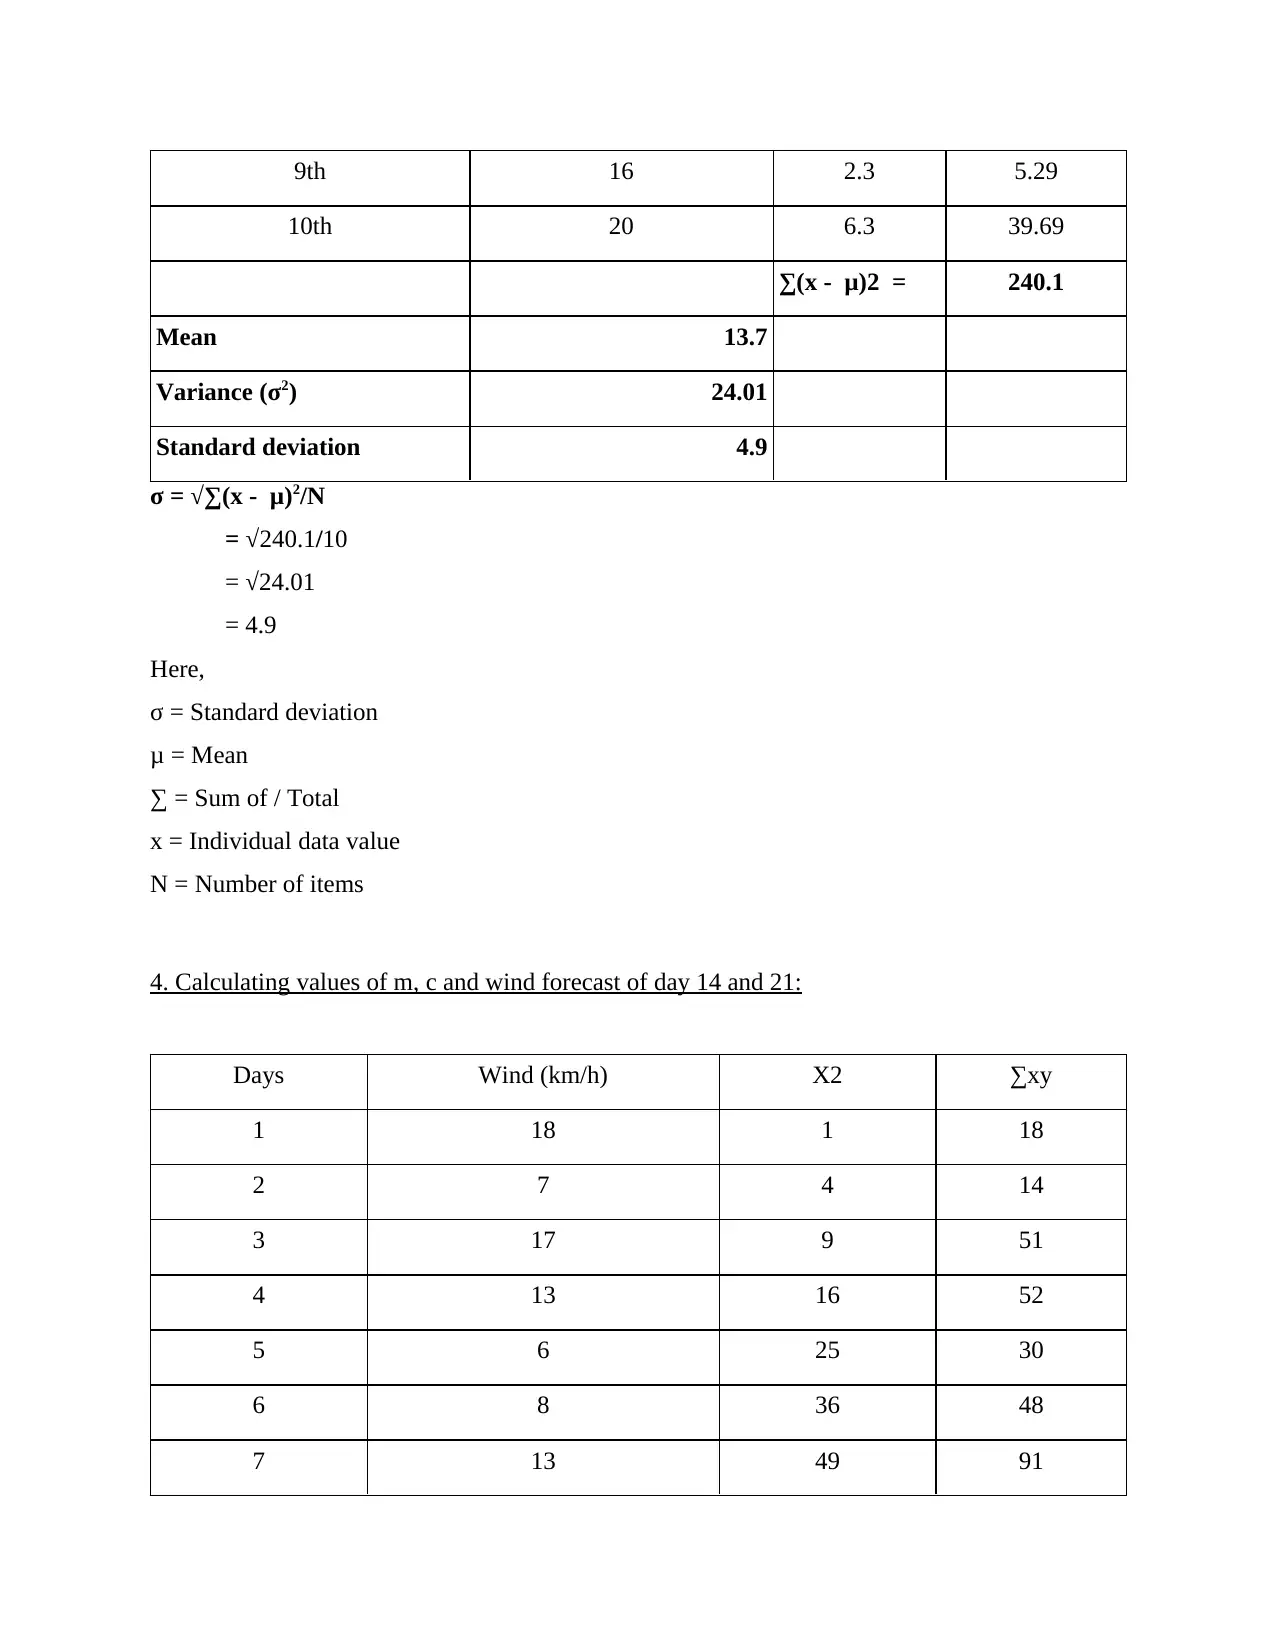
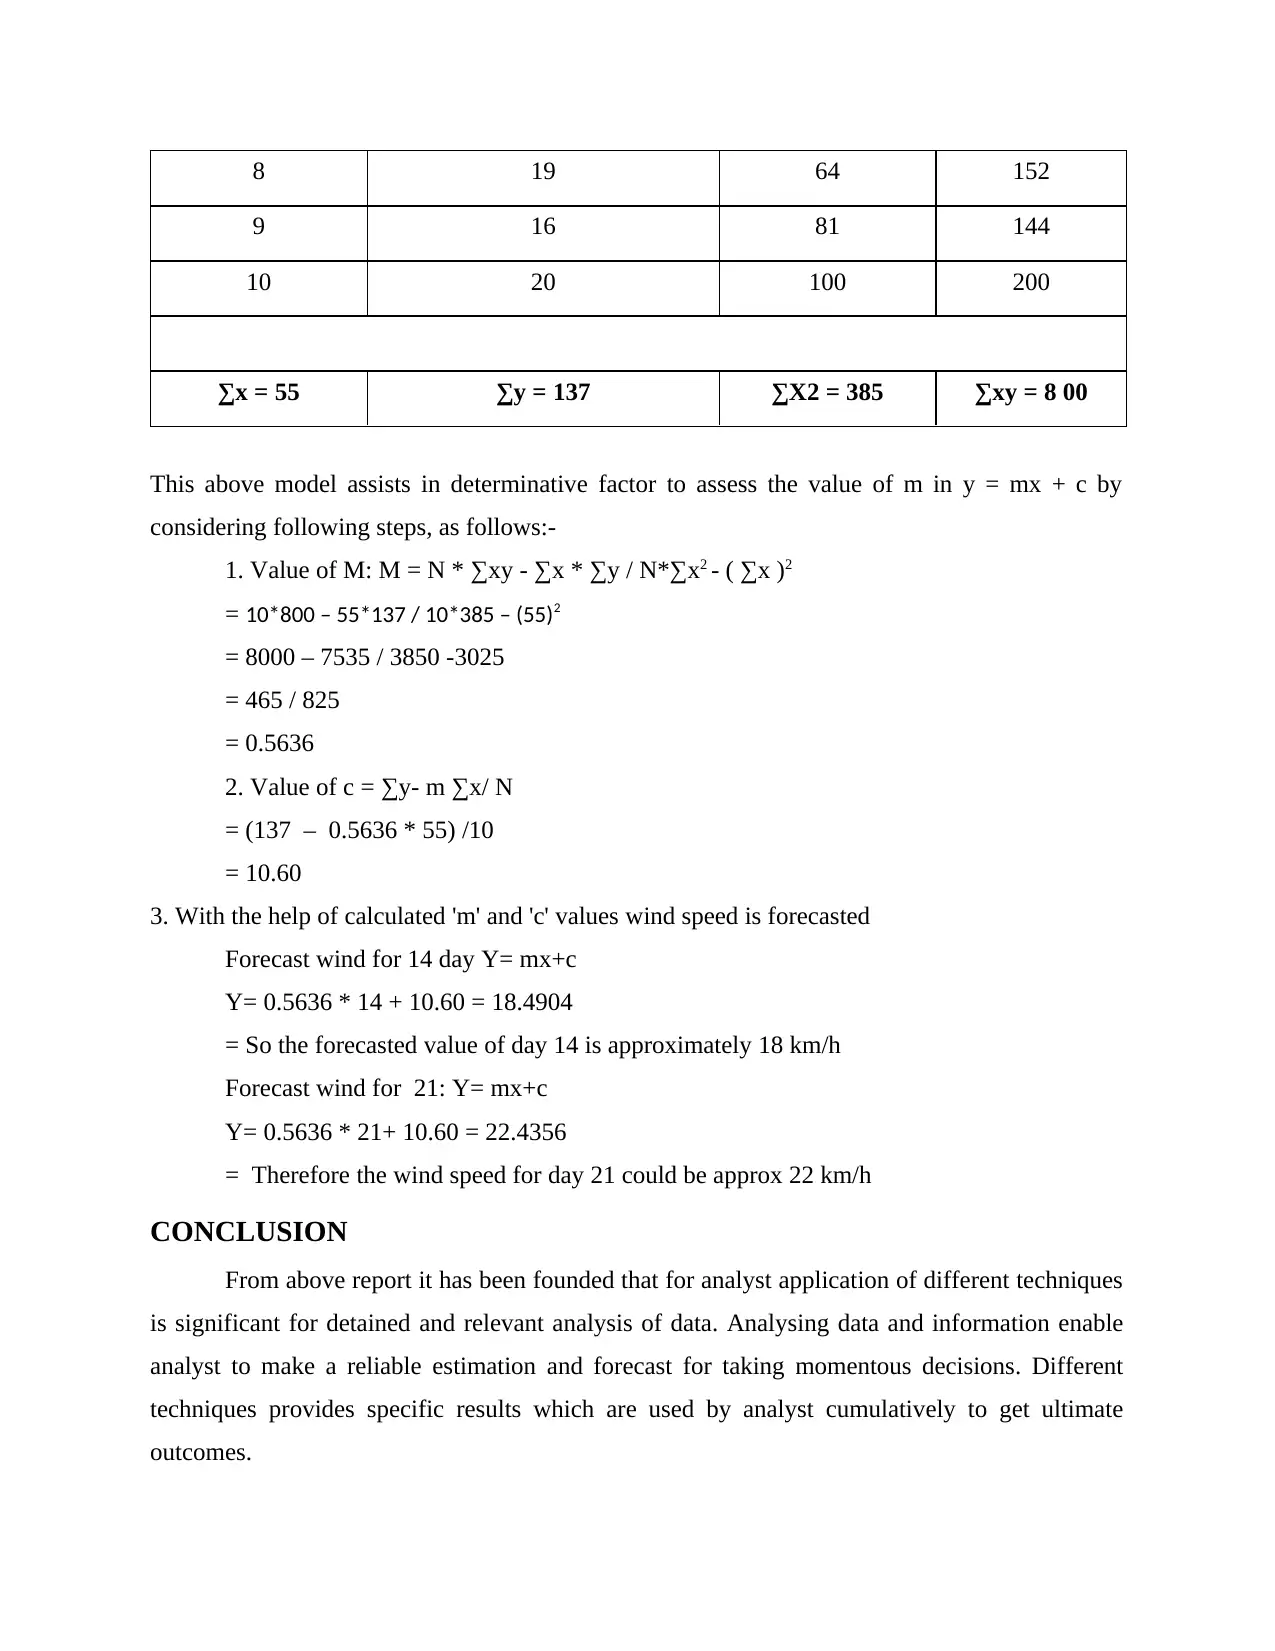
This report presents an analysis of wind speed data from Cardiff, Wales, focusing on data analysis techniques for forecasting. The study begins by representing the data in tabular form and then visualizes it using bar and column charts. Key statistical measures like mean, median, mode, standard deviation, and range are calculated to understand the central tendencies and dispersion of the data. Furthermore, the report employs linear regression to forecast wind speeds for specific future days, calculating the values of 'm' and 'c' to predict wind speeds for the 14th and 21st days. The conclusion highlights the importance of various analytical techniques in data evaluation and the reliability of estimations derived from them, emphasizing their cumulative utility in decision-making processes. The report provides a practical application of data analysis in environmental forecasting.
Document Page
Data Analysis
Techniques
tabler-icon-diamond-filled.svg

Paraphrase This Document

Need a fresh take? Get an instant paraphrase of this document with our AI Paraphraser
Document Page
Table of Contents
INTRODUCTION...........................................................................................................................3
MAIN BODY...................................................................................................................................3
1. Representation of data in tabular form:...................................................................................3
2. Data representation in charts:...................................................................................................4
3. Calculations of mean, median, mode, standard deviation and range:......................................5
4. Calculating values of m, c and wind forecast of day 14 and 21:.............................................8
CONCLUSION................................................................................................................................9
REFERENCES..............................................................................................................................10
Document Page
INTRODUCTION
Data analysis relates to critical process which contributes in evaluation and assessment of
different significant aspects of selected data or information. Analysis of data is key task which
help to find out the some major hidden factors related to selected information and data
(Anderberg, 2014). This assessment contains various techniques and methods to analyse data of
wind speed of 10 consecutive days in Cardiff, Wales, United Kingdom during August month in
order to forecast or estimate wind speed for 21 day and 14 day.
MAIN BODY
1. Representation of data in tabular form:
Below presented tabular form of chosen data exhibit wind speed during 10 consecutive
days at time period of 6:00 to 12:00 in Cardiff, Wales, United Kingdom (Wind speed of Cardiff.
2019), as shown below:
Time: 06:00 — 12:00
Days Wind (km per hour)
1st 18
2nd 7
3rd 17
4th 13
5th 6
6th 8
7th 13
8th 19
9th 16
10th 20
Document Page
tabler-icon-diamond-filled.svg

Paraphrase This Document

Need a fresh take? Get an instant paraphrase of this document with our AI Paraphraser
Document Page
2. Data representation in charts:
Bar Graph: A Bar-graph (also regarded as bar-chart or bar-diagram) is a graphical tool which
compares data between terms using bars. A bar-chart normally extend horizontally. Knowing the
essential thing is that longer bar represent higher values. Following is Bar Graph of data of
Cardiff's wind-speed during 10-consecutive days:
Column Chart:
A column-graph (also described as a vertical bar-graph) is a graphical analysis of
numerical statistics, which displays and contrasts independent as well as dependent factors
mapped along X-axis and Y-axis in the format of rectangle bars.
1st
2nd
3rd
4th
5th
6th
7th
8th
9th
10th
0 2 4 6 8 10 12 14 16 18 20
Wind (km per hour)
Document Page
Above displayed bar and column graph exhibits that 10th day wind speed was highest i.e.
20 km/hour while at 5th day wind speed was lowest i.e. 6 km/hour.
3. Calculations of mean, median, mode, standard deviation and range:
Time: 06:00 — 12:00
Days Wind (km per hour)
1st 18
2nd 7
3rd 17
4th 13
5th 6
6th 8
7th 13
8th 19
1st
2nd
3rd
4th
5th
6th
7th
8th
9th
10th
0
2
4
6
8
10
12
14
16
18
20
Wind (km per hour)
Document Page
9th 16
10th 20
x = 137
Mean 13.7
Median 6
Mode 13
Range 14
Maximum range 20
Minimum 6
Mean: A mean of selected data implies to a simple average which applied to get central
tendency of chosen data in assessment. It is derived though aggregating all figures in selected
data and then dividing it by aggregate number of figures (Hox, Moerbeek and Van de Schoot,
2017).
Formula of mean:
μ = ∑ x/ N
= 137 / 10
= 13.7
Here,
μ is Mean
is Sum of / Total
x is Individual data value
N is no. of items
Mode: It is quite simple to find mode that can be interpreted as most common value in selected
data set. This does not require a lot of repetitive complex calculations and can usually be
identified by simple analysis of data quality occurrences. So here form selected data frequencies
of 13 is maximum i.e. 2 times thus Mode of data is 13.
Median: The median is really a simplistic central tendency metric. Analyst classify the data and
figures from the minimum to maximum amount to determine the median. When there is odd
tabler-icon-diamond-filled.svg

Paraphrase This Document

Need a fresh take? Get an instant paraphrase of this document with our AI Paraphraser
Document Page
number of results, the central value is regarded as median If there are even number of results, the
sum of two central figures is the mean.
Formula of median:
Where data series is odd= ( N +1 ) / 2
Where data series is even= ( N / 2)
Here data of 10 consecutive days are selected so N= 10 which is an even number. So
median value would be 10/2 = 5th value i.e. 6 km/ hours.
Range: Range is also a significant statistical measure which simply presents gape between
maximum value and minimum value.
Formula of range:
Max – Min
= 20 - 6
= 14
Standard deviation: Sd or standard deviation is crucial measure to assess amount of variance or
dispersion of selected data samples. A lower figure of standard deviation exhibits that selected
values tend to be very close to average mean of sample data, while on other side a higher value
of standard deviation shows that figures are spreading out over wide data range (Milliken and
Johnson, 2017).
Days Wind (km/h) x - μ (x - μ)2
1st 18 4.3 18.49
2nd 7 -6.7 44.89
3rd 17 3.3 10.89
4th 13 -0.7 0.49
5th 6 -7.7 59.29
6th 8 -5.7 32.49
7th 13 -0.7 0.49
8th 19 5.3 28.09
Document Page
9th 16 2.3 5.29
10th 20 6.3 39.69
∑(x - μ)2 = 240.1
Mean 13.7
Variance (σ2) 24.01
Standard deviation 4.9
σ = √∑(x - μ)2/N
= √240.1/10
= √24.01
= 4.9
Here,
σ = Standard deviation
μ = Mean
= Sum of / Total
x = Individual data value
N = Number of items
4. Calculating values of m, c and wind forecast of day 14 and 21:
Days Wind (km/h) X2 ∑xy
1 18 1 18
2 7 4 14
3 17 9 51
4 13 16 52
5 6 25 30
6 8 36 48
7 13 49 91
Document Page
8 19 64 152
9 16 81 144
10 20 100 200
∑x = 55 ∑y = 137 ∑X2 = 385 ∑xy = 8 00
This above model assists in determinative factor to assess the value of m in y = mx + c by
considering following steps, as follows:-
1. Value of M: M = N * ∑xy - ∑x * ∑y / N*∑x2 - ( ∑x )2
= 10*800 – 55*137 / 10*385 – (55)2
= 8000 – 7535 / 3850 -3025
= 465 / 825
= 0.5636
2. Value of c = ∑y- m ∑x/ N
= (137 – 0.5636 * 55) /10
= 10.60
3. With the help of calculated 'm' and 'c' values wind speed is forecasted
Forecast wind for 14 day Y= mx+c
Y= 0.5636 * 14 + 10.60 = 18.4904
= So the forecasted value of day 14 is approximately 18 km/h
Forecast wind for 21: Y= mx+c
Y= 0.5636 * 21+ 10.60 = 22.4356
= Therefore the wind speed for day 21 could be approx 22 km/h
CONCLUSION
From above report it has been founded that for analyst application of different techniques
is significant for detained and relevant analysis of data. Analysing data and information enable
analyst to make a reliable estimation and forecast for taking momentous decisions. Different
techniques provides specific results which are used by analyst cumulatively to get ultimate
outcomes.
chevron_up_icon
1 out of 10
circle_padding
hide_on_mobile
zoom_out_icon
[object Object]