Descriptive Report: Cardiopulmonary Exercise Testing - Physiology

Verified

Added on  2022/09/02

|21
|2877
|15
Report
AI Summary
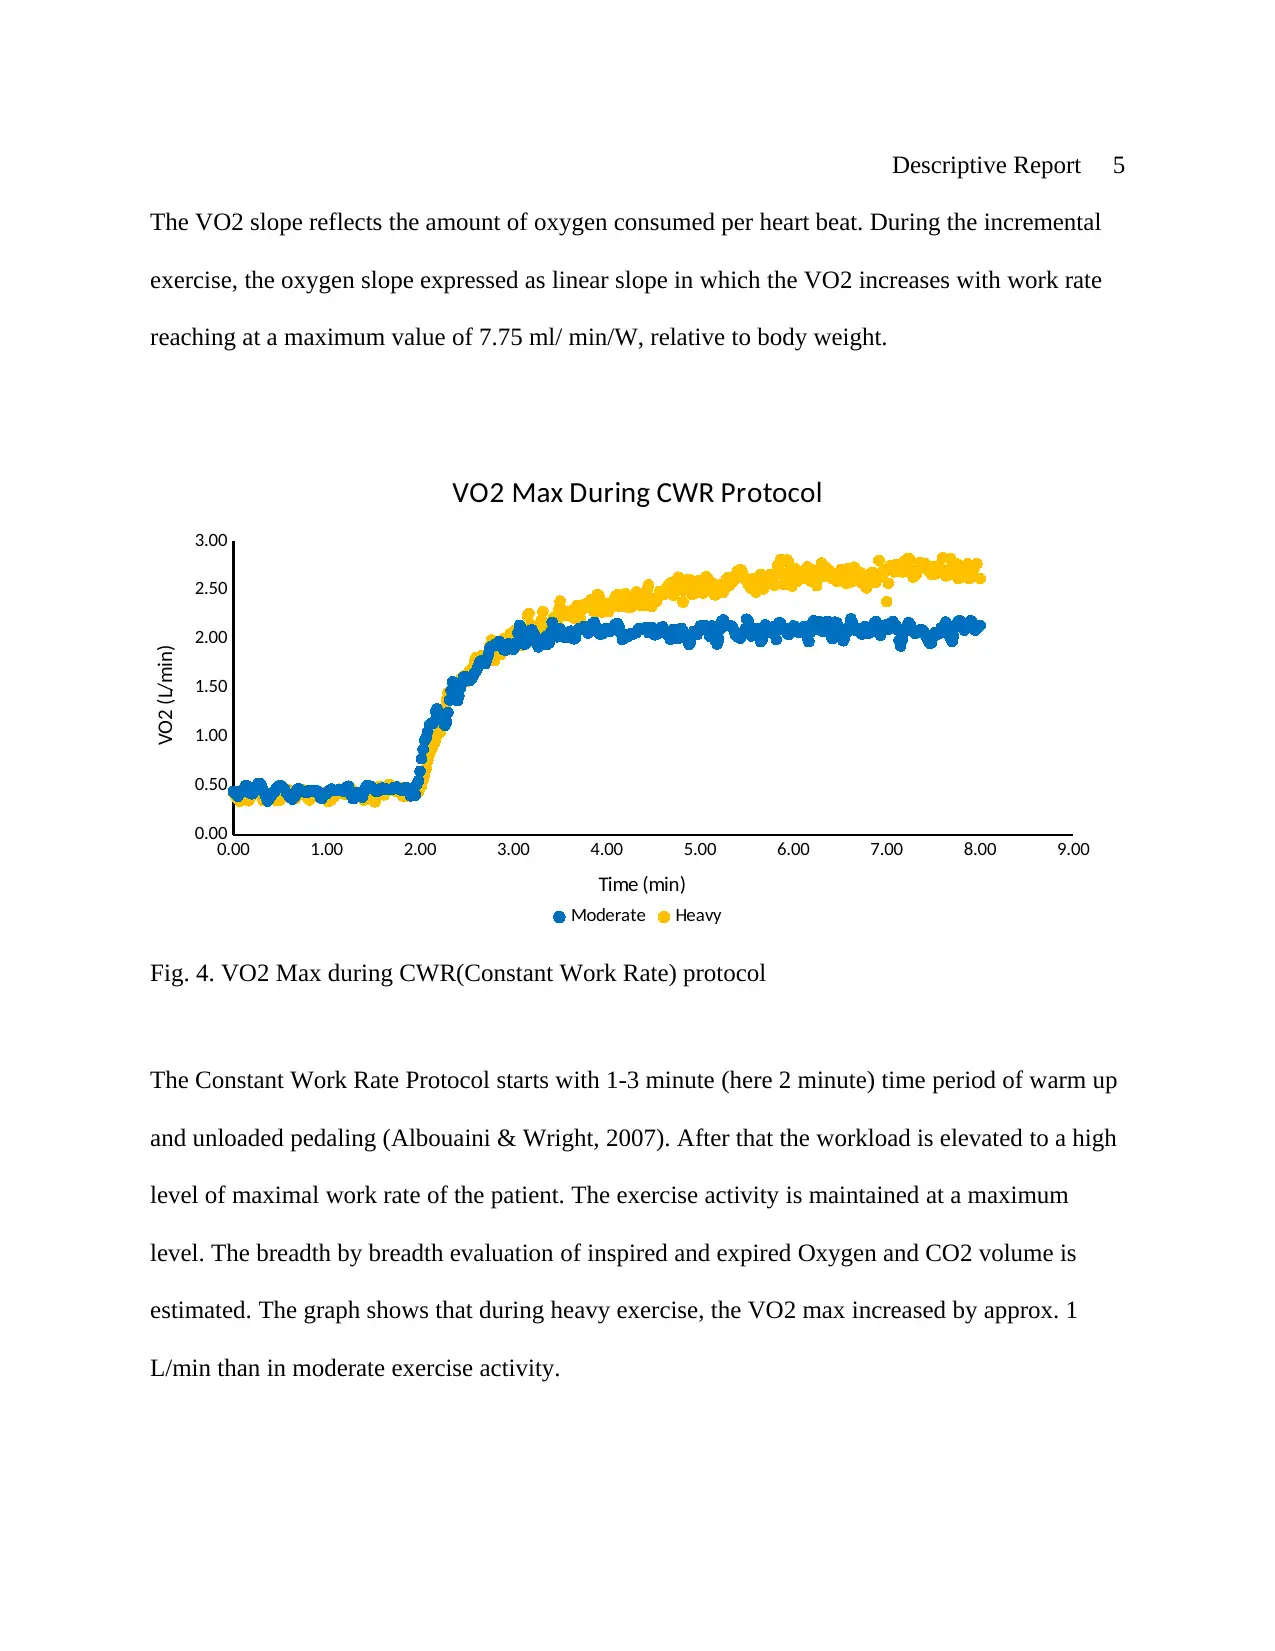
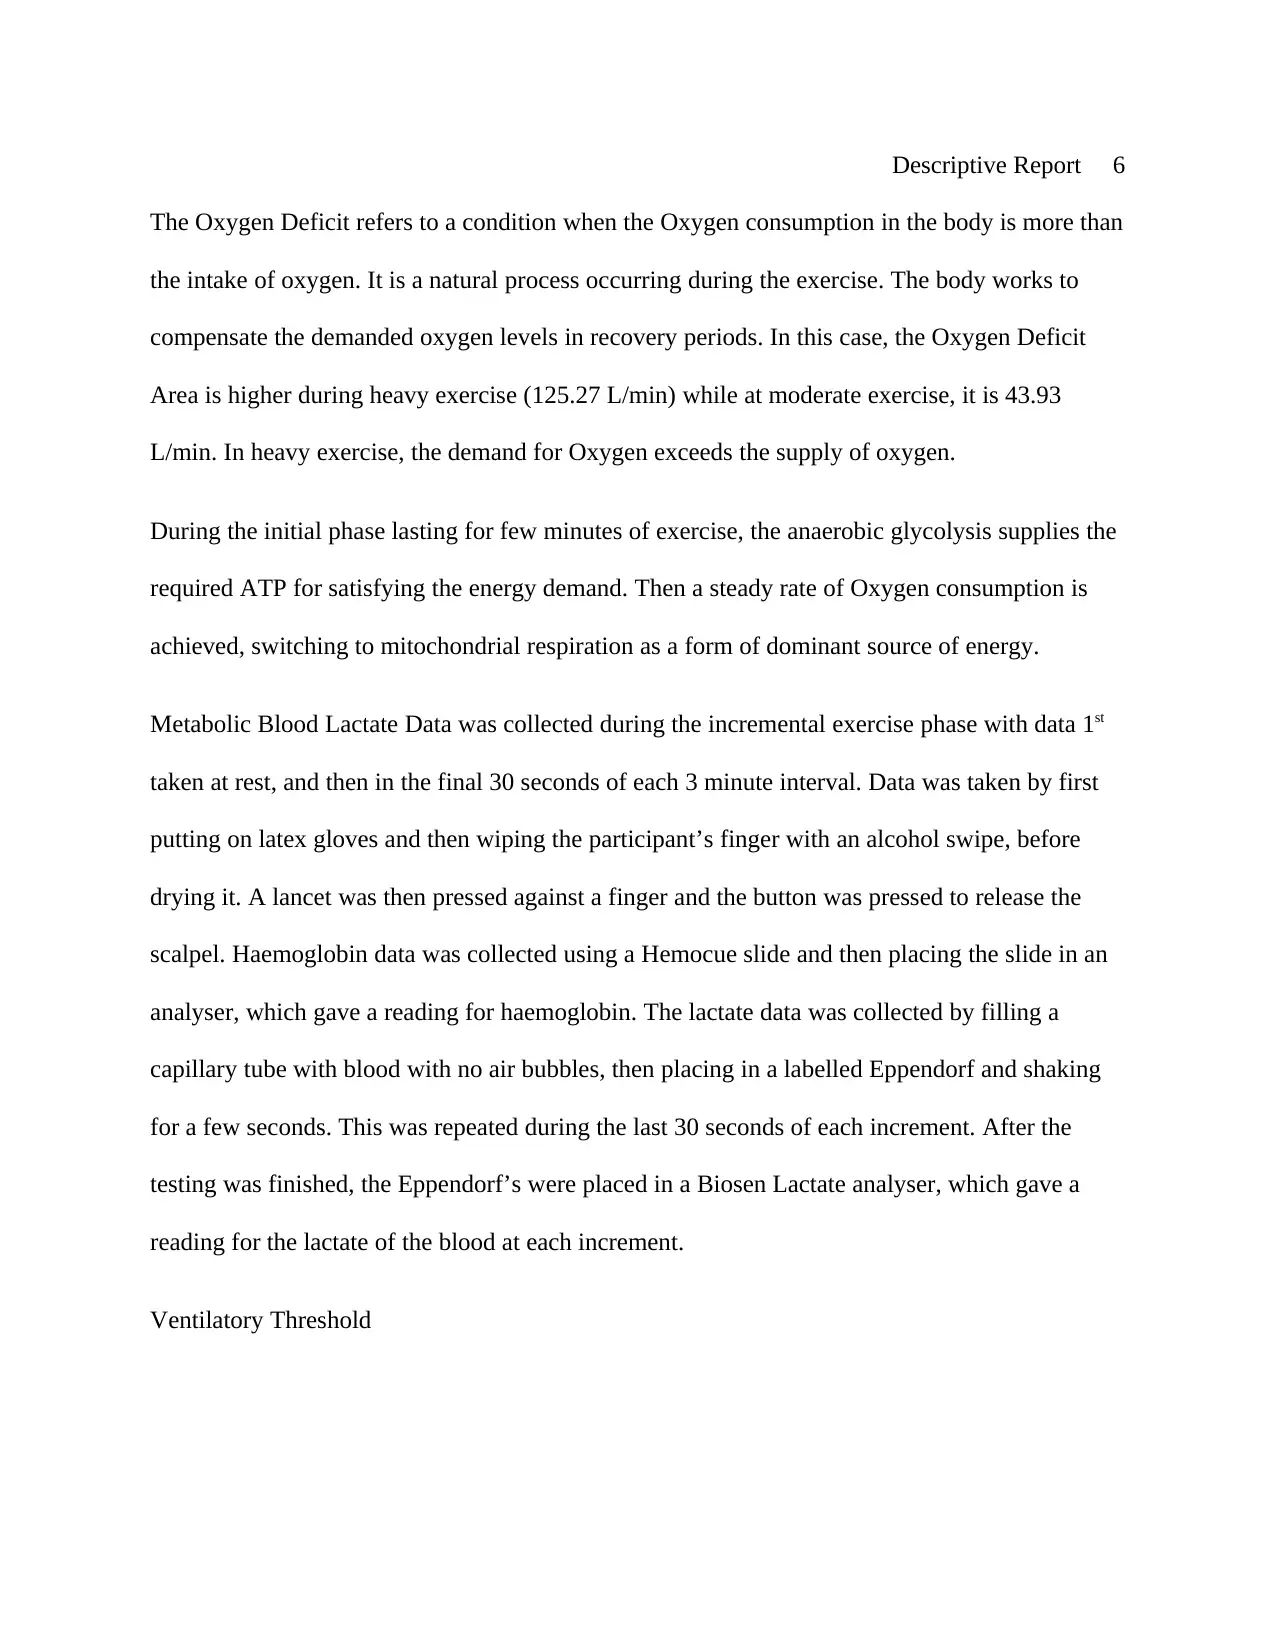
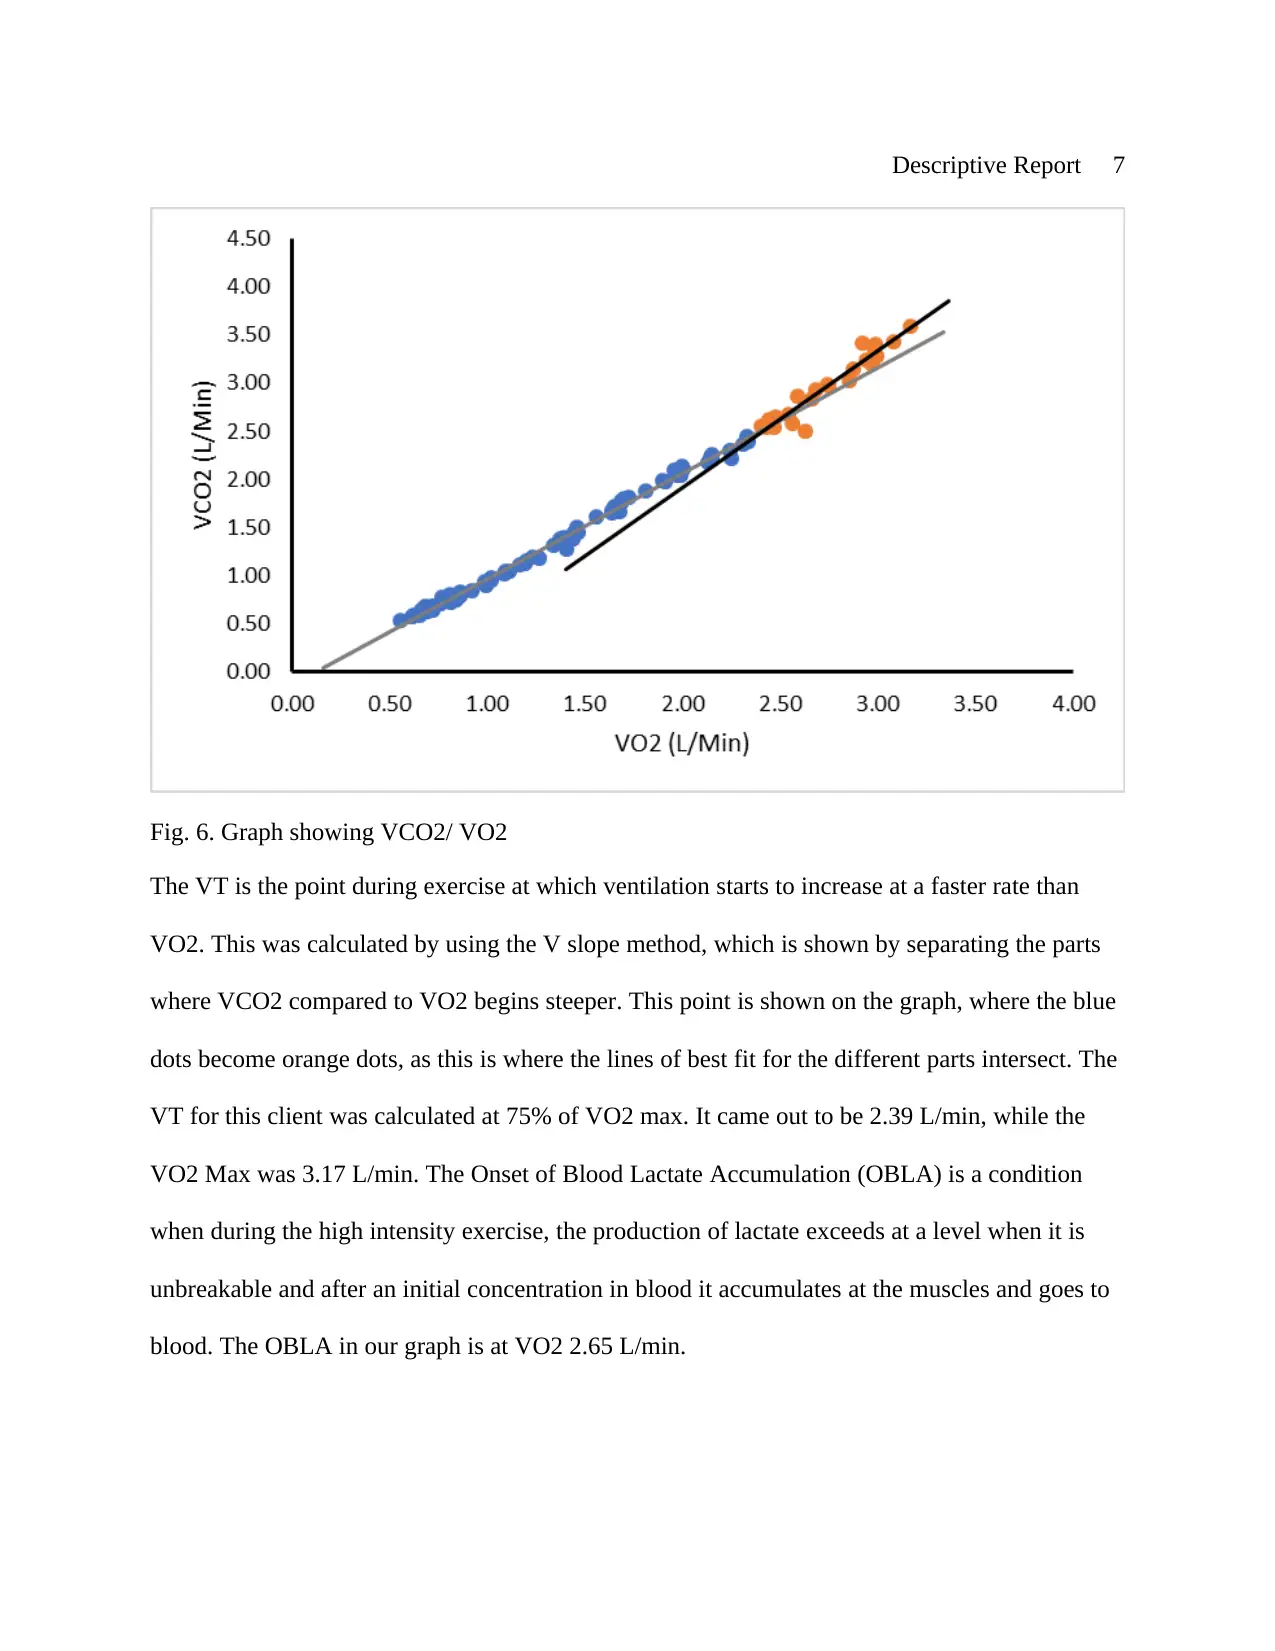
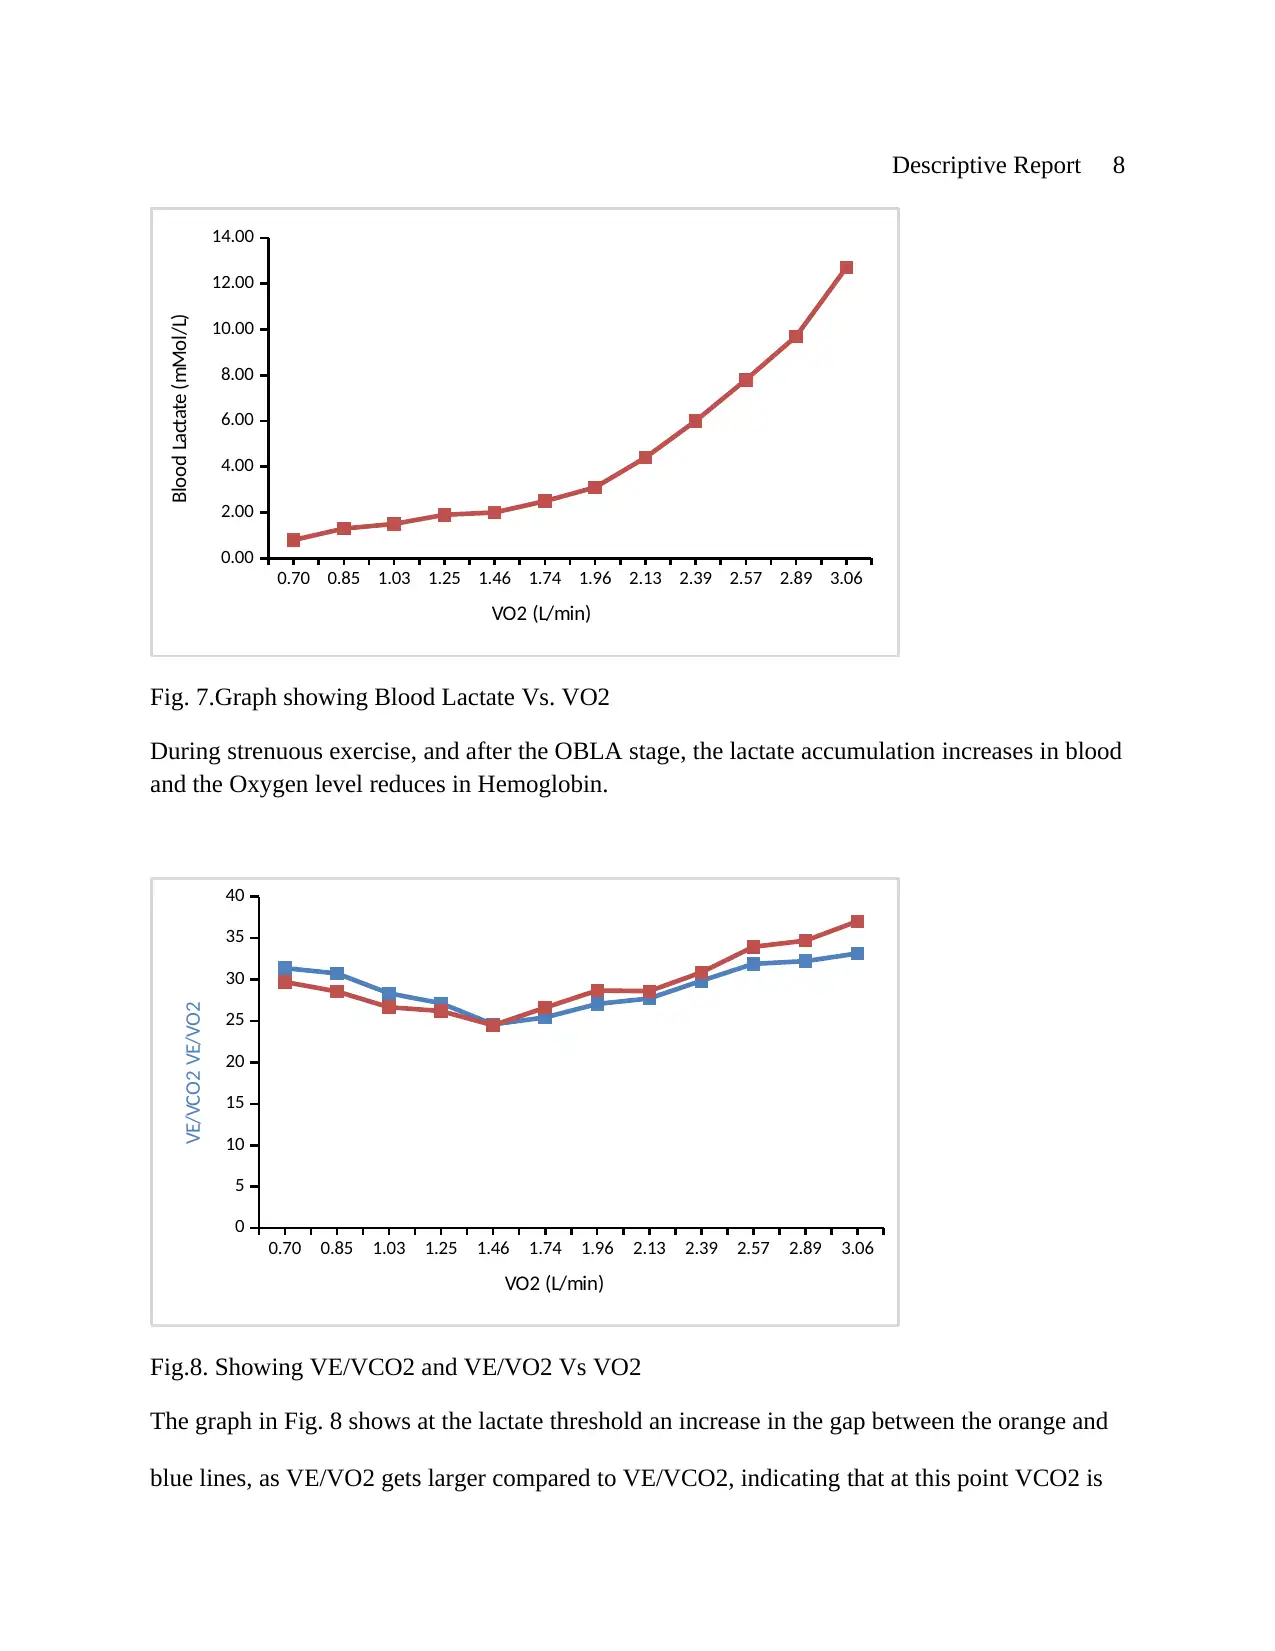
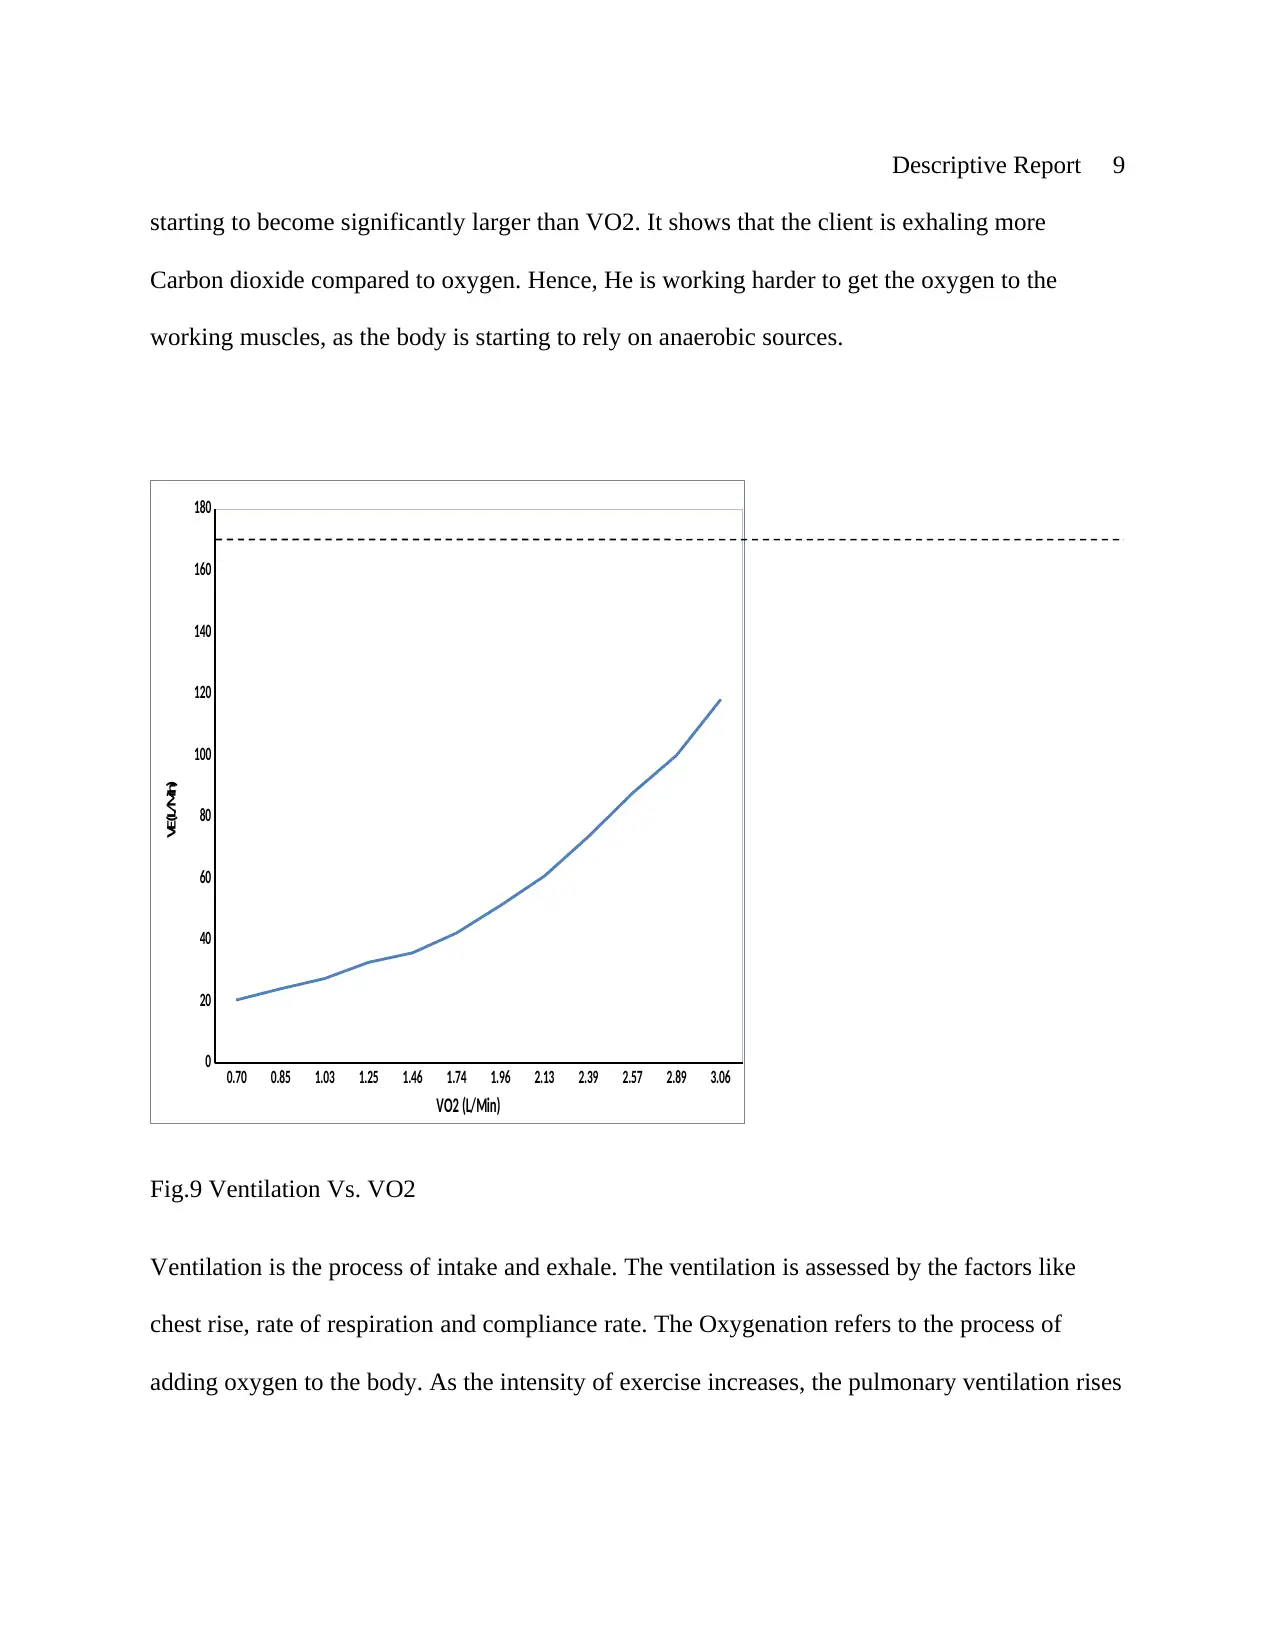
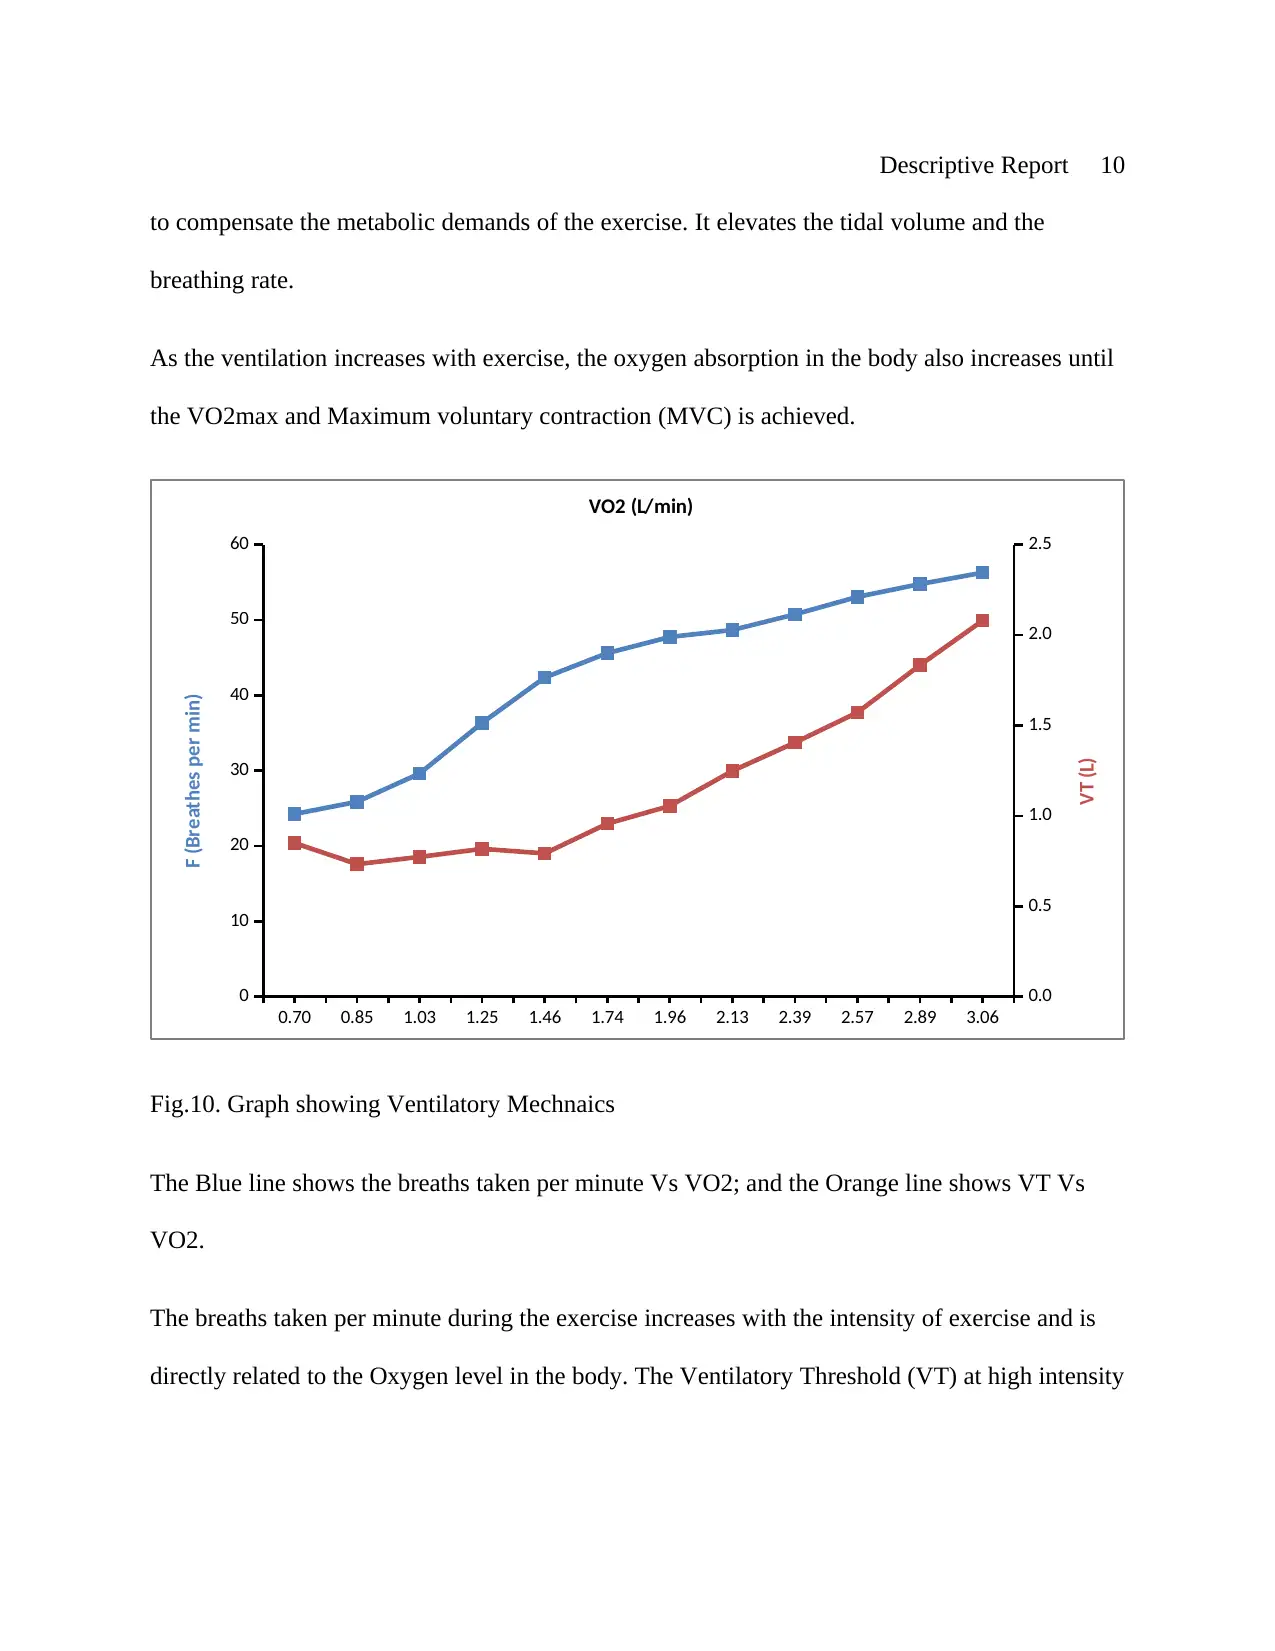
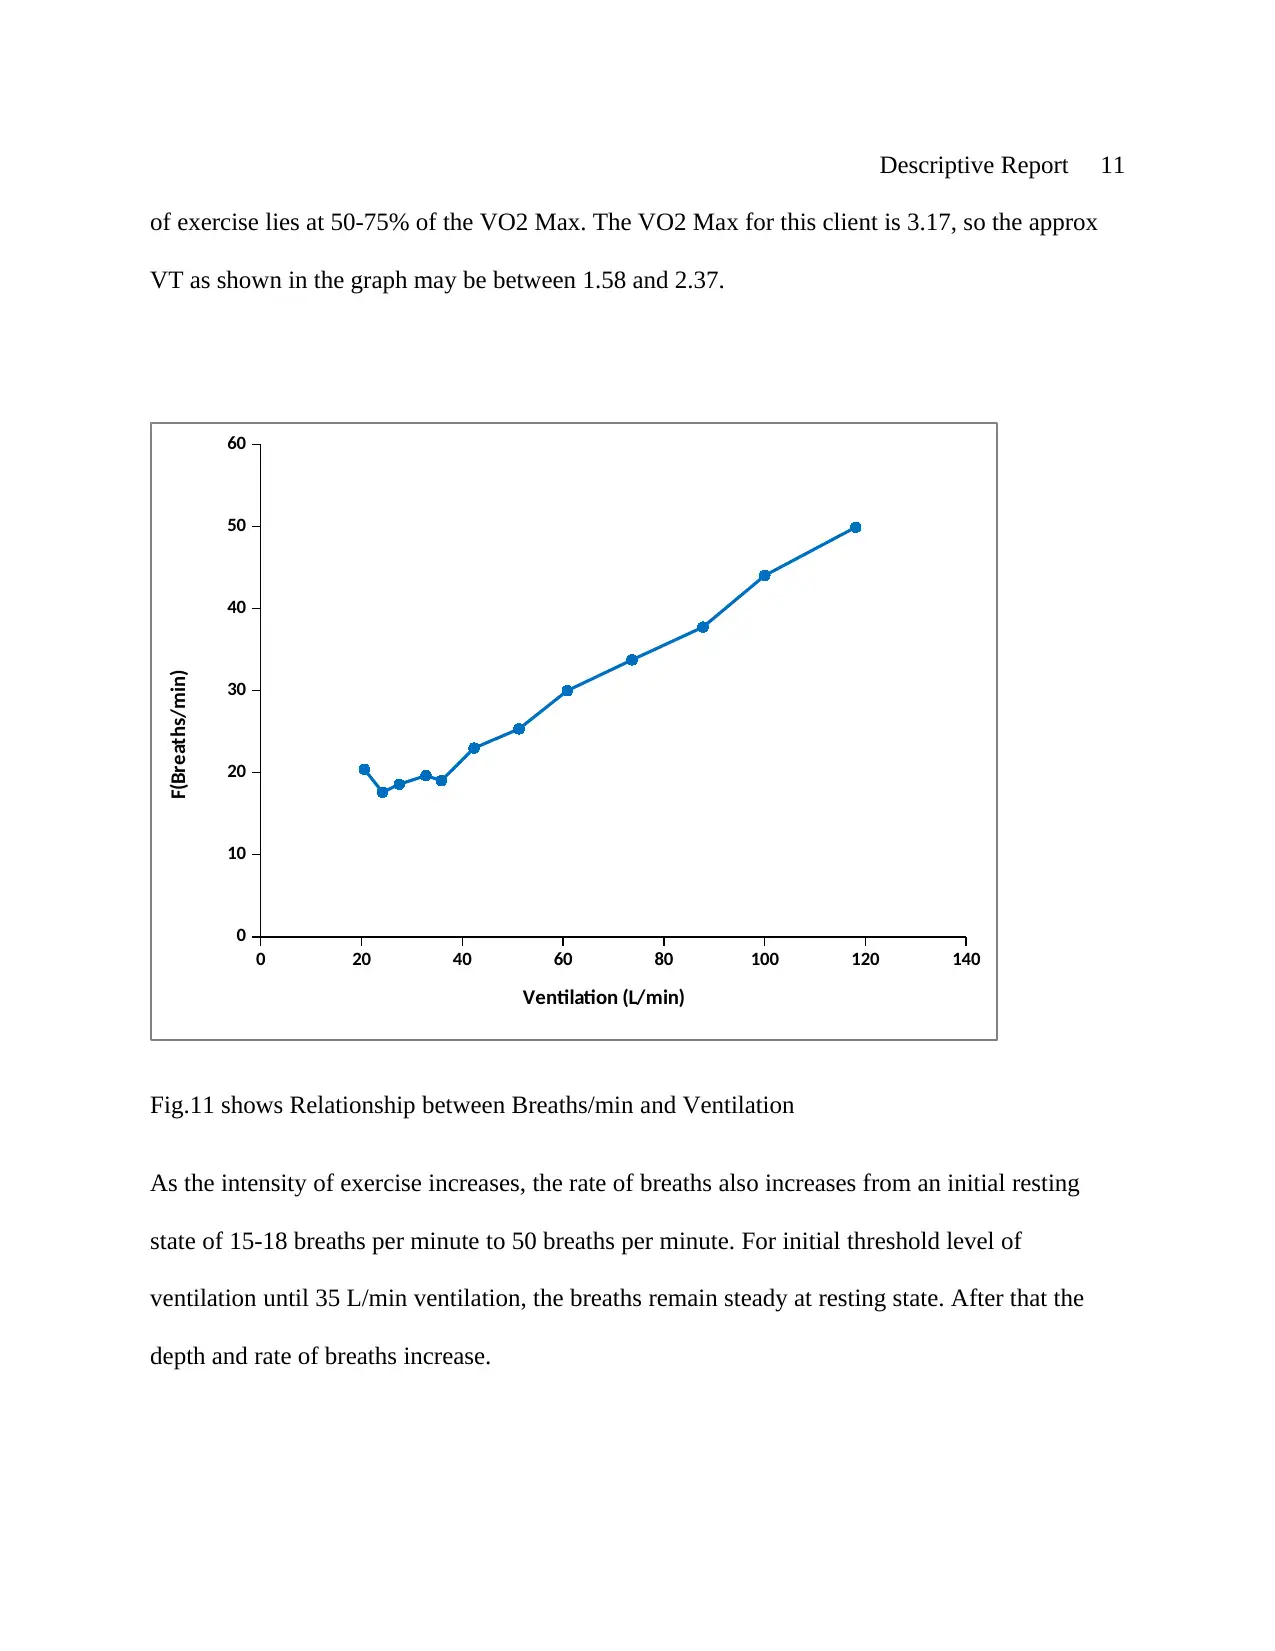
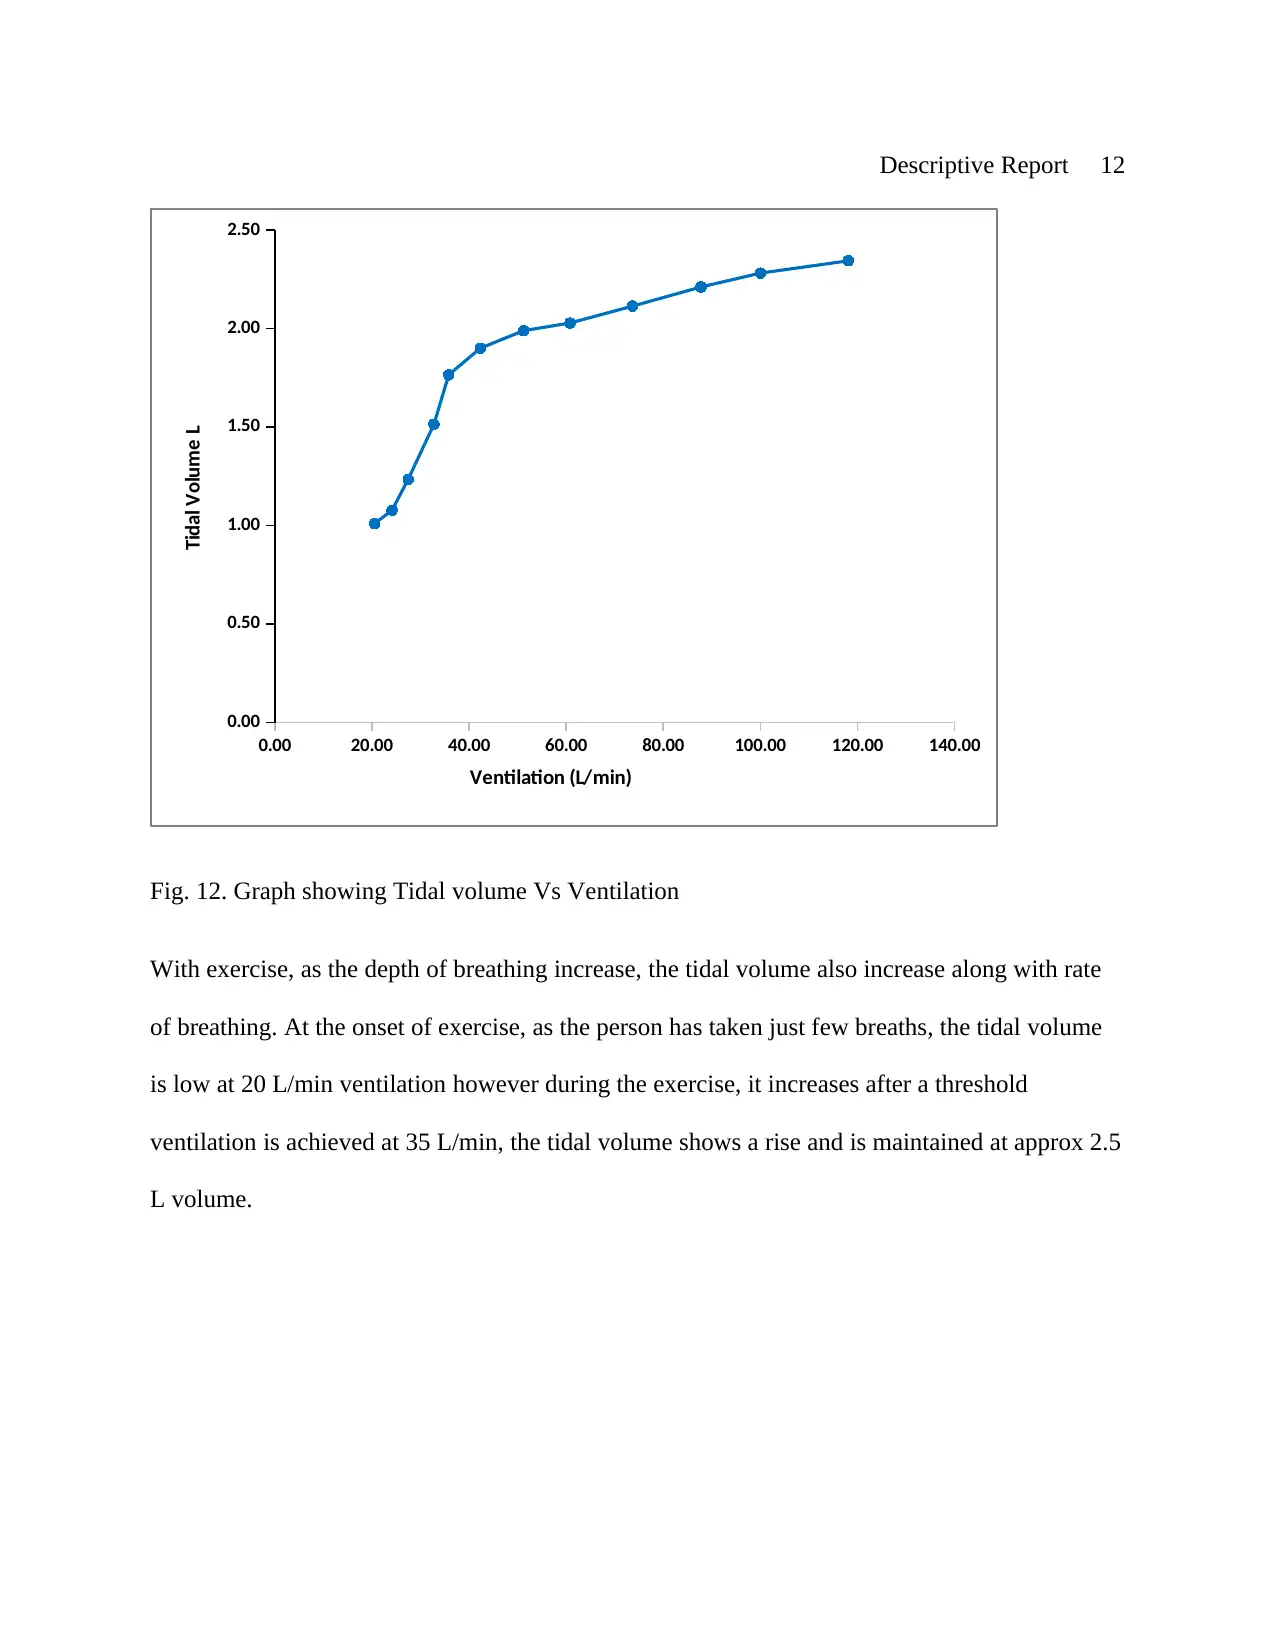
This descriptive report presents an analysis of cardiopulmonary exercise testing (CPET) performed on a 19-year-old healthy male, examining both incremental and steady-state exercise protocols. The report details the methods, including the 2-minute incremental cycle ergometry protocol and the constant work rate (CWR) protocol, and presents key findings such as VO2 max, predicted and achieved work rates, and VO2 slope. It explores ventilatory mechanics, including the ventilatory threshold (VT), the onset of blood lactate accumulation (OBLA), and the relationship between ventilation, tidal volume, and dyspnea during exercise. The report also discusses the changes in heart rate during incremental exercise and compares heart rate responses during moderate and heavy exercise. Furthermore, the report includes an analysis of metabolic blood lactate data, ventilatory mechanics, and the patient's dyspnea response during exercise. The findings provide insights into the physiological responses to exercise, including cardiovascular, pulmonary, and metabolic adaptations.
Document Page
Descriptive Report
Topic: Cardiopulmonary Exercise Testing at Incremental and Steady state Exercise
Name:
Institutional Affiliations
tabler-icon-diamond-filled.svg

Paraphrase This Document

Need a fresh take? Get an instant paraphrase of this document with our AI Paraphraser
Document Page
Descriptive Report 2
Cardiopulmonary Exercise Testing (CPET) is an essential clinical tool to analyze the
functional capacity and exercise intolerance in patients with cardiac problems (Datta, 2015).
CPET assess the integrated response of body to the exercise including cardiovascular,
pulmonary, neuropsychological, haematopoietic and skeletal muscle system (Howard & Wensel,
2012).
We, performed CPET at incremental and steady state exercise on a 19 year old healthy male,
with height 174 cm, weight 69 kg, FEV1 of 4.29 L and Resting Hemoglobin Level 148 g/L.
Fig.1. 2 min incremental protocol for cycle ergometry
During the incremental state exercise protocol, the client was evaluated every 30 W/ 2 minutes.
It involved the variables like initial starting rate, rate of consecutive works, the number of
increments and the duration of every increment. After an initial aerobic phase of 195 seconds,
Document Page
Descriptive Report 3
the threshold for oxygen intake is reached and the expired work load increased in linear manner
along with time.
0.00 30.00 60.00 90.00 120.00 150.00 180.00 210.00 240.00 270.00 300.00 330.00
0.00
0.50
1.00
1.50
2.00
2.50
3.00
3.50
Work rate (W)
VO2 (litres.min-1)
Fig.2
Maximal Oxygen consumption is the oxygen intake that reaches a maximum level, beyond
which no increase in the exercise efforts can increase it (Hawkins et al., 2007). In this case V O2
max was achieved at 3.06 L/min at a work rate of 330 W.
The Predicted Equations for Maximal Oxygen Consumption and Work rate for the client is as
follows:
■ MEN – Predicted ⩒O2max (L/min) = (3.45* Height in cm /100) -(0.028* Age in years)
+(0.022* Weight in Kg)-3.76
â–  Predicted = 3.22 L/min
â–  Actual = 3.06 L/min
Document Page
Descriptive Report 4
â–  Achieved = 95.03%
■ MEN – Predicted Maximum Work Rate (Watts) - Bike = ((2169* Height cm /100) -
(9.63* Age in years) +(4* Weight in Kg)-2413)/6.1
â–  Predicted = 238 W
â–  Actual = 330 W
â–  Achieved = 138.66%
0 30 60 90 120 150 180 210 240 270 300 330 360
0
5
10
15
20
25
30
35
40
45
50
VO2 Max Relative to Body Weight
Work Rate (W)
VO2 (ml/min)
Fig.3. VO2 Max relative to Body Weight
The client has the age of 19 years and relative to the body weight (69 kg), the VO2 Max was
44.30 ml/kg/min. According to Maximal Oxygen Uptake Norms, this value reflects an Average
health condition in men of this age group.
tabler-icon-diamond-filled.svg

Paraphrase This Document

Need a fresh take? Get an instant paraphrase of this document with our AI Paraphraser
Document Page
Descriptive Report 5
The VO2 slope reflects the amount of oxygen consumed per heart beat. During the incremental
exercise, the oxygen slope expressed as linear slope in which the VO2 increases with work rate
reaching at a maximum value of 7.75 ml/ min/W, relative to body weight.
0.00 1.00 2.00 3.00 4.00 5.00 6.00 7.00 8.00 9.00
0.00
0.50
1.00
1.50
2.00
2.50
3.00
VO2 Max During CWR Protocol
Moderate Heavy
Time (min)
VO2 (L/min)
Fig. 4. VO2 Max during CWR(Constant Work Rate) protocol
The Constant Work Rate Protocol starts with 1-3 minute (here 2 minute) time period of warm up
and unloaded pedaling (Albouaini & Wright, 2007). After that the workload is elevated to a high
level of maximal work rate of the patient. The exercise activity is maintained at a maximum
level. The breadth by breadth evaluation of inspired and expired Oxygen and CO2 volume is
estimated. The graph shows that during heavy exercise, the VO2 max increased by approx. 1
L/min than in moderate exercise activity.
Document Page
Descriptive Report 6
The Oxygen Deficit refers to a condition when the Oxygen consumption in the body is more than
the intake of oxygen. It is a natural process occurring during the exercise. The body works to
compensate the demanded oxygen levels in recovery periods. In this case, the Oxygen Deficit
Area is higher during heavy exercise (125.27 L/min) while at moderate exercise, it is 43.93
L/min. In heavy exercise, the demand for Oxygen exceeds the supply of oxygen.
During the initial phase lasting for few minutes of exercise, the anaerobic glycolysis supplies the
required ATP for satisfying the energy demand. Then a steady rate of Oxygen consumption is
achieved, switching to mitochondrial respiration as a form of dominant source of energy.
Metabolic Blood Lactate Data was collected during the incremental exercise phase with data 1st
taken at rest, and then in the final 30 seconds of each 3 minute interval. Data was taken by first
putting on latex gloves and then wiping the participant’s finger with an alcohol swipe, before
drying it. A lancet was then pressed against a finger and the button was pressed to release the
scalpel. Haemoglobin data was collected using a Hemocue slide and then placing the slide in an
analyser, which gave a reading for haemoglobin. The lactate data was collected by filling a
capillary tube with blood with no air bubbles, then placing in a labelled Eppendorf and shaking
for a few seconds. This was repeated during the last 30 seconds of each increment. After the
testing was finished, the Eppendorf’s were placed in a Biosen Lactate analyser, which gave a
reading for the lactate of the blood at each increment.
Ventilatory Threshold
Document Page
Descriptive Report 7
Fig. 6. Graph showing VCO2/ VO2
The VT is the point during exercise at which ventilation starts to increase at a faster rate than
VO2. This was calculated by using the V slope method, which is shown by separating the parts
where VCO2 compared to VO2 begins steeper. This point is shown on the graph, where the blue
dots become orange dots, as this is where the lines of best fit for the different parts intersect. The
VT for this client was calculated at 75% of VO2 max. It came out to be 2.39 L/min, while the
VO2 Max was 3.17 L/min. The Onset of Blood Lactate Accumulation (OBLA) is a condition
when during the high intensity exercise, the production of lactate exceeds at a level when it is
unbreakable and after an initial concentration in blood it accumulates at the muscles and goes to
blood. The OBLA in our graph is at VO2 2.65 L/min.
tabler-icon-diamond-filled.svg

Paraphrase This Document

Need a fresh take? Get an instant paraphrase of this document with our AI Paraphraser
Document Page
Descriptive Report 8
0.70 0.85 1.03 1.25 1.46 1.74 1.96 2.13 2.39 2.57 2.89 3.06
0.00
2.00
4.00
6.00
8.00
10.00
12.00
14.00
VO2 (L/min)
Blood Lactate (mMol/L)
Fig. 7.Graph showing Blood Lactate Vs. VO2
During strenuous exercise, and after the OBLA stage, the lactate accumulation increases in blood
and the Oxygen level reduces in Hemoglobin.
0.70 0.85 1.03 1.25 1.46 1.74 1.96 2.13 2.39 2.57 2.89 3.06
0
5
10
15
20
25
30
35
40
VO2 (L/min)
VE/VCO2 VE/VO2
Fig.8. Showing VE/VCO2 and VE/VO2 Vs VO2
The graph in Fig. 8 shows at the lactate threshold an increase in the gap between the orange and
blue lines, as VE/VO2 gets larger compared to VE/VCO2, indicating that at this point VCO2 is
Document Page
Descriptive Report 9
starting to become significantly larger than VO2. It shows that the client is exhaling more
Carbon dioxide compared to oxygen. Hence, He is working harder to get the oxygen to the
working muscles, as the body is starting to rely on anaerobic sources.
0.70 0.85 1.03 1.25 1.46 1.74 1.96 2.13 2.39 2.57 2.89 3.06
0
20
40
60
80
100
120
140
160
180
VO2 (L/Min)
VE(L/Min)
Fig.9 Ventilation Vs. VO2
Ventilation is the process of intake and exhale. The ventilation is assessed by the factors like
chest rise, rate of respiration and compliance rate. The Oxygenation refers to the process of
adding oxygen to the body. As the intensity of exercise increases, the pulmonary ventilation rises
Document Page
Descriptive Report 10
to compensate the metabolic demands of the exercise. It elevates the tidal volume and the
breathing rate.
As the ventilation increases with exercise, the oxygen absorption in the body also increases until
the VO2max and Maximum voluntary contraction (MVC) is achieved.
0.70 0.85 1.03 1.25 1.46 1.74 1.96 2.13 2.39 2.57 2.89 3.06
0
10
20
30
40
50
60
0.0
0.5
1.0
1.5
2.0
2.5
F (Breathes per min)
VO2 (L/min)
VT (L)
Fig.10. Graph showing Ventilatory Mechnaics
The Blue line shows the breaths taken per minute Vs VO2; and the Orange line shows VT Vs
VO2.
The breaths taken per minute during the exercise increases with the intensity of exercise and is
directly related to the Oxygen level in the body. The Ventilatory Threshold (VT) at high intensity
tabler-icon-diamond-filled.svg

Paraphrase This Document

Need a fresh take? Get an instant paraphrase of this document with our AI Paraphraser
Document Page
Descriptive Report 11
of exercise lies at 50-75% of the VO2 Max. The VO2 Max for this client is 3.17, so the approx
VT as shown in the graph may be between 1.58 and 2.37.
0 20 40 60 80 100 120 140
0
10
20
30
40
50
60
Ventilation (L/min)
F(Breaths/min)
Fig.11 shows Relationship between Breaths/min and Ventilation
As the intensity of exercise increases, the rate of breaths also increases from an initial resting
state of 15-18 breaths per minute to 50 breaths per minute. For initial threshold level of
ventilation until 35 L/min ventilation, the breaths remain steady at resting state. After that the
depth and rate of breaths increase.
Document Page
Descriptive Report 12
0.00 20.00 40.00 60.00 80.00 100.00 120.00 140.00
0.00
0.50
1.00
1.50
2.00
2.50
Ventilation (L/min)
Tidal Volume L
Fig. 12. Graph showing Tidal volume Vs Ventilation
With exercise, as the depth of breathing increase, the tidal volume also increase along with rate
of breathing. At the onset of exercise, as the person has taken just few breaths, the tidal volume
is low at 20 L/min ventilation however during the exercise, it increases after a threshold
ventilation is achieved at 35 L/min, the tidal volume shows a rise and is maintained at approx 2.5
L volume.
chevron_up_icon
1 out of 21
circle_padding
hide_on_mobile
zoom_out_icon
[object Object]