Statistics Report: Analysis of Career Prospects and Data

Verified

Added on  2020/05/11

|6
|726
|32
Report
AI Summary
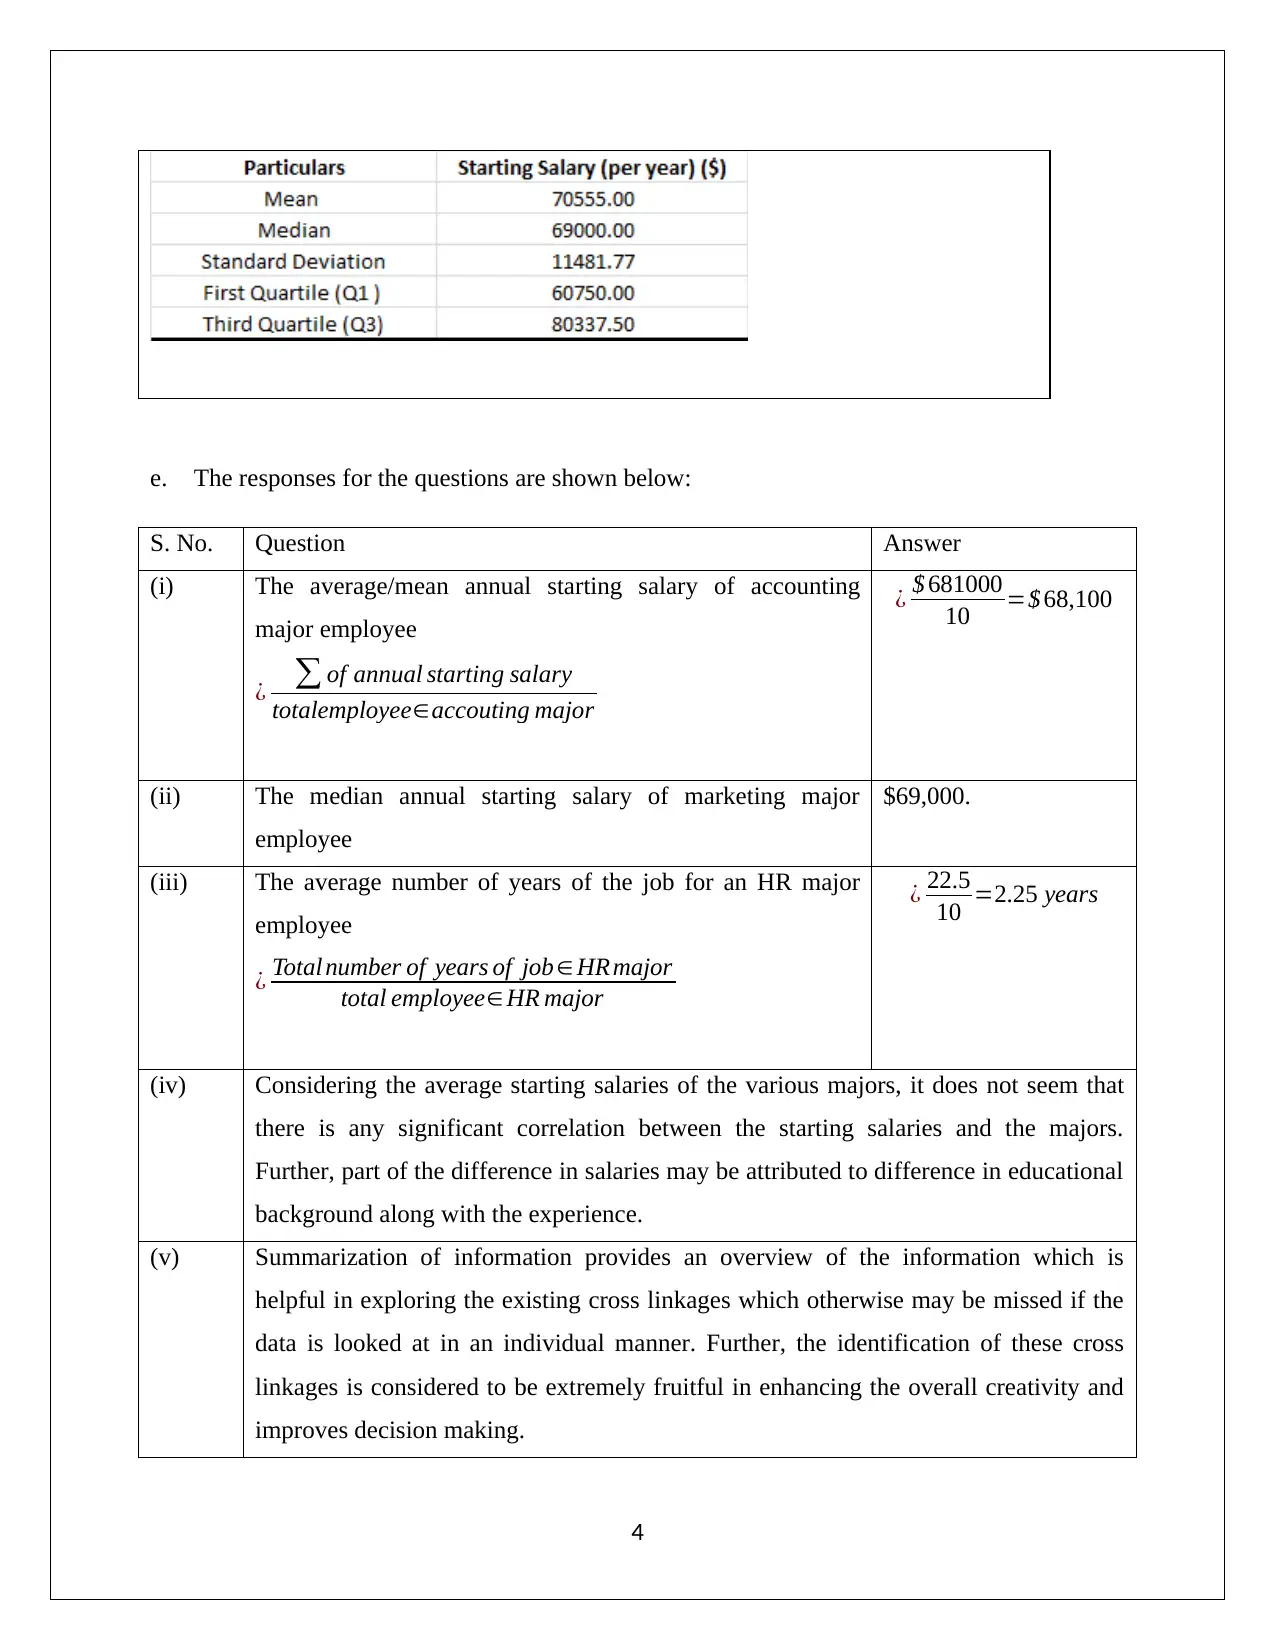
This report presents a statistical analysis of various data points related to career prospects, focusing on accounting, HR, and marketing. It begins by identifying and classifying variables as either qualitative or quantitative, and then provides frequency tables for qualitative variables, and numeric summaries for quantitative variables such as starting salary and previous experience. The report addresses specific questions regarding average salaries and the impact of majors and education backgrounds. The findings indicate that education background appears to be a more significant determinant of starting salary than the chosen major. The report concludes by acknowledging the limitations of the study due to the small sample size and recommends a larger dataset for more comprehensive insights. The aim is to help students make informed career choices. The analysis includes details on salary, experience, and education backgrounds of staff members.
Document Page
Introduction To Statistics
[Pick the date]
Student id & Name
tabler-icon-diamond-filled.svg

Paraphrase This Document

Need a fresh take? Get an instant paraphrase of this document with our AI Paraphraser
Document Page
PART 1
a. The set of qualitative variables and quantitative variables from the given data variables are
shown below:
Qualitative variables (variables which are having non- numeric set of data)
Major
Education background
Quantitative variables (variables which are having numeric set of data)
Starting Salary (per year)
Previous Experience (in years)
Major has a non-numeric data and hence, it is a qualitative variable.
Education background has a non-numeric data and hence, it is a qualitative variable.
Starting Salary (per year) has a numeric data and hence, it is a quantitative variable. Moreover,
it is noteworthy that salary data does not have any decimal and therefore, the data would be
classified as discrete.
Previous Experience (in years) has a numeric data and hence, it is a quantitative variable.
Moreover, it is noteworthy that salary data have decimals and therefore, the data would be
classified as continuous.
b. Frequency tables for qualitative variables
Frequency tables for Major
1
Document Page
Frequency tables for Education background
c. Pie chart and bar charts based on the frequency distribution table for variables major and
education background is represented below:
Frequency tables for Major
Frequency tables for Education background
2
Document Page
d. The respective numeric summary for previous experience (in years) and starting salary (per
years) is highlighted below:
Numeric summary for previous experience (in years)
Numeric summary for starting salary (per years)
3
tabler-icon-diamond-filled.svg

Paraphrase This Document

Need a fresh take? Get an instant paraphrase of this document with our AI Paraphraser
Document Page
e. The responses for the questions are shown below:
S. No. Question Answer
(i) The average/mean annual starting salary of accounting
major employee
¿ of annual starting salary
totalemployeeaccouting major
¿ $ 681000
10 =$ 68,100
(ii) The median annual starting salary of marketing major
employee
$69,000.
(iii) The average number of years of the job for an HR major
employee
¿ Total number of years of job HR major
total employee HR major
¿ 22.5
10 =2.25 years
(iv) Considering the average starting salaries of the various majors, it does not seem that
there is any significant correlation between the starting salaries and the majors.
Further, part of the difference in salaries may be attributed to difference in educational
background along with the experience.
(v) Summarization of information provides an overview of the information which is
helpful in exploring the existing cross linkages which otherwise may be missed if the
data is looked at in an individual manner. Further, the identification of these cross
linkages is considered to be extremely fruitful in enhancing the overall creativity and
improves decision making.
4
Document Page
PART 2
Summary
The aim of this report is to outline the career prospects in relation to the chosen three major
fields i.e. accounting, HR and marketing. This would be proving useful for students who can use
the findings of the report to make career selections in a more prudent manner so as to have a
better career going forward. The requisite information for this is obtained from 30 members of
staff and this captures various variables such as starting salary, experience and education
background.
The given data suggests that a majority of respondents have earned a college degree while MBA
also seems to be popular considering sizable representation. Further, the respondent which has a
higher degree also receives higher starting salary as MBA holders receive the maximum
beginning salary and diploma holders receive the minimum salary. The average starting salary on
an annual basis for the given majors tend to range in the interval $ 68,000 - $ 75,000. But the
critical factor of salary seems to be the underlying education background rather than the major
field. However, in terms of major marketing seems to have a slight edge which may not represent
any significant deviation from other majors.
But the conclusions drawn from this study should be taken with caution owing to the sample
being very limited in size and hence for greater insights into the various aspects a larger data set
may be recommended. However, within the limited purview of the given data there seems to be
evidence of education background emerging as a critical parameter for determining the starting
salary unlike the majors which does not seem critical.
5
chevron_up_icon
1 out of 6
circle_padding
hide_on_mobile
zoom_out_icon
[object Object]