Economics Report: A Detailed Analysis of Carnival Cruise Lines
VerifiedAdded on 2023/01/20
|12
|2598
|29
Report
AI Summary
This report provides an in-depth economic analysis of Carnival Cruise Lines, examining its performance, market share, and competitive landscape. The study begins with an overview of Carnival's global operations, highlighting its diverse cruise line brands and market positions. It analyzes revenue streams, profit margins, and key financial data, comparing Carnival's performance against its main competitors, such as Royal Caribbean. The report delves into the company's macroeconomic and market exposures, including the impact of exchange rates and global economic shocks. A SWOT analysis is presented to evaluate Carnival's strengths, weaknesses, opportunities, and threats. The pricing strategies employed by Carnival are also examined, with a focus on price differentiation and elasticity in the cruise industry. The report concludes by assessing the company's vulnerability to various economic, social, and environmental factors, offering insights into its ability to withstand future challenges. The analysis draws on economic theories and data to assess the effectiveness of Carnival's business strategies, especially considering its conduct during the 2008/2009 financial crisis.

Economics 1
Carnival Cruise Lines
By [Name]
Course
Professor’s Name
Institution
Location of Institution
Date
Carnival Cruise Lines
By [Name]
Course
Professor’s Name
Institution
Location of Institution
Date
Paraphrase This Document
Need a fresh take? Get an instant paraphrase of this document with our AI Paraphraser
Economics 2
Background of the Study
Carnival Cruise Lines is one of the largest cruise lines with its headquarters in Florida.
The company has been able to operate a global portfolio cruise line brands that include Costa
Cruises in Genoa, Italy with the market share value of 68 percent; P&O Cruises and Cunard,
both in England where it has a 47 percent global market share of the cruise lines industry; AIDA
Cruises in Rostock, Germany where it has 51 percent of the market shares; Princess Cruises,
Carnival Cruise Line, Holland America Line, and Seabourn in North America where it has 51
percent of the total cruise line market shares; and P&O Cruises in Australia where it has 68
percent of the total cruise line market share (Jones et al., 2017). Moreover, the company has been
able to operate Holland America Princess Alaska, a tour company that helps to complement its
cruise maneuver in Alaska and the Yukon.
The company provides work for over 130,000 people globally with 11 cruise line brands
that attract approximately 15 million guests annually. The daily cruise guests that boards the
Carnival ship is approximated at 225,000, and 120,000 shipboard employees that totals to
345,000 people daily on the Carnival Corporation. According to Jones et al (2017), in the year
2018, Carnival Cruise Line was estimated to hold nine percent share of cruise industry revenue.
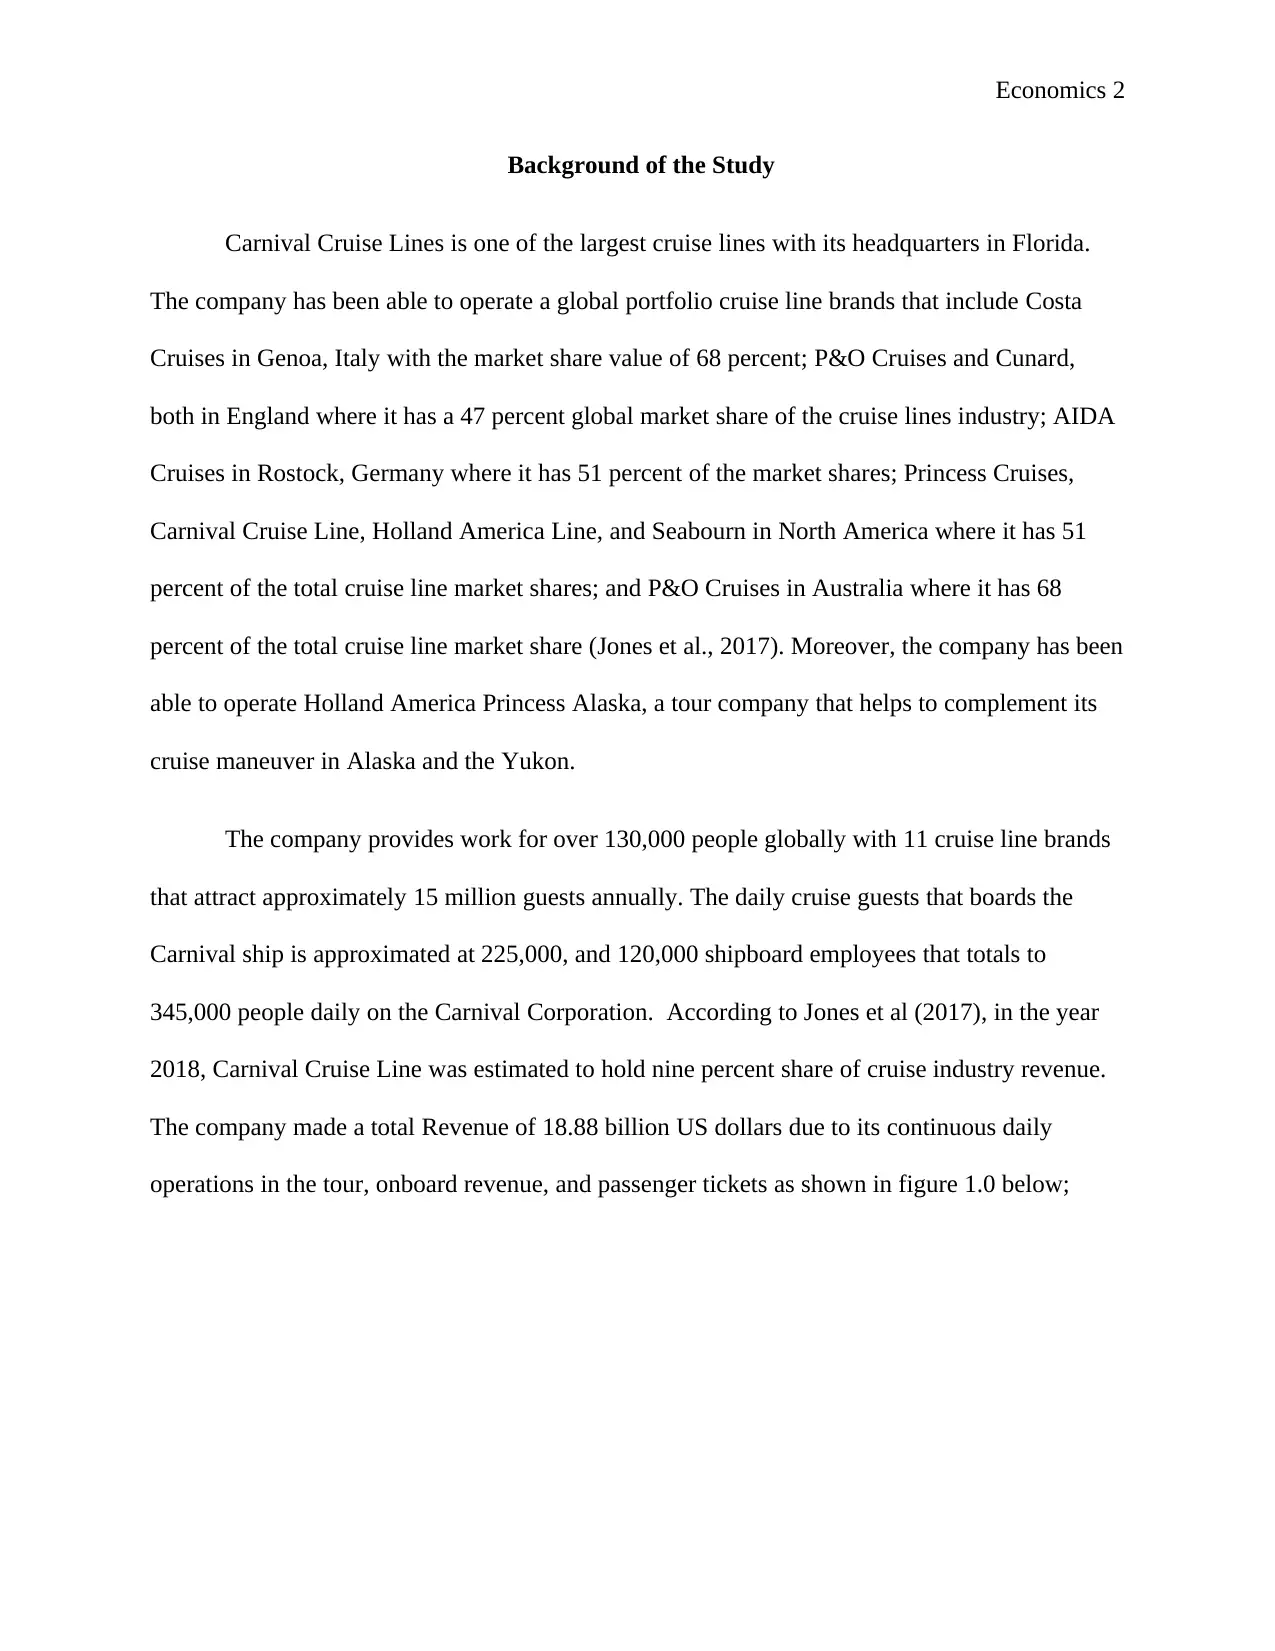
The company made a total Revenue of 18.88 billion US dollars due to its continuous daily
operations in the tour, onboard revenue, and passenger tickets as shown in figure 1.0 below;
Background of the Study
Carnival Cruise Lines is one of the largest cruise lines with its headquarters in Florida.
The company has been able to operate a global portfolio cruise line brands that include Costa
Cruises in Genoa, Italy with the market share value of 68 percent; P&O Cruises and Cunard,
both in England where it has a 47 percent global market share of the cruise lines industry; AIDA
Cruises in Rostock, Germany where it has 51 percent of the market shares; Princess Cruises,
Carnival Cruise Line, Holland America Line, and Seabourn in North America where it has 51
percent of the total cruise line market shares; and P&O Cruises in Australia where it has 68
percent of the total cruise line market share (Jones et al., 2017). Moreover, the company has been
able to operate Holland America Princess Alaska, a tour company that helps to complement its
cruise maneuver in Alaska and the Yukon.
The company provides work for over 130,000 people globally with 11 cruise line brands
that attract approximately 15 million guests annually. The daily cruise guests that boards the
Carnival ship is approximated at 225,000, and 120,000 shipboard employees that totals to
345,000 people daily on the Carnival Corporation. According to Jones et al (2017), in the year
2018, Carnival Cruise Line was estimated to hold nine percent share of cruise industry revenue.
The company made a total Revenue of 18.88 billion US dollars due to its continuous daily
operations in the tour, onboard revenue, and passenger tickets as shown in figure 1.0 below;
Economics 3
The diagram above illustrates that the passenger ticket is very core in the daily revenue
earnings of the Carnival Cruise Lines (CCL) where it takes an approximated 75 percent while
onboard and other services covers for the 24 percent of the revenue, and the tour activities takes
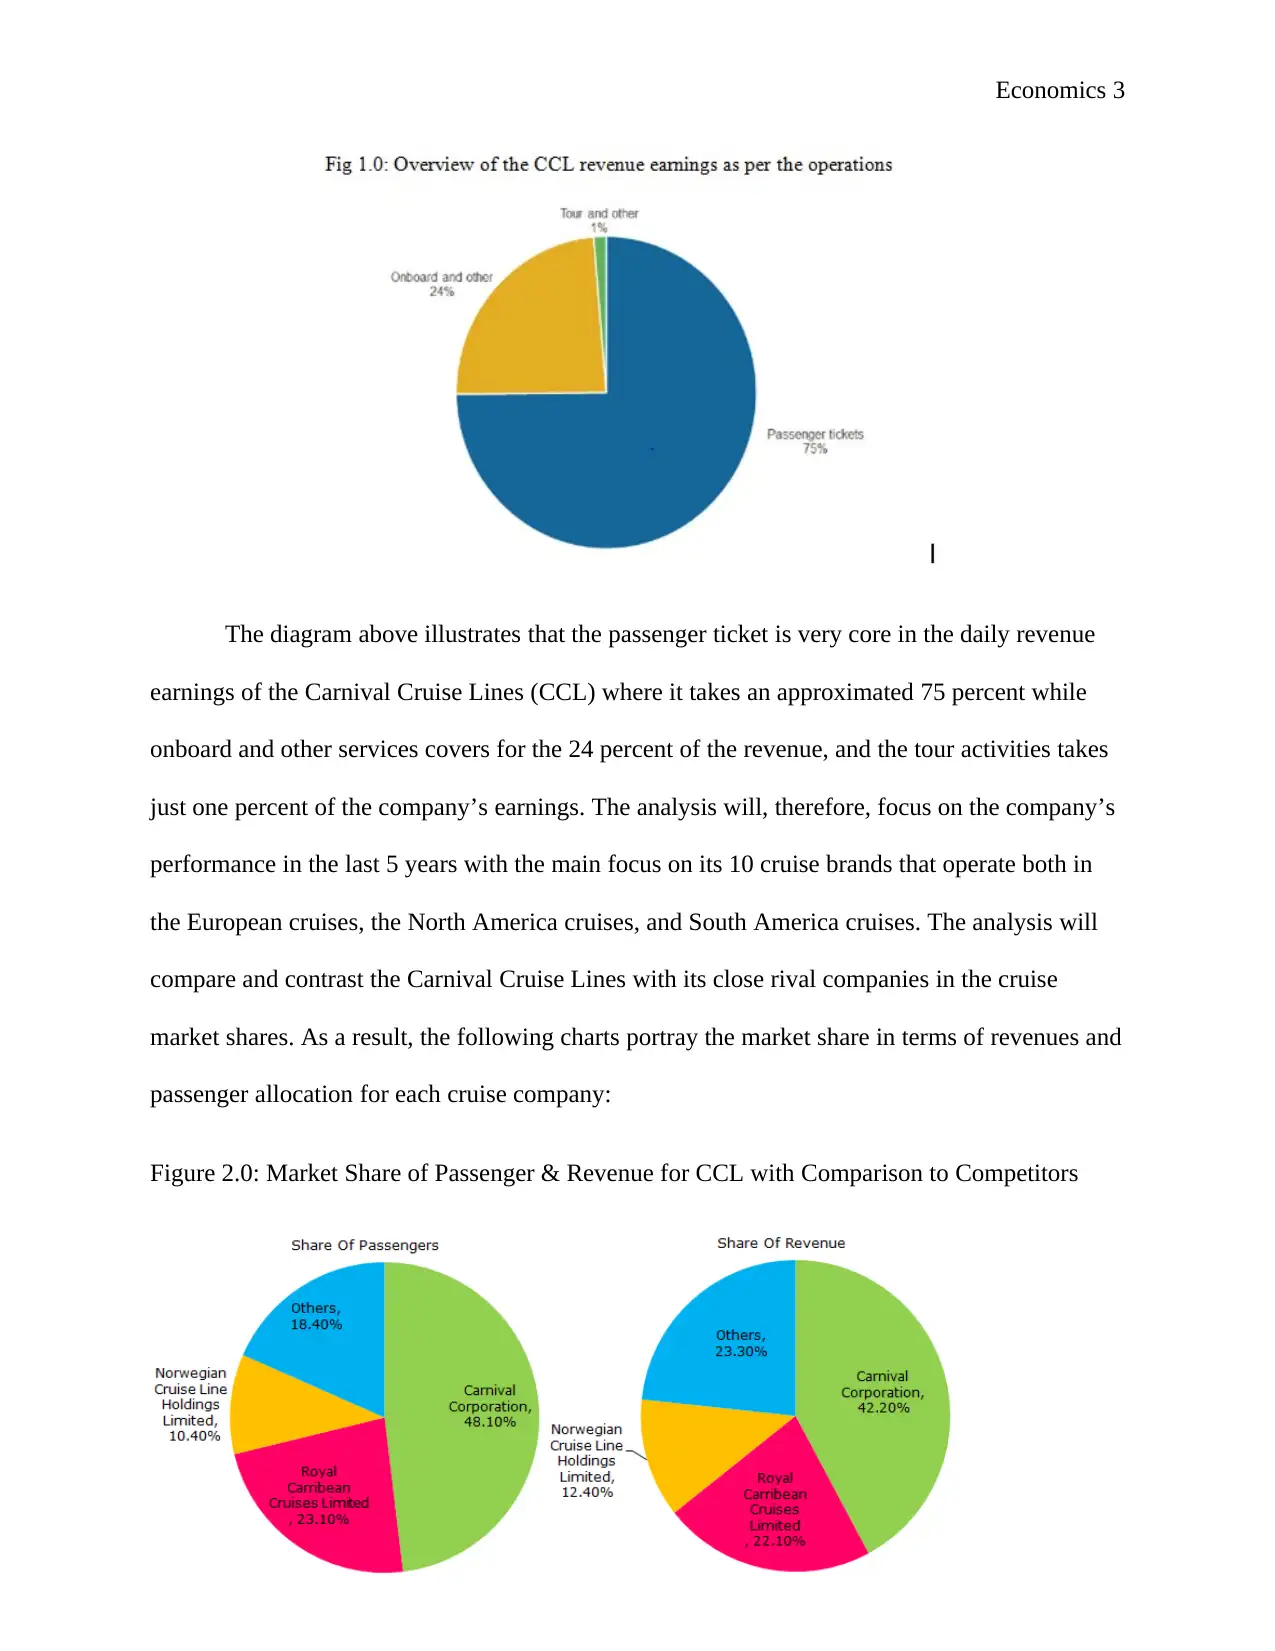
just one percent of the company’s earnings. The analysis will, therefore, focus on the company’s
performance in the last 5 years with the main focus on its 10 cruise brands that operate both in
the European cruises, the North America cruises, and South America cruises. The analysis will
compare and contrast the Carnival Cruise Lines with its close rival companies in the cruise
market shares. As a result, the following charts portray the market share in terms of revenues and
passenger allocation for each cruise company:
Figure 2.0: Market Share of Passenger & Revenue for CCL with Comparison to Competitors
The diagram above illustrates that the passenger ticket is very core in the daily revenue
earnings of the Carnival Cruise Lines (CCL) where it takes an approximated 75 percent while
onboard and other services covers for the 24 percent of the revenue, and the tour activities takes
just one percent of the company’s earnings. The analysis will, therefore, focus on the company’s
performance in the last 5 years with the main focus on its 10 cruise brands that operate both in
the European cruises, the North America cruises, and South America cruises. The analysis will
compare and contrast the Carnival Cruise Lines with its close rival companies in the cruise
market shares. As a result, the following charts portray the market share in terms of revenues and
passenger allocation for each cruise company:
Figure 2.0: Market Share of Passenger & Revenue for CCL with Comparison to Competitors
⊘ This is a preview!⊘
Do you want full access?
Subscribe today to unlock all pages.
Trusted by 1+ million students worldwide
Economics 4
From figure 2.0 above, the Carnival Corporation captures the largest market share which
is 44 percent of the cruise line market share globally. The immediate competitors of Carnival
Corporation are the Royal Caribbean with 23 percent of the total cruise line market while the rest
of the companies have an approximated 30 percent combined of the total cruise line market
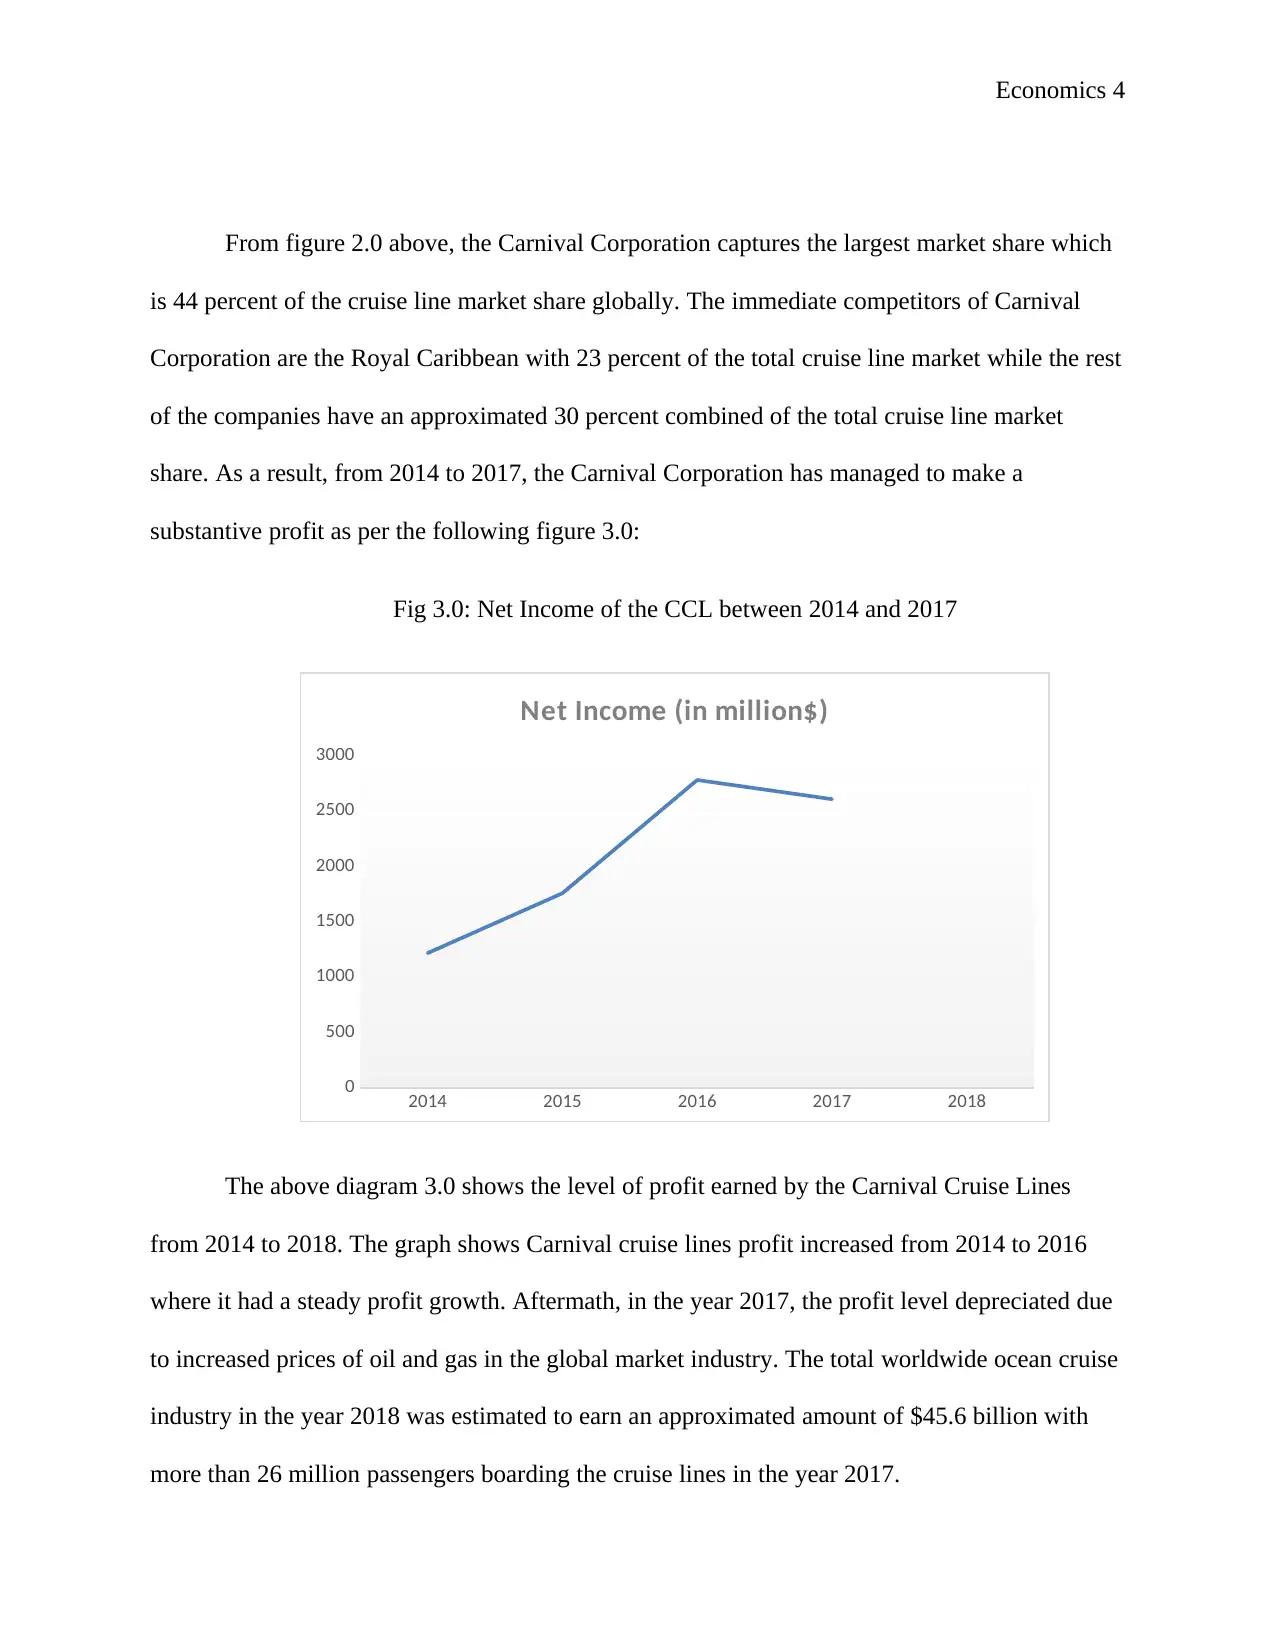
share. As a result, from 2014 to 2017, the Carnival Corporation has managed to make a
substantive profit as per the following figure 3.0:
Fig 3.0: Net Income of the CCL between 2014 and 2017
2014 2015 2016 2017 2018
0
500
1000
1500
2000
2500
3000
Net Income (in million$)
The above diagram 3.0 shows the level of profit earned by the Carnival Cruise Lines
from 2014 to 2018. The graph shows Carnival cruise lines profit increased from 2014 to 2016
where it had a steady profit growth. Aftermath, in the year 2017, the profit level depreciated due
to increased prices of oil and gas in the global market industry. The total worldwide ocean cruise
industry in the year 2018 was estimated to earn an approximated amount of $45.6 billion with
more than 26 million passengers boarding the cruise lines in the year 2017.
From figure 2.0 above, the Carnival Corporation captures the largest market share which
is 44 percent of the cruise line market share globally. The immediate competitors of Carnival
Corporation are the Royal Caribbean with 23 percent of the total cruise line market while the rest
of the companies have an approximated 30 percent combined of the total cruise line market
share. As a result, from 2014 to 2017, the Carnival Corporation has managed to make a
substantive profit as per the following figure 3.0:
Fig 3.0: Net Income of the CCL between 2014 and 2017
2014 2015 2016 2017 2018
0
500
1000
1500
2000
2500
3000
Net Income (in million$)
The above diagram 3.0 shows the level of profit earned by the Carnival Cruise Lines
from 2014 to 2018. The graph shows Carnival cruise lines profit increased from 2014 to 2016
where it had a steady profit growth. Aftermath, in the year 2017, the profit level depreciated due
to increased prices of oil and gas in the global market industry. The total worldwide ocean cruise
industry in the year 2018 was estimated to earn an approximated amount of $45.6 billion with
more than 26 million passengers boarding the cruise lines in the year 2017.
Paraphrase This Document
Need a fresh take? Get an instant paraphrase of this document with our AI Paraphraser
Economics 5
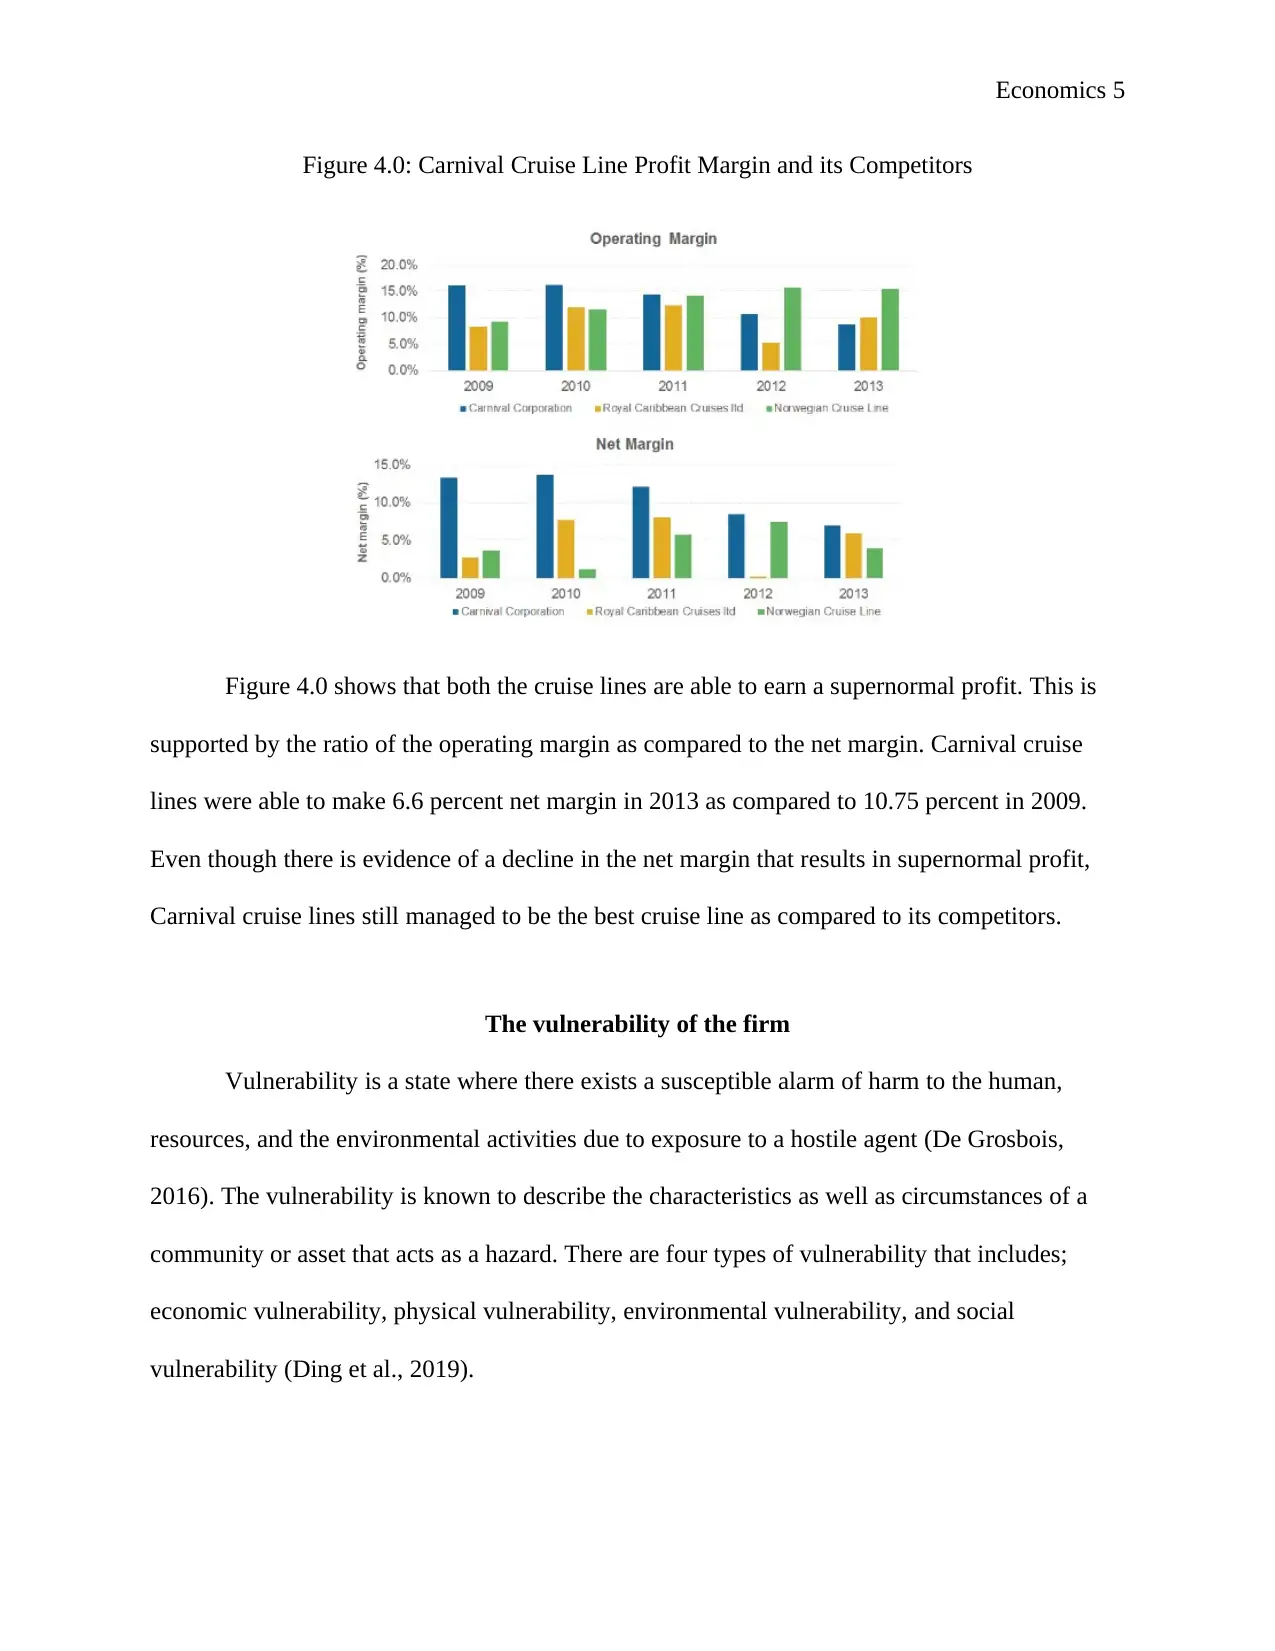
Figure 4.0: Carnival Cruise Line Profit Margin and its Competitors
Figure 4.0 shows that both the cruise lines are able to earn a supernormal profit. This is
supported by the ratio of the operating margin as compared to the net margin. Carnival cruise
lines were able to make 6.6 percent net margin in 2013 as compared to 10.75 percent in 2009.
Even though there is evidence of a decline in the net margin that results in supernormal profit,
Carnival cruise lines still managed to be the best cruise line as compared to its competitors.
The vulnerability of the firm
Vulnerability is a state where there exists a susceptible alarm of harm to the human,
resources, and the environmental activities due to exposure to a hostile agent (De Grosbois,
2016). The vulnerability is known to describe the characteristics as well as circumstances of a
community or asset that acts as a hazard. There are four types of vulnerability that includes;
economic vulnerability, physical vulnerability, environmental vulnerability, and social
vulnerability (Ding et al., 2019).
Economics 6
Even though the market expansion seems attractive to the Carnival cruise lines, the threat
of its port capacity is an immediate issue attached to its operations. The deep water and
enormous requirements for the dock are regarded as limited in nature (Klein, 2016). The
company should invest heavily in research and development in order to minimize environmental
degradations. It should also develop its global structure that harmonizes its cruise line capacities
(Wang et al., 2016). This will help the company to minimize the damages on its daily operations
thus increases its profit maximization. As a result, the long run average fixed costs will be higher
thus increases the total cost of operation (Gregoriou et al., 2017).
Exchange rates
The exchange rate is the value of one nation’s currency in exchange with another national
currency. The exit of Britain from the European Union is considered to have affected the Cruise
lines industry in the European market. Carnival cruise lines are known to have reported
increased revenue from its operations in the EU market. However, it expects to experience a
negative economic impact of Brexit in Britain in terms of the currency exchange rate (Jones et
al., 2017). The cruise industry is directly affected by the fluctuations of the exchange rates when
raw materials are purchased from the EU states to the USA. Since Carnival is known to earn
most of its revenue from its US customers, an appreciation in the dollar will minimize the
Carnival Company’s earning altogether.
SWOT Analysis
Strengths
⊘ This is a preview!⊘
Do you want full access?
Subscribe today to unlock all pages.
Trusted by 1+ million students worldwide
Economics 7
The Carnival Corporation is known to primarily operate in North America, Germany, Italy, and
in Australia. It has a large fleet size that operates the 11 cruise brands which increase its global
operations compared to other competitors. Carnival Company is known to have a 47 percent
market share in the United Kingdom, 51 percent in Germany and 68 percent in Italy. The
Carnival Corporation operates larger cruise lines thus leading to a significant cost advantage over
its competitor who has minimal market segments. The presence of entertainment on board for
customers creates a unique opportunity that helps to attract many customers.
Weakness
The high turnover of employees at the lower output level is a concern of the Carnival
Company. It experienced a decline in the total revenue in 2017 by three percent from $3.7 billion
to $3.58 billion in 2016. Appreciation of the US dollar against other currencies has led to a
decrease in its global earnings given that 52 percent of the revenue is from the US customers.
The business model of Carnival cruise lines can easily be imitated by the competitors in the
cruise line industry (Cheewatragoongit and Ngamvichaikit, 2018). In order to overcome these
challenges, the company must build a platform model that can be integrated by the suppliers, end
users, and vendors in the cruise line industry.
Opportunities
Increase in the global vacation market is a major opportunity for the Carnival cruise lines
to expand its operations in other destinations including Asia and Africa. The company should
introduce a high-end luxury cruise class for its customers. The company should ensure that its
prices are relatively affordable thus helps to attract a large number of customers in the cruise line
industry (Park et al., 2016). Carnival Company can expand its Luxury Lines and by increasing its
Paraphrase This Document
Need a fresh take? Get an instant paraphrase of this document with our AI Paraphraser
Economics 8
berth capacity for the market in Europe, Asia, and North America in order to accommodate the
customers’ demand. Carnival cruise lines are planning to introduce one large cruise line in Costa
Romantic that will help in accommodating an increasingly large number of customers.
Threat
Every customer will want to board a crew that is injury-free as they go across the sea.
Social Media is a threat; they can easily damage the company’s reputation on what they put up
on the web including environmental pollution debate. The final threat is the weather; the cruise
line has a vast amount of ships going to the Caribbean, which is known to have many tropical
storms. There could easily be another crisis that could have a negative impact on the cruise line
(Jones et al., 2017). At the same time, the 2007/2008 global financial recession had a direct
impact on the cruise line in terms of increased costs with minimal financial earnings to the
companies. As a result, there were increased variable and fixed costs which were to help cater for
the daily activities of the cruise lines globally.
Pricing Strategy
By definition, pricing strategy is the process of adjusting prices with the goal of
establishing an optimum price level. Carnival cruise line uses price differentiation which allows
it to charge a different set of the price at a different state and stage in order to gain entry in
different cruise line market places (Espinet-Rius et al., 2018). Carnival Corporation had a total
revenue of $15.5 billion in 2013, with a $1.5 billion in total profit after operational costs. The
pricing strategy is achieved by taking into account all the global portfolio cruise line brands
where different prices are charged depending on the locality (Jones et al., 2017). For example,
the Holland America Line and the Seabourn offer the guests fleet air schedule from the options
Economics 9
which are tailored to meet the arrival times. The differences in the prices are put in a way that
each and every ship serves different types of customers globally.
Competition and Price Elasticity
The price elasticity shows the responsiveness or the elasticity of the quantity demanded
of a good or services to a change in its price. The cruise industry regarded to have an elastic
demand since a rise in the price of one particular cruise lines leads to a swift shift to a competing
firm with a cheaper price. Cruise line industry is generally regarded to have an oligopolistic
market structure (Li and Kwortnik, 2017). This is because the nature of capital intensive required
in the industry discourages the new entrants. Both the Carnival cruise line and the Royal
Caribbean Cruises Ltd are known to control around 75 percent of the global cruise ship market
(Jones et al., 2017). One peculiar characteristic of the oligopolistic market is that it consists of a
small number of large firms with diverged significant influence.
Government intervention
Governments have ensured the safety of the cruise industry where ships undergo dozens
of announced and unannounced safety inspections per year. As a result, the Cruise Lines
International Association ensures that the players in this industry follow the international cruise
lines law. The Flag State ensures that cruise ships are registered and meets all the international
requirements. As a result, ships are required to comply with both International and National
requirements which helps to minimize the danger of sinking, the cruise ships are subjected to
three robust layers of inspection.
Conclusion
⊘ This is a preview!⊘
Do you want full access?
Subscribe today to unlock all pages.
Trusted by 1+ million students worldwide
Economics 10
The Carnival Corporation was found to have a market share of 44 percent which is the
largest market share of the cruise lines in the world. It is followed closely by the Royal
Caribbean with 23 percent of the market. The cruise industry was found to operate an
oligopolistic market structure with a few large firms. As a result, Carnival Company was found
to be using price differentiation strategy in its market operations in order to maximize the profit.
Economic, social, and environmental vulnerabilities were found to be affecting the company’s
operations. Cruise lines follow Cruise Lines International Association policies that regulate its
operations in order to minimize the risks associated with sea storms. From the competing
scenario to price elasticity Carnival Company is regarded to have a significant cost advantage
over most of the competitors.
Paraphrase This Document
Need a fresh take? Get an instant paraphrase of this document with our AI Paraphraser
Economics 11
Reference
Cheewatragoongit, A. and Ngamvichaikit, A., 2018. Model Development of Cruise Home Port
for Cruise Tourism Extension in Andaman Tourism Cluster of Thailand. Proceedings of The
12th MAC 2018, p.60.
Ding, L., Lei, L. and Zhao, X., 2019. China's ocean economic efficiency depends on
environmental integrity: A global slacks-based measure. Ocean & Coastal
Management, 176, pp.49-59.
Espinet-Rius, J.M., Fluvià-Font, M., Rigall-Torrent, R. and Oliveras-Corominas, A., 2018.
Cruise tourism: A hedonic pricing approach. European Journal of Management and Business
Economics, 27(1), pp.101-122.
Gregoriou, G.N., Gultek, M.M. and Demirer, I., 2017. Efficiency of Cruise Ships: A Data
Envelopment Analysis Approach. International Journal of Global Business, 10(1), pp.8-25.
Jones, P., Hillier, D. and Comfort, D., 2017. The two market leaders in ocean cruising and
corporate sustainability. International Journal of Contemporary Hospitality
Management, 29(1), pp.288-306.
Klein, R.A., 2016. Crime at Sea: A Comparison of Crime on Carnival Cruise Lines, 2007–2011.
In Cruise Business Development (pp. 17-28). Springer, Cham.
Li, Y. and Kwortnik, R., 2017. Categorizing cruise lines by passenger perceived
experience. Journal of Travel Research, 56(7), pp.941-956.
Park, S.B., Ok, C.M. and Chae, B.K., 2016. Using twitter data for cruise tourism marketing and
research. Journal of Travel & Tourism Marketing, 33(6), pp.885-898.

Economics 12
Wang, K., Wang, S., Zhen, L. and Qu, X., 2016. Cruise shipping review: operations planning
and research opportunities. Maritime Business Review, 1(2), pp.133-148.
Wang, K., Wang, S., Zhen, L. and Qu, X., 2016. Cruise shipping review: operations planning
and research opportunities. Maritime Business Review, 1(2), pp.133-148.
⊘ This is a preview!⊘
Do you want full access?
Subscribe today to unlock all pages.
Trusted by 1+ million students worldwide
1 out of 12

Your All-in-One AI-Powered Toolkit for Academic Success.
+13062052269
info@desklib.com
Available 24*7 on WhatsApp / Email
![[object Object]](/_next/static/media/star-bottom.7253800d.svg)
Unlock your academic potential
Copyright © 2020–2026 A2Z Services. All Rights Reserved. Developed and managed by ZUCOL.