Travel Finance: Analysis of Carnival Corporation & PLC & Dalata Group
VerifiedAdded on 2024/04/26
|20
|5077
|84
Report
AI Summary
This report delves into the crucial aspects of finance and funding within the travel and tourism industry, primarily focusing on Carnival Corporation & Plc and Dalata Hotel Group Plc. It begins by examining the significance of cost and volume in financial management, using Carnival Corporation as a case study to understand how these elements influence pricing and profitability. The report analyzes various pricing methods employed in the travel sector, drawing examples from different cruise brands under Carnival Corporation. Furthermore, it investigates the factors that impact profit for travel and tourism businesses, again using Carnival Corporation's cruise brands as a reference. A detailed interpretation of the financial accounts of Dalata Hotel Group Plc for the year ended 2016 provides insights into their financial performance. Lastly, the report explores the sources and distribution of funding for capital projects associated with tourism, offering a comprehensive overview of financial strategies and considerations within the industry. Desklib provides a platform to access similar solved assignments and past papers.
1
UNIT 2 -
Finance and
Funding in
the Travel
and Tourism
Sector
UNIT 2 -
Finance and
Funding in
the Travel
and Tourism
Sector
Paraphrase This Document
Need a fresh take? Get an instant paraphrase of this document with our AI Paraphraser
Table of Contents
INTRODUCTION.....................................................................................................................................2
TASK 1 – WRITTEN REPORT...................................................................................................................3
1.1 IMPORTANCE OF COSTS AND VOLUME IN FINANCIAL MANAGEMENT OF TRAVEL AND
TOURISM BUSINESSES USING CARNIVAL CORPORATION & PLC AS A CASE STUDY...........................3
1.2 ANALYSE PRICING METHODS USED IN THE TRAVEL AND TOURISM SECTOR AND USING
RELEVANT EXAMPLES FROM DIFFERENT CRUISE BRANDS OF CARNIVAL CORPORATION & PLC.......6
1.3 ANALYSE FACTORS INFLUENCING PROFIT FOR TRAVEL AND TOURISM BUSINESSES USING
CARNIVAL CORPORATION & PLC CRUISE BRANDS AS A CASE STUDY................................................8
TASK 3 - WRITTEN REPORT ON THE FINANCIAL PERFORMANCE OF DALATA HOTEL GROUP PLC.......10
3.1 INTERPRETATION OF FINANCIAL ACCOUNTS OF DALATA HOTEL GROUP PLC FOR THE YEAR
ENDED 31ST DECEMBER 2016...........................................................................................................10
TASK 4 – LEAFLETS...............................................................................................................................14
4.1 ANALYSE SOURCES AND DISTRIBUTION OF FUNDING FOR THE DEVELOPMENT OF CAPITAL
PROJECTS ASSOCIATED WITH TOURISM..........................................................................................14
CONCLUSION.........................................................................................................................................0
REFERENCES..........................................................................................................................................1
INTRODUCTION
Travel and tourism industry is growing with a considerable pace contributing to the nation’s
economy. The finance and funding in travel and tourism is said to be very critical for their
growth and sustainability (Tribe, 2015). In this report the factors contributing the financial
performance of the Travel business is been analysed in context with the Carnival
Corporation & Plc analysing the importance of cost and volume with other related cost and
factors. In the next part of the report an analysis has been made in context with the Dalata
Hotel Group Plc for evaluating the financial performance of the business by comparing the
data of the two years. At last an understanding about the funding and capital projects are
discussed in terms of development and improvement of tourism sector.
⊘ This is a preview!⊘
Do you want full access?
Subscribe today to unlock all pages.
Trusted by 1+ million students worldwide
TASK 1 – WRITTEN REPORT
Travel and tourism business also requires managing their finances and working on their
financial management. For this, the different terminologies and an assessment of different
financial terms have to be done by the companies (Heizer, 2016). As per the case of Carnival
Corporation & plc, a report has been made for understanding the important financial terms
such as cost, volume and different pricing methods and factors influencing the profit margin
of the company (Carnival Corporation & PLC, 2018). This will be helping the company in
analysing and taking effective management and financial decision making.
1.1 IMPORTANCE OF COSTS AND VOLUME IN FINANCIAL MANAGEMENT OF
TRAVEL AND TOURISM BUSINESSES USING CARNIVAL CORPORATION & PLC
AS A CASE STUDY.
COST is termed as the number of expenses or expenditure incurred by the company say for
acquiring the resources and material for producing the required output and selling it
respectively. In monetary terms the cost is assessed as per the charges against efforts,
material, time and utilities consumed, risk incurred, resources and opportunity forgone.
Cost is termed as an important element in the financial management of a business as it
affects the pricing of product and services with various other costs as well. There are
different types of cost depending on the type of resources and services (Eldenburg, et al.
2016). This classification of the cost is necessary for taking the three important business
decision i.e. product costing, management control and decision making.
Paraphrase This Document
Need a fresh take? Get an instant paraphrase of this document with our AI Paraphraser
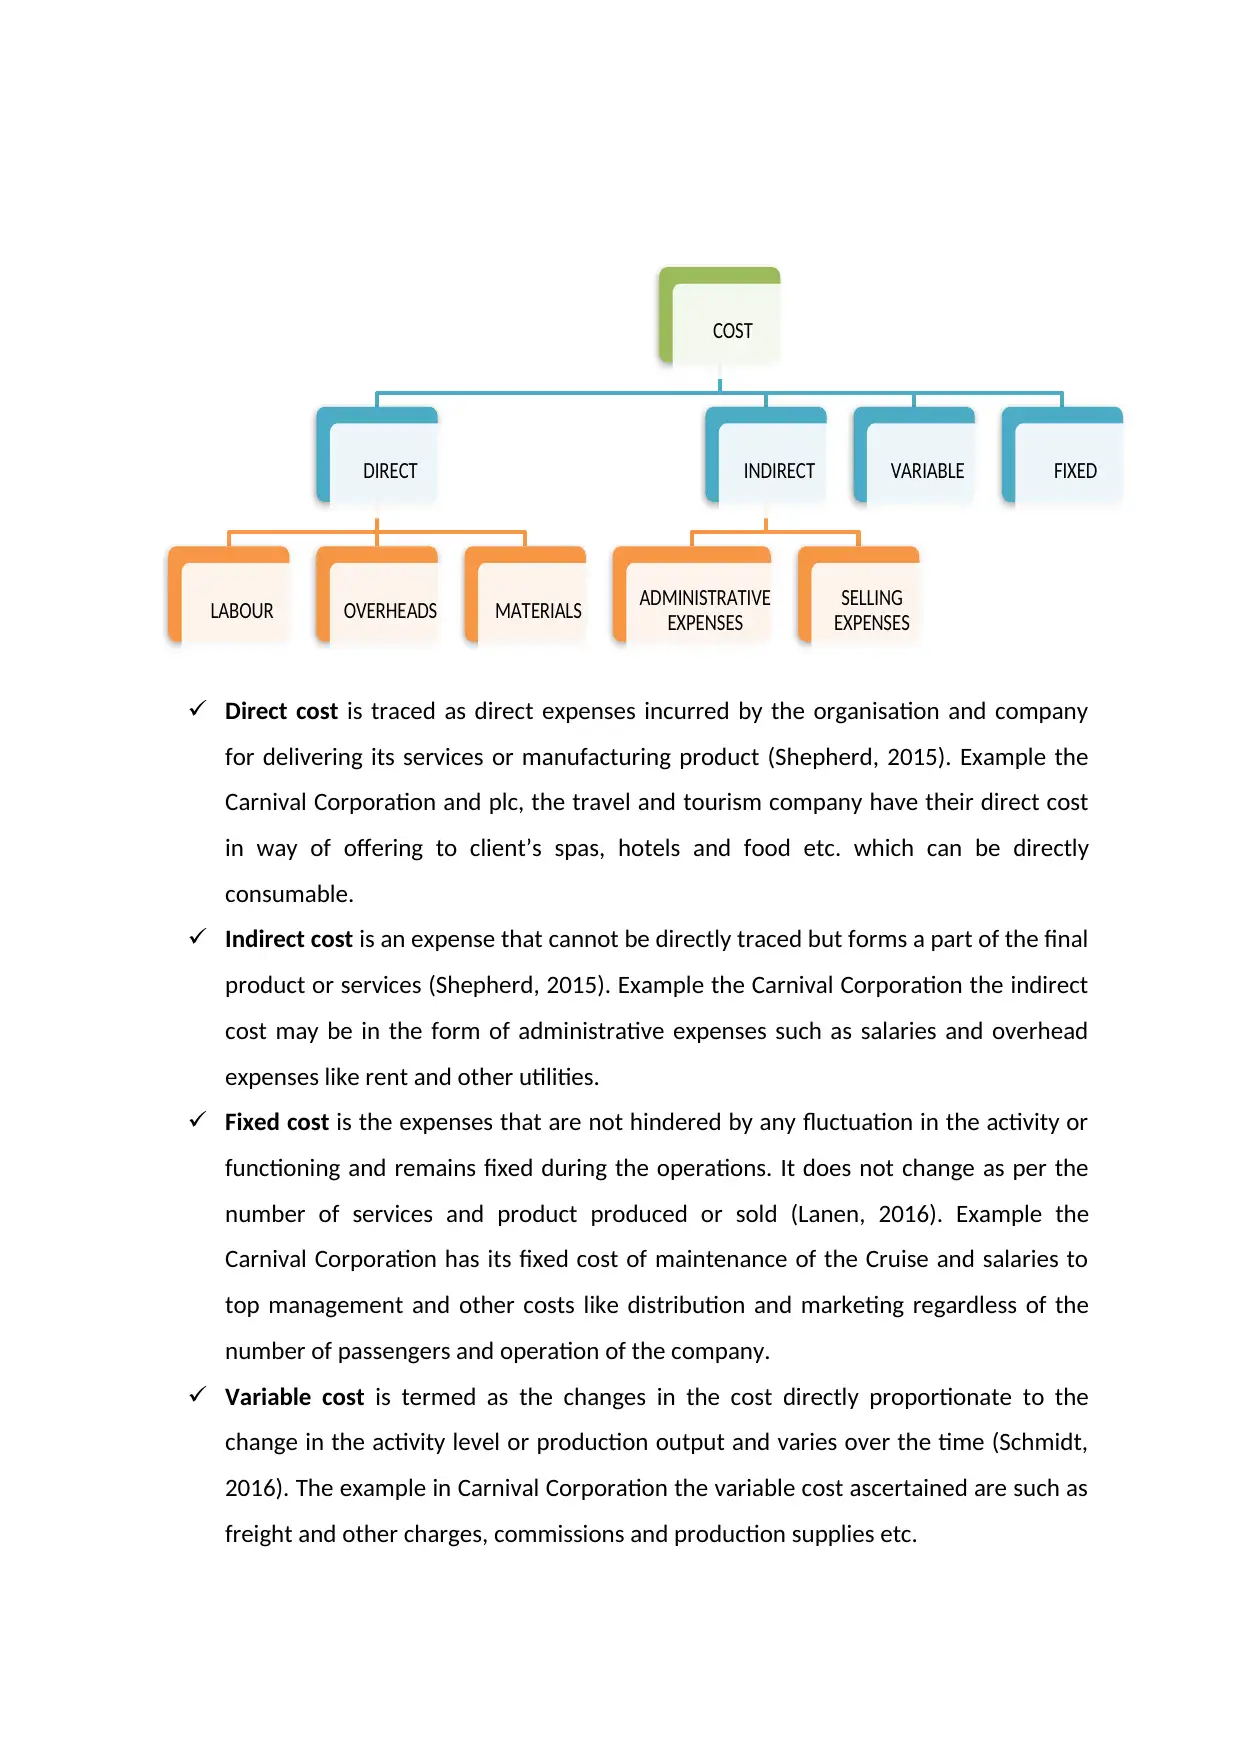
Direct cost is traced as direct expenses incurred by the organisation and company
for delivering its services or manufacturing product (Shepherd, 2015). Example the
Carnival Corporation and plc, the travel and tourism company have their direct cost
in way of offering to client’s spas, hotels and food etc. which can be directly
consumable.
Indirect cost is an expense that cannot be directly traced but forms a part of the final
product or services (Shepherd, 2015). Example the Carnival Corporation the indirect
cost may be in the form of administrative expenses such as salaries and overhead
expenses like rent and other utilities.
Fixed cost is the expenses that are not hindered by any fluctuation in the activity or
functioning and remains fixed during the operations. It does not change as per the
number of services and product produced or sold (Lanen, 2016). Example the
Carnival Corporation has its fixed cost of maintenance of the Cruise and salaries to
top management and other costs like distribution and marketing regardless of the
number of passengers and operation of the company.
Variable cost is termed as the changes in the cost directly proportionate to the
change in the activity level or production output and varies over the time (Schmidt,
2016). The example in Carnival Corporation the variable cost ascertained are such as
freight and other charges, commissions and production supplies etc.
COST
DIRECT
LABOUR OVERHEADS MATERIALS
INDIRECT
ADMINISTRATIVE
EXPENSES
SELLING
EXPENSES
VARIABLE FIXED
VOLUME is the quantity produced or generated by the business of the product and services
to be delivered. The volume initialises the profit margin of the company and its position in
the market (He, et al. 2016). Example the Carnival Corporation the volume is the packages
of tours and travel that are sold and the services delivered with the number of available
stocks and resources.
Break-even analysis is said to be the point where there is no profit or loss i.e.
operating income is zero, for the company. The BEP is important for assessing the
number of product units to be sold by the company to cover all its cost. It is
important for the Carnival Corporation & plc for ensuring the balance of total cost
and total gains in terms of the business volume to reach the breakeven point
(Schmidt, 2016).
Economies of scale are gained or achieved in context with the minimum input
delivering maximum output generating a higher amount of volume. This ensures the
profitability and sustainability of the firm with increased output at a decreased cost
(Holtz-Eakin and Lovely, 2017). And its vice versa Diseconomies of scale is termed as
lowering the volume of production with increased cost. This affects the functioning
and profitability of the firm resulting in an increase in per unit cost of the services
and product delivered.
ALLOCATION AND APPORTIONMENT are termed as the distribution or attributing the cost
for the given task and generating the output effectively. This is done by the Carnival
Corporation by way of distributing its cost especially the overhead cost as per the activities
or services delivered to the customers. This provides the company with an edge to adjust its
expenses and cut down extra cost that hampers the profitability of the firm (Patiar, 2016).
Apportionment of cost helps the Carnival Corporation & plc to streamline its expenditure
and funding required by the business for future growth and covering all central cost like
salaries, overhead expenses etc.
Cost and Volume are important for the Carnival Corporation & plc as both determines the
financial and competitive position of the business in the travel and tourism sector. The cost
assesses the operating cost and another related cost which helps the firm to determine and
compare its current position with the competitors. The volume generated and delivered
⊘ This is a preview!⊘
Do you want full access?
Subscribe today to unlock all pages.
Trusted by 1+ million students worldwide
determines the sales as well as marketing capacity of the firm depending on its demand.
Both this also helps the firm to forecast the pricing based on the cost and volume to be
generated. The requirement of funds and other essential items to be acquired by the
business is also determined as per the expenses and needs of the customer as per the sales
(Barr, et al. 2018). The sales volume and expenses help the Carnival Corporation to assess
the customer's needs, package improvement or any other arrangement needed to increase
the profitability or sales margin. The variable cost and breakeven analysis helps the Carnival
Corporation to deal and regulate the changes as per the market and meet out the demand
in terms of hotel and cruise booking, tickets pricing and overhead expenses etc.
Paraphrase This Document
Need a fresh take? Get an instant paraphrase of this document with our AI Paraphraser
1.2 ANALYSE PRICING METHODS USED IN THE TRAVEL AND TOURISM
SECTOR AND USING RELEVANT EXAMPLES FROM DIFFERENT CRUISE
BRANDS OF CARNIVAL CORPORATION & PLC.
Pricing methods are considered as one of the most important and crucial decision to be
taken by any business or firm. The decision lies in many factors and assessing these factors
will help the firm to effectively take their pricing decision while considering all the facts and
figures. The different pricing methods that can be used by the travel and tourism industry in
context with the Carnival Corporation are as follows:
Cost-Led Pricing: in this method, the prices are set as per the cost and volume to be
generated by the firm or organisation. For accurately determining the prices breakeven
point is calculated to ascertain the profitability position of the firm in regards to the
investment made and set the prices accordingly. High level of profit is there if the prices are
set above the breakeven point (Salim and Bala, 2017). Example the Costa Cruises of Carnival
Corporation is determining the prices above as per there cost and volume. This is effectively
helping them in generating a fruitful return on the investment made in terms of profit. The
cost led method approaches the firm effectively in deciding the promotional offers and
discounts with strategising the recovery of total cost and achieving profit margin.
Market-Led Pricing: this method determines the prices of product and services as per the
customers need and willingness to pay. The pricing to be set is ascertained in context with
the changing market dynamics and according to the prevailing market condition, choosing
the pricing strategies to say skimming and penetration pricing (Piercy, 2016). In penetration,
the prices are set lower for attracting more customers and other than in skimming the prices
are set higher as per the strong position of the company to gain competitive advantage.
Example Carnival UK (Cunard Line and P&O Cruises) uses this method to strategise their
pricing for packages and tours. This method helps the firm to ascertain the best pricing by
discriminating different segments and charging them according to the different groups of
customers.
Cost-Plus Pricing: it is a method in which the sales price is determined on the basis of total
product cost plus adding the markup percentage of profit to the final products or service.
The final pricing also includes opportunity cost with the other related costs such as direct
and indirect cost. This all includes the cost of raw material procured, cost of labour and
overhead cost; also known as cost elements (Nagle, et al. 2016). Example Carnival Cruise
Line uses this for ascertaining the prices of its tickets and packages. This is useful for them to
secure its profitability by a fixed markup percentage to avoid from the fluctuations of the
travel and tourism industry. This also determines the variable cost and ensures the
unexpected changes in the cost of effectively determining the packages and tickets. The
disadvantage is that this method does not consider the ongoing competition in the market
and ignores the role of customers and pricing strategies followed by the competitors.
Formula for setting price: P = AVC + AVC (M)
Where AVC= Average Variable Cost
M = Markup percentage
AVC (m) = Gross profit margin
Marginal Costing Pricing: this method majorly focuses on the variable cost such as material
cost and wages etc. The fixed and indirect costs are not considerably used by the firm to
assess the prices of the packages and tickets. Such as the AIDA Cruises a brand of Carnival
Corporation does not use fixed and indirect cost as a basis for calculating the pricing of its
services and product. AIDA is deciding the pricing by marginal costing method which allows
them to have a control over the demand fluctuations and variability in the season (Kotas,
2014). This method is appropriate for the company as it is easy and considerably uses the
spares capacity of the firm for generating more profitability say in terms of effective use of
resources. Allows the lower segment travellers with lower pricing and also makes the frim to
remain in the competition with a price sensitive approach.
⊘ This is a preview!⊘
Do you want full access?
Subscribe today to unlock all pages.
Trusted by 1+ million students worldwide
1.3 ANALYSE FACTORS INFLUENCING PROFIT FOR TRAVEL AND TOURISM
BUSINESSES USING CARNIVAL CORPORATION & PLC CRUISE BRANDS AS A
CASE STUDY.
There are many factors that can affect the firm’s profitability and productivity and may also
have an influence on its services and product delivered. The major factor that may
influences the profit of travel and tourism business of Carnival Corporation & plc are as
follows:
Political conditions: government involvement and updation in the rules and policies
affect the profitability of the travel and tourism sector. Example the Carnival
Corporation will be greatly impacted in terms of profit and productivity if the
government follows anti-tourism policy. This will lower down the travel rate and
immigration from the different countries (Mason, 2015). Also, the taxation and other
charges levied down by the government affects the profitability of the visitors and
company both with will have to incur high charges and cost for acquiring the
services.
Terrorism: safety and security are one of the major factors that attract the tourists
to visit a place and the frequent terrorist attacks restrict them from visiting the
places or cities. Carnival Corporation’s profit is also influenced by this as it makes the
company suffer losses and gives a negative image of the place (Brondoni, 2016). The
assurance of the security and safety in the UK gives a profitable edge to the company
with an increase in visitors or tourists.
Climatic conditions: changing weather conditions and natural calamities often
impact the tour and travel business. The natural sceneries and pleasant atmosphere
attracts more travellers and tourist resulting in a higher profit margin and increases
the productivity of the business (Shakeela and Becken, 2015). On the other hand, if
any disastrous or catastrophic condition is there, affects the profit of the travel and
tourism as the tourists avoid to visit such places or areas.
Seasonality: in travel and tourism industry seasonality impacts more on the
profitability; as there are peak and troughs in the seasonal business, like of Carnival
Corporation & plc. Example, in the season of Christmas due to holidays the travel
business of Carnival Corporation is at its peak and vice-versa faces a trough in the
Paraphrase This Document
Need a fresh take? Get an instant paraphrase of this document with our AI Paraphraser
off-season say during the summer days (Shakeela and Becken, 2015). This majorly
impacts the productivity in the offseason and lowers the utilisation of the resources
and therefore decreases the profitability of the firm.
Economic stability: changing micro and macro factors affect the business of travel
and tourism; say the interest rates, currency rates etc. Carnival Corporation & plc is
impacted by this changes and which all the way affects the profitability and
productivity of the firm (Smeral, 2017). Example currency rate changes lower downs
the profit margin as the changing rate differs from country to country and various
tourists travel from different countries.
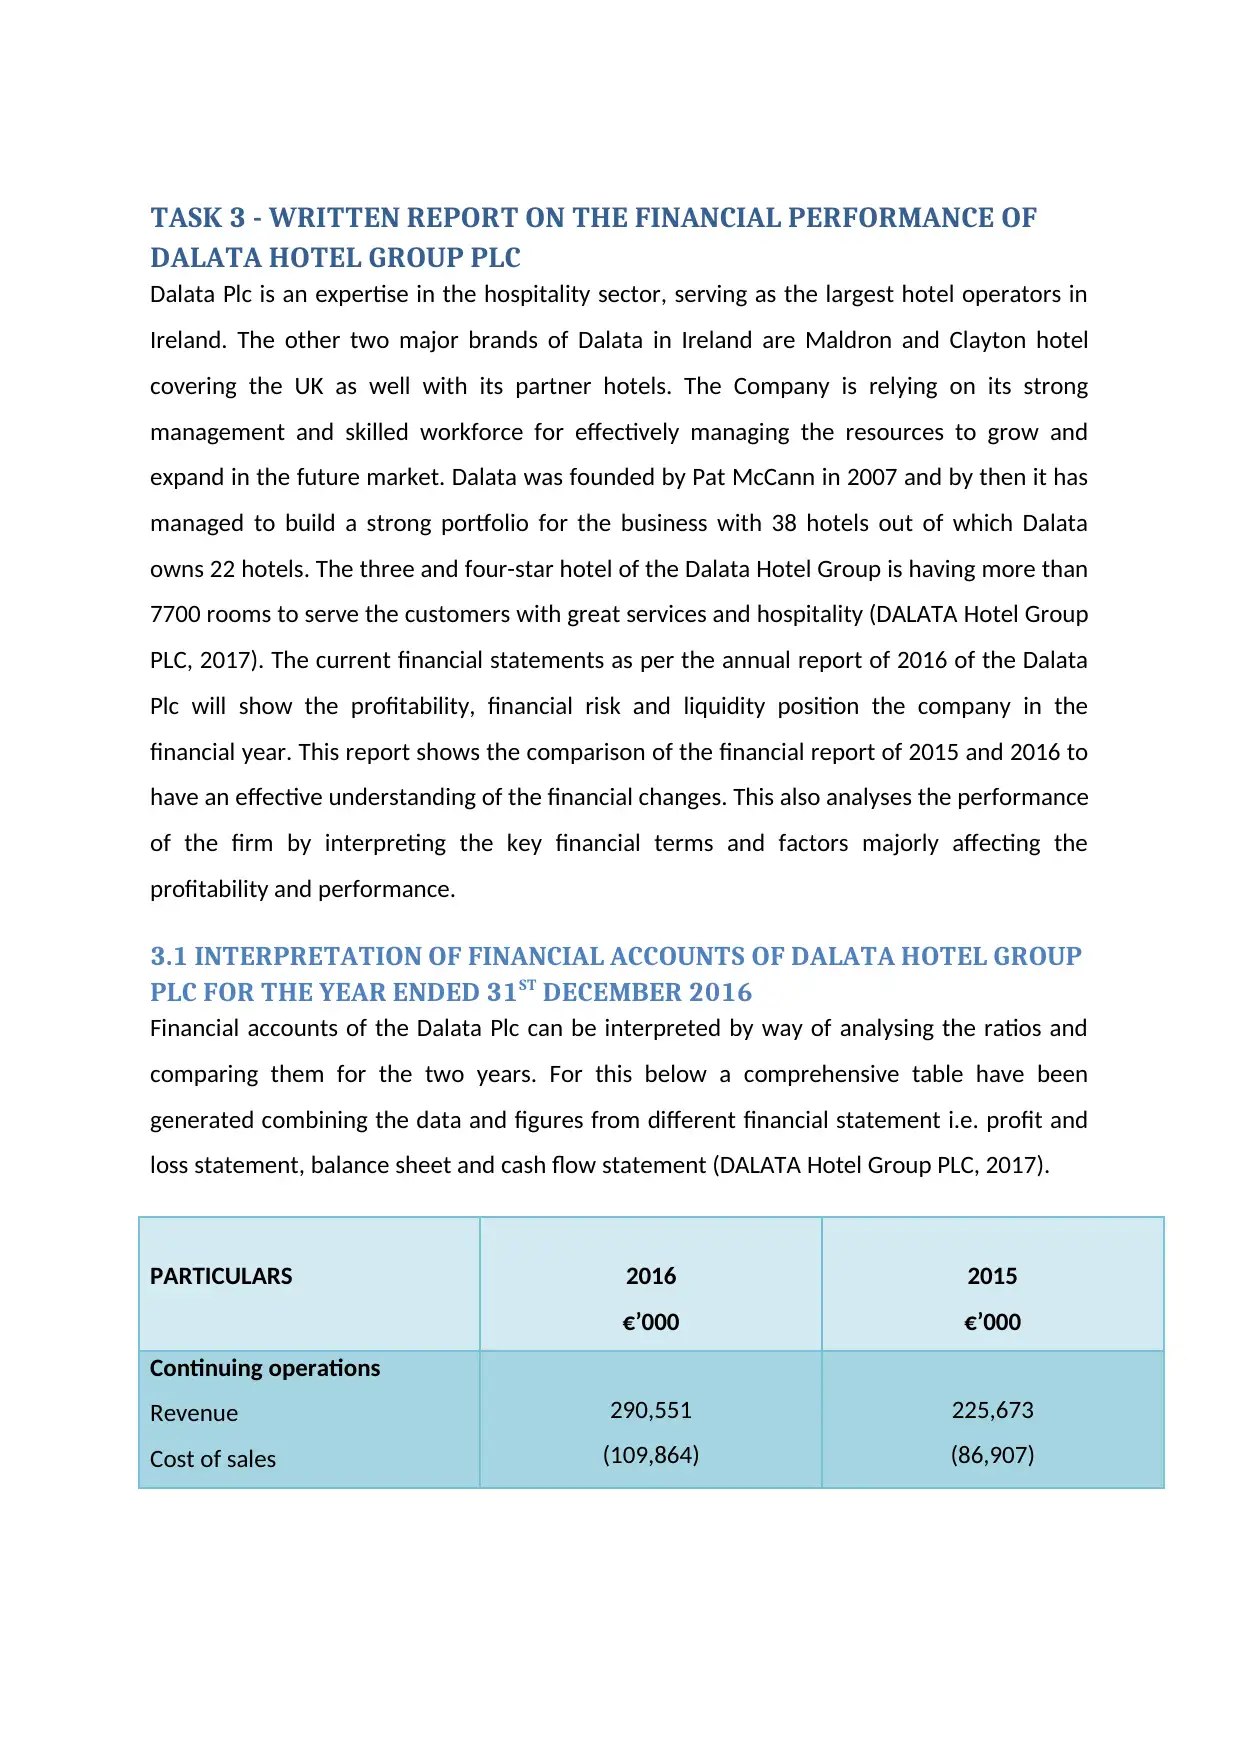
TASK 3 - WRITTEN REPORT ON THE FINANCIAL PERFORMANCE OF
DALATA HOTEL GROUP PLC
Dalata Plc is an expertise in the hospitality sector, serving as the largest hotel operators in
Ireland. The other two major brands of Dalata in Ireland are Maldron and Clayton hotel
covering the UK as well with its partner hotels. The Company is relying on its strong
management and skilled workforce for effectively managing the resources to grow and
expand in the future market. Dalata was founded by Pat McCann in 2007 and by then it has
managed to build a strong portfolio for the business with 38 hotels out of which Dalata
owns 22 hotels. The three and four-star hotel of the Dalata Hotel Group is having more than
7700 rooms to serve the customers with great services and hospitality (DALATA Hotel Group
PLC, 2017). The current financial statements as per the annual report of 2016 of the Dalata
Plc will show the profitability, financial risk and liquidity position the company in the
financial year. This report shows the comparison of the financial report of 2015 and 2016 to
have an effective understanding of the financial changes. This also analyses the performance
of the firm by interpreting the key financial terms and factors majorly affecting the
profitability and performance.
3.1 INTERPRETATION OF FINANCIAL ACCOUNTS OF DALATA HOTEL GROUP
PLC FOR THE YEAR ENDED 31ST DECEMBER 2016
Financial accounts of the Dalata Plc can be interpreted by way of analysing the ratios and
comparing them for the two years. For this below a comprehensive table have been
generated combining the data and figures from different financial statement i.e. profit and
loss statement, balance sheet and cash flow statement (DALATA Hotel Group PLC, 2017).
PARTICULARS 2016
€’000
2015
€’000
Continuing operations
Revenue
Cost of sales
290,551
(109,864)
225,673
(86,907)
⊘ This is a preview!⊘
Do you want full access?
Subscribe today to unlock all pages.
Trusted by 1+ million students worldwide
1 out of 20
Related Documents


Your All-in-One AI-Powered Toolkit for Academic Success.
+13062052269
info@desklib.com
Available 24*7 on WhatsApp / Email
![[object Object]](/_next/static/media/star-bottom.7253800d.svg)
Unlock your academic potential
Copyright © 2020–2026 A2Z Services. All Rights Reserved. Developed and managed by ZUCOL.