Financial Analysis of Carpetright Plc: Performance and Strategies
VerifiedAdded on 2020/03/13
|18
|3379
|106
Report
AI Summary
This report presents a comprehensive financial analysis of Carpetright Plc. It begins with an executive summary outlining the scope of the analysis, which includes comparative and common-size analyses of financial statements, along with a detailed examination of various financial ratios. The report delves into ratio analysis, covering liquidity, solvency, working capital, profitability, and asset efficiency ratios. It also incorporates a discussion on the Balance Scorecard for strategic performance evaluation. The comparison of financial results is presented through horizontal and vertical analyses, providing a clear view of trends and proportions. The analysis extends to comparing Carpetright Plc's performance with its competitors and industry averages, followed by an assessment against the organization's KPIs. The report concludes with recommendations based on the financial and non-financial aspects of the company, highlighting advantages and limitations of the analysis.

MANAGERIAL FINANCE
Paraphrase This Document
Need a fresh take? Get an instant paraphrase of this document with our AI Paraphraser
Executive summary
The report on the financial statement analysis of Carpetright Plc. is to be analysed in this
research. As the financial statement analysis helps to identify the loopholes of the financial
position and performance, the discussion shall be made by considering the financial facts and
figures. In this context, it is to mention that the analysis of the financial statement of the
company is to be made by considering the comparative analysis and the common size analysis.
On the other hand the analysis of the financial statement is to be made by considering the ratio
analysis as this tool of financial management helps to make comparative analysis. In this context,
it is also to mention that the strategic management of the company would also to be discussed in
this research to identify the loopholes in the internal management process. In this report, the
research would be made by considering the latest year data and the previous year data. The
strategic management of the company would be analysed by taking the balanced scorecard
method. The financial and non-financial factors are also to be discussed by taking the Balance
scorecard. The advantages and disadvantages of the tools used for the researcher would also to
be analysed in the final part of the report. The recommendation would be the final part of the
report, which shall reflect the financial and non-financial aspects of the company.
Table of Contents
1. Introduction..................................................................................................................................4
2. Literature review..........................................................................................................................4
2.1 Ratio analysis.........................................................................................................................4
2.1.1 Liquidity ratios................................................................................................................5
2.1.2 Solvency ratios................................................................................................................5
2.1.3 Working capital ratios.....................................................................................................5
2.1.4 Profitability ratios............................................................................................................6
2.1.5 Asset efficiency ratios.....................................................................................................6
2.2 Balance Scorecard..................................................................................................................6
3. Comparison of financial results...................................................................................................7
3.1 Horizontal analysis.................................................................................................................7
3.2 Vertical analysis.....................................................................................................................9
4. Ratio analysis:............................................................................................................................10
5. Comparison with competitors and industry average.................................................................12
6. Measurement against the organisation’s KPIs and evaluation of the use of KPIs in assessing
organisation performance..............................................................................................................12
7. Balance Score Card....................................................................................................................13
8. Strategy development................................................................................................................14
9. Discussion and explanation of BSC and the Map.....................................................................14
10. Discussion of the advantages and limitations of the analysis..................................................15
11. Analysis of event.....................................................................................................................15
12. Recommendations....................................................................................................................15
13. Conclusions..............................................................................................................................16
References......................................................................................................................................17
⊘ This is a preview!⊘
Do you want full access?
Subscribe today to unlock all pages.
Trusted by 1+ million students worldwide
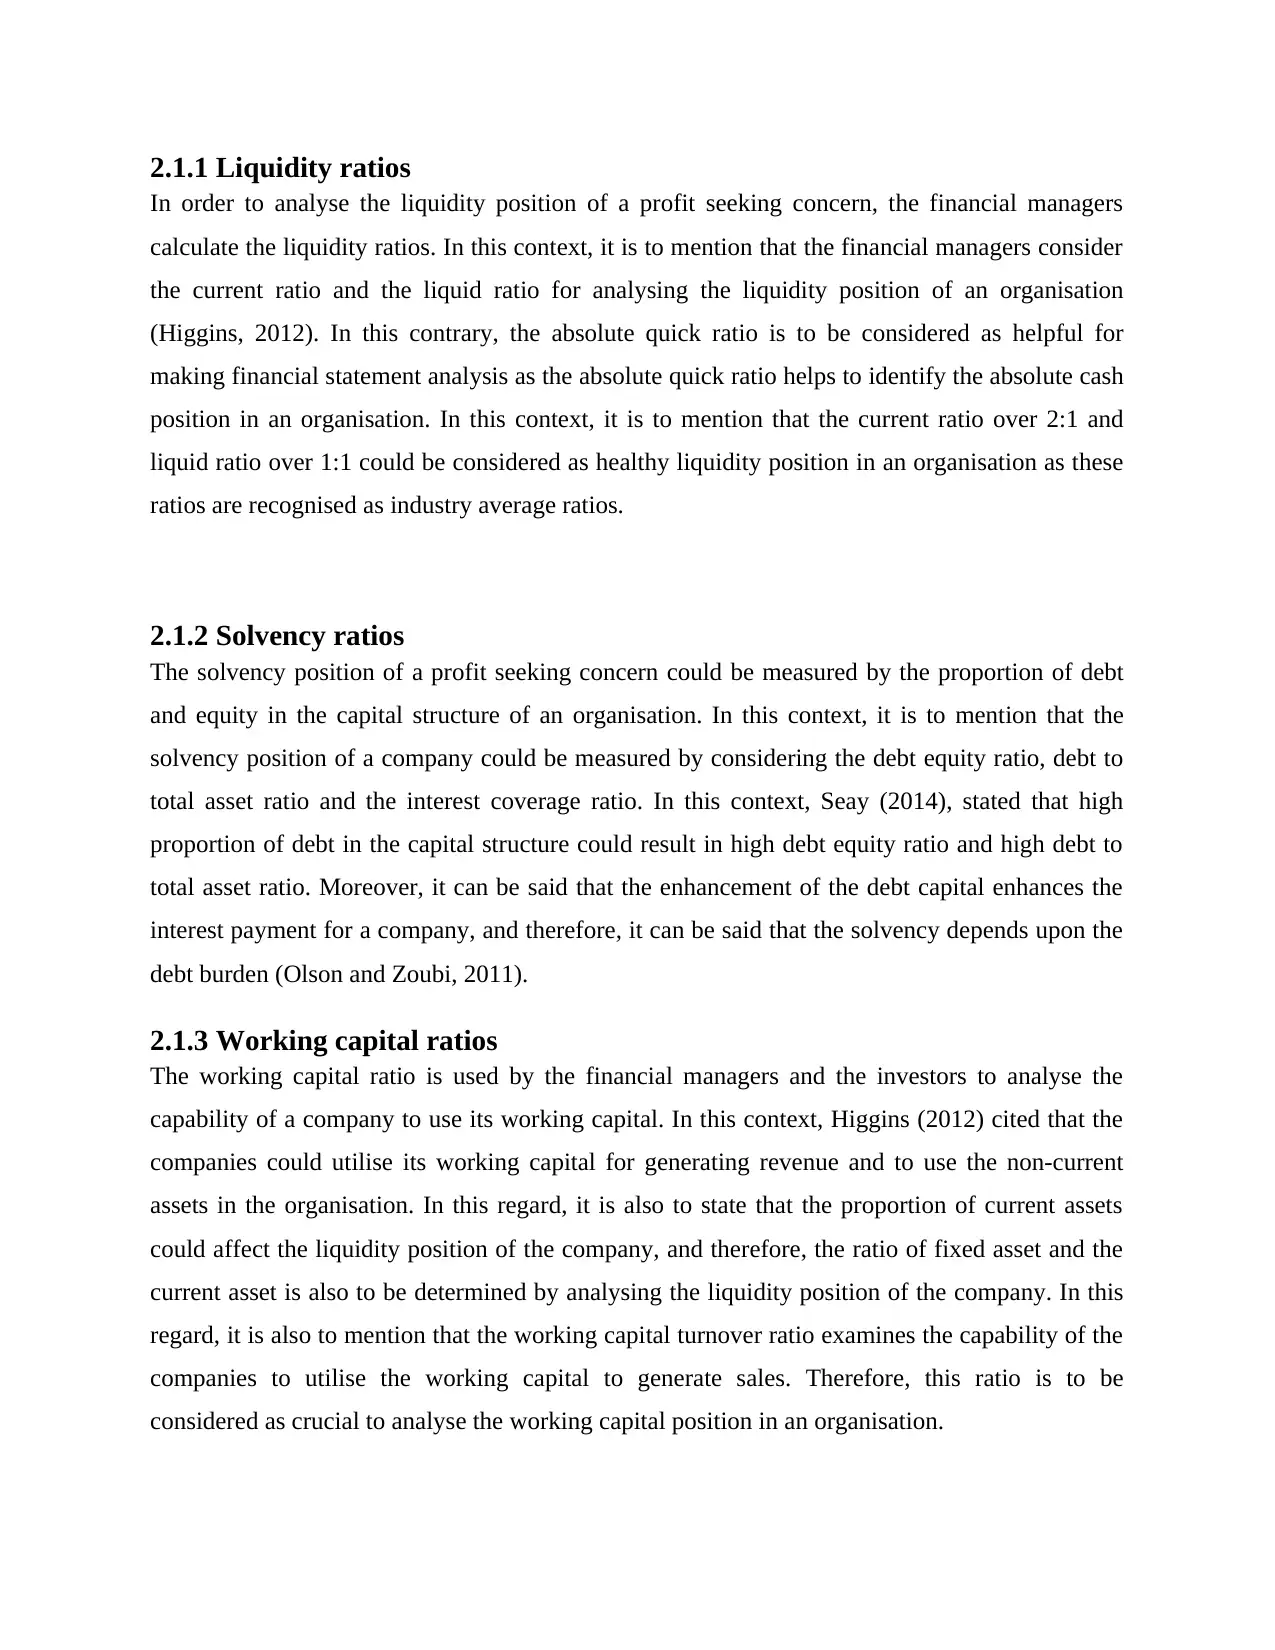
1. Introduction
Financial statement analysis helps the investors to make financial decisions as the analysis of the
financial statements reflects the financial health of an organisation. In this research, the
researcher shall conduct the analysis of the financial report of Carpetright plc. Initially, the
discussion shall be made on the critical discussion regarding the ratio analysis and the balance
score card. The comparison between the financial reports of the company would also be
discussed in this study to analyse the financial performance of the company. On the other hand, it
is to mention that the researcher shall analyse the strategic performance of the company by
conducting the Balance Scorecard approach. Furthermore, the researcher shall develop the
strategy for the company by considering the financial and strategic performance of the company.
2. Literature review
2.1 Ratio analysis
In ratio analysis, the financial analysts could analyse the liquidity position and the profitability
position of a profit seeking concern and therefore, the financial analysis could be found as
difficult without considering the ratio analysis. According to Vogel (2014), management of an
organisation considers ratio analysis to analyse the financial performance of the organization. In
this regard, it is to mention that the ratio analysis facilitates the management of a company to
compare the financial performance with the industry average. In this same context, Cucchiella et
al. (2015) opined that the ratio analysis is helpful for making the comparative study of the
performance of a company as the researchers could identify the trend of the ratios. In this regard,
it is to mention that the management or other users of accounting information could examine the
liquidity position, solvency position, working capital, profitability position and the asset
efficiency of an entity (Healy and Palepu, 2012).
Paraphrase This Document
Need a fresh take? Get an instant paraphrase of this document with our AI Paraphraser
2.1.1 Liquidity ratios
In order to analyse the liquidity position of a profit seeking concern, the financial managers
calculate the liquidity ratios. In this context, it is to mention that the financial managers consider
the current ratio and the liquid ratio for analysing the liquidity position of an organisation
(Higgins, 2012). In this contrary, the absolute quick ratio is to be considered as helpful for
making financial statement analysis as the absolute quick ratio helps to identify the absolute cash
position in an organisation. In this context, it is to mention that the current ratio over 2:1 and
liquid ratio over 1:1 could be considered as healthy liquidity position in an organisation as these
ratios are recognised as industry average ratios.
2.1.2 Solvency ratios
The solvency position of a profit seeking concern could be measured by the proportion of debt
and equity in the capital structure of an organisation. In this context, it is to mention that the
solvency position of a company could be measured by considering the debt equity ratio, debt to
total asset ratio and the interest coverage ratio. In this context, Seay (2014), stated that high
proportion of debt in the capital structure could result in high debt equity ratio and high debt to
total asset ratio. Moreover, it can be said that the enhancement of the debt capital enhances the
interest payment for a company, and therefore, it can be said that the solvency depends upon the
debt burden (Olson and Zoubi, 2011).
2.1.3 Working capital ratios
The working capital ratio is used by the financial managers and the investors to analyse the
capability of a company to use its working capital. In this context, Higgins (2012) cited that the
companies could utilise its working capital for generating revenue and to use the non-current
assets in the organisation. In this regard, it is also to state that the proportion of current assets
could affect the liquidity position of the company, and therefore, the ratio of fixed asset and the
current asset is also to be determined by analysing the liquidity position of the company. In this
regard, it is also to mention that the working capital turnover ratio examines the capability of the
companies to utilise the working capital to generate sales. Therefore, this ratio is to be
considered as crucial to analyse the working capital position in an organisation.
2.1.4 Profitability ratios
Profitability ratios help to identify the earning capacity of an organisation and to make
comparative analysis of the profitability of companies in the similar industry. In this regard, it is
to mention that the net profit ratio and the gross profit ratio are considered as the key profitability
ratios to make such comparison. In this same context, Ogiela (2013) stated that comparison of
profitability of a company by considering the financial results of a current year and previous year
could help to identify the trend of earning capacity of the company. Hence, the performance
evaluation of an organisation could be effectively made by considering the profitability ratios
(Klingenberg et al. 2013).
2.1.5 Asset efficiency ratios
Asset efficiency ratio helps to identify the efficiency of the total assets and the current assets and
therefore it can be said that the utility of assets could be analysed by considering the asset
efficiency of the companies. High asset efficiency ratio could be taken as a healthy asset
utilisation position for the organisation (Li and Sun, 2011).
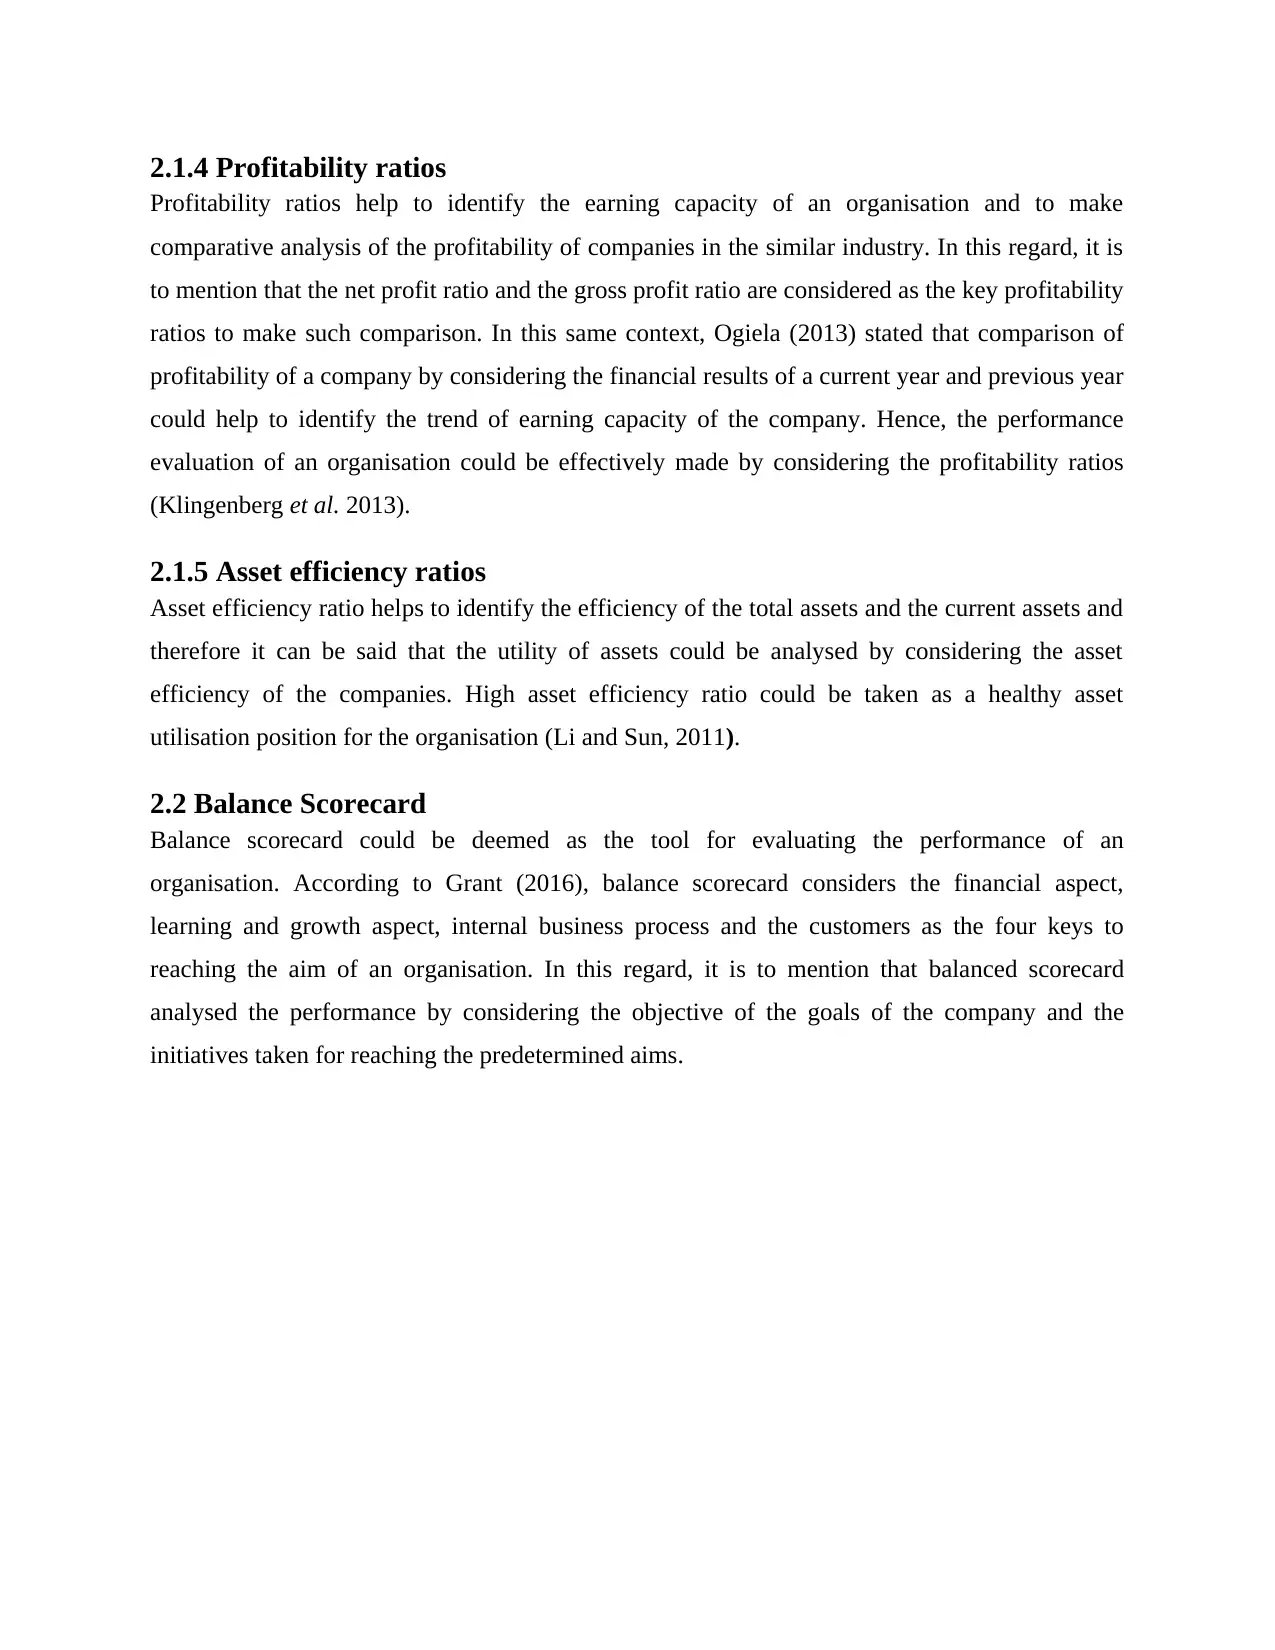
2.2 Balance Scorecard
Balance scorecard could be deemed as the tool for evaluating the performance of an
organisation. According to Grant (2016), balance scorecard considers the financial aspect,
learning and growth aspect, internal business process and the customers as the four keys to
reaching the aim of an organisation. In this regard, it is to mention that balanced scorecard
analysed the performance by considering the objective of the goals of the company and the
initiatives taken for reaching the predetermined aims.
Profitability ratios help to identify the earning capacity of an organisation and to make
comparative analysis of the profitability of companies in the similar industry. In this regard, it is
to mention that the net profit ratio and the gross profit ratio are considered as the key profitability
ratios to make such comparison. In this same context, Ogiela (2013) stated that comparison of
profitability of a company by considering the financial results of a current year and previous year
could help to identify the trend of earning capacity of the company. Hence, the performance
evaluation of an organisation could be effectively made by considering the profitability ratios
(Klingenberg et al. 2013).
2.1.5 Asset efficiency ratios
Asset efficiency ratio helps to identify the efficiency of the total assets and the current assets and
therefore it can be said that the utility of assets could be analysed by considering the asset
efficiency of the companies. High asset efficiency ratio could be taken as a healthy asset
utilisation position for the organisation (Li and Sun, 2011).
2.2 Balance Scorecard
Balance scorecard could be deemed as the tool for evaluating the performance of an
organisation. According to Grant (2016), balance scorecard considers the financial aspect,
learning and growth aspect, internal business process and the customers as the four keys to
reaching the aim of an organisation. In this regard, it is to mention that balanced scorecard
analysed the performance by considering the objective of the goals of the company and the
initiatives taken for reaching the predetermined aims.
⊘ This is a preview!⊘
Do you want full access?
Subscribe today to unlock all pages.
Trusted by 1+ million students worldwide
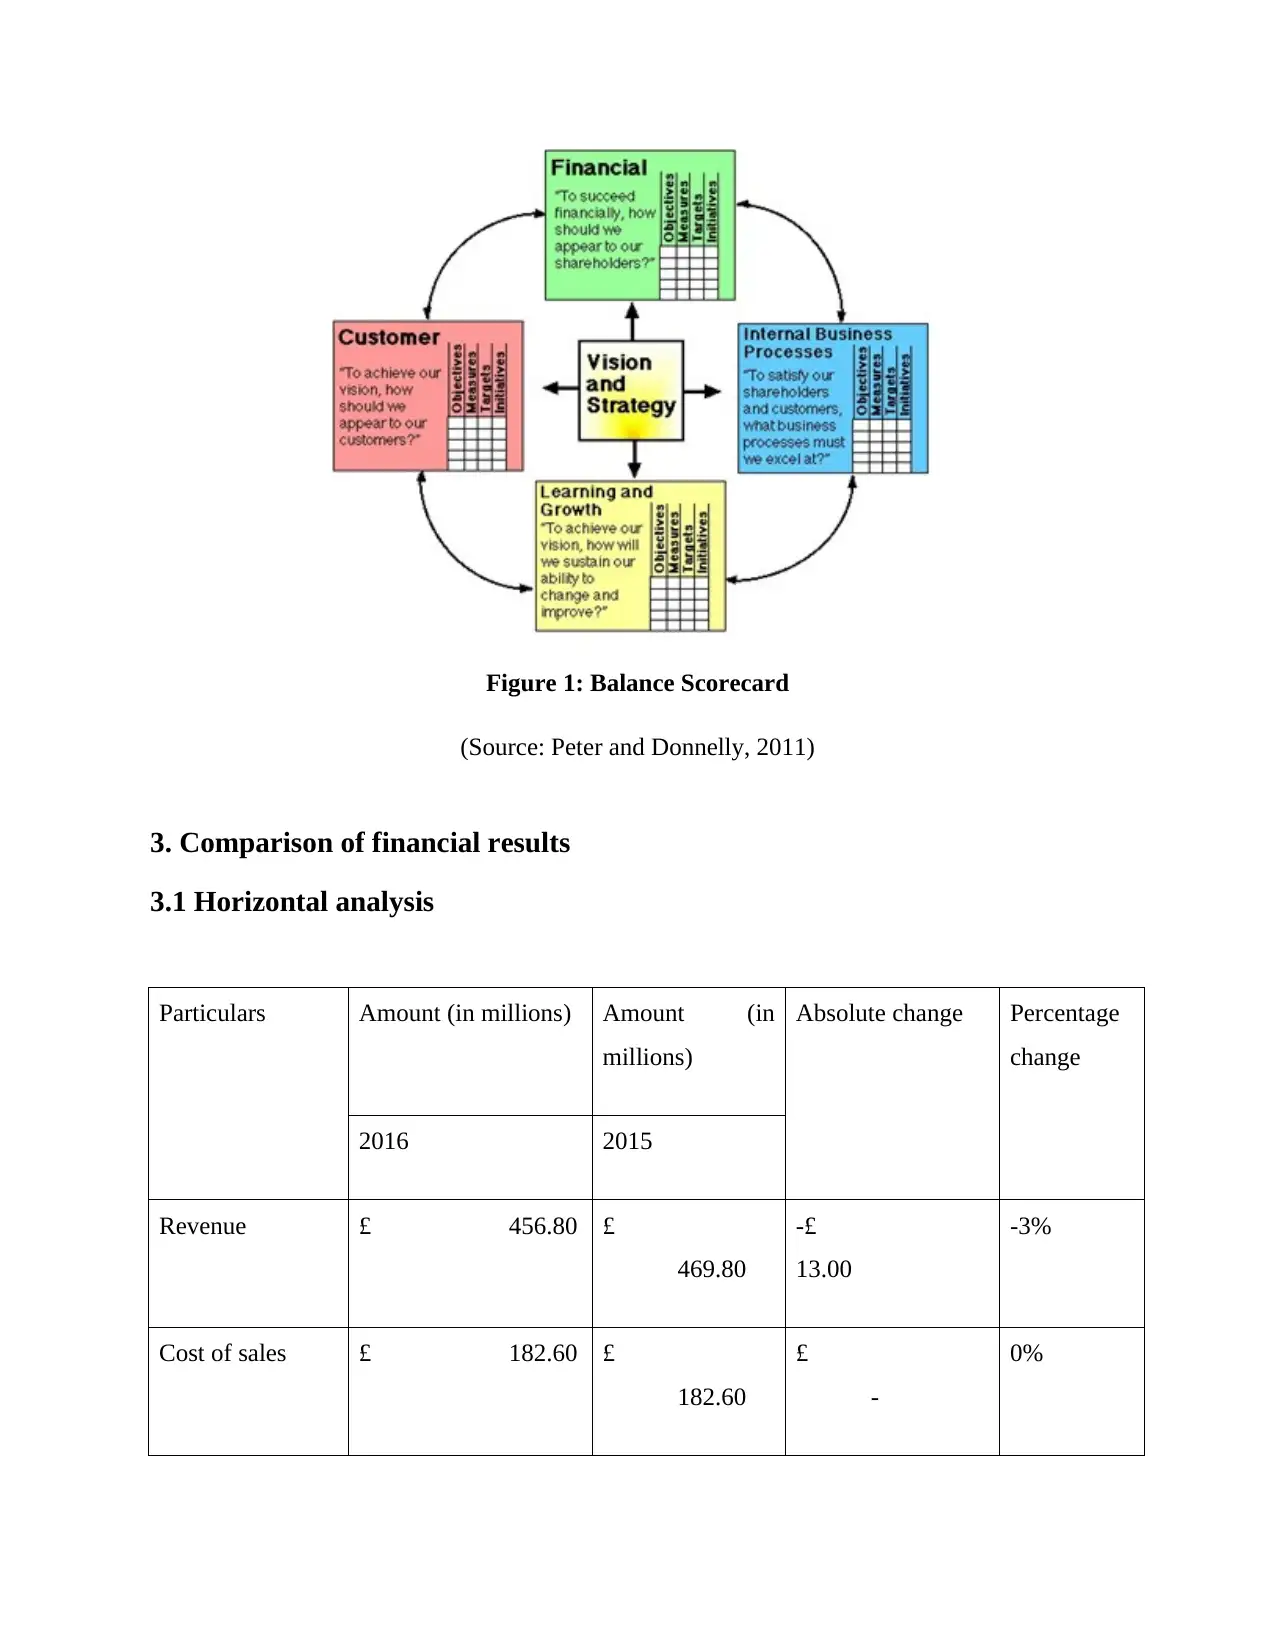
Figure 1: Balance Scorecard
(Source: Peter and Donnelly, 2011)
3. Comparison of financial results
3.1 Horizontal analysis
Particulars Amount (in millions) Amount (in
millions)
Absolute change Percentage
change
2016 2015
Revenue £ 456.80 £
469.80
-£
13.00
-3%
Cost of sales £ 182.60 £
182.60
£
-
0%
(Source: Peter and Donnelly, 2011)
3. Comparison of financial results
3.1 Horizontal analysis
Particulars Amount (in millions) Amount (in
millions)
Absolute change Percentage
change
2016 2015
Revenue £ 456.80 £
469.80
-£
13.00
-3%
Cost of sales £ 182.60 £
182.60
£
-
0%
Paraphrase This Document
Need a fresh take? Get an instant paraphrase of this document with our AI Paraphraser
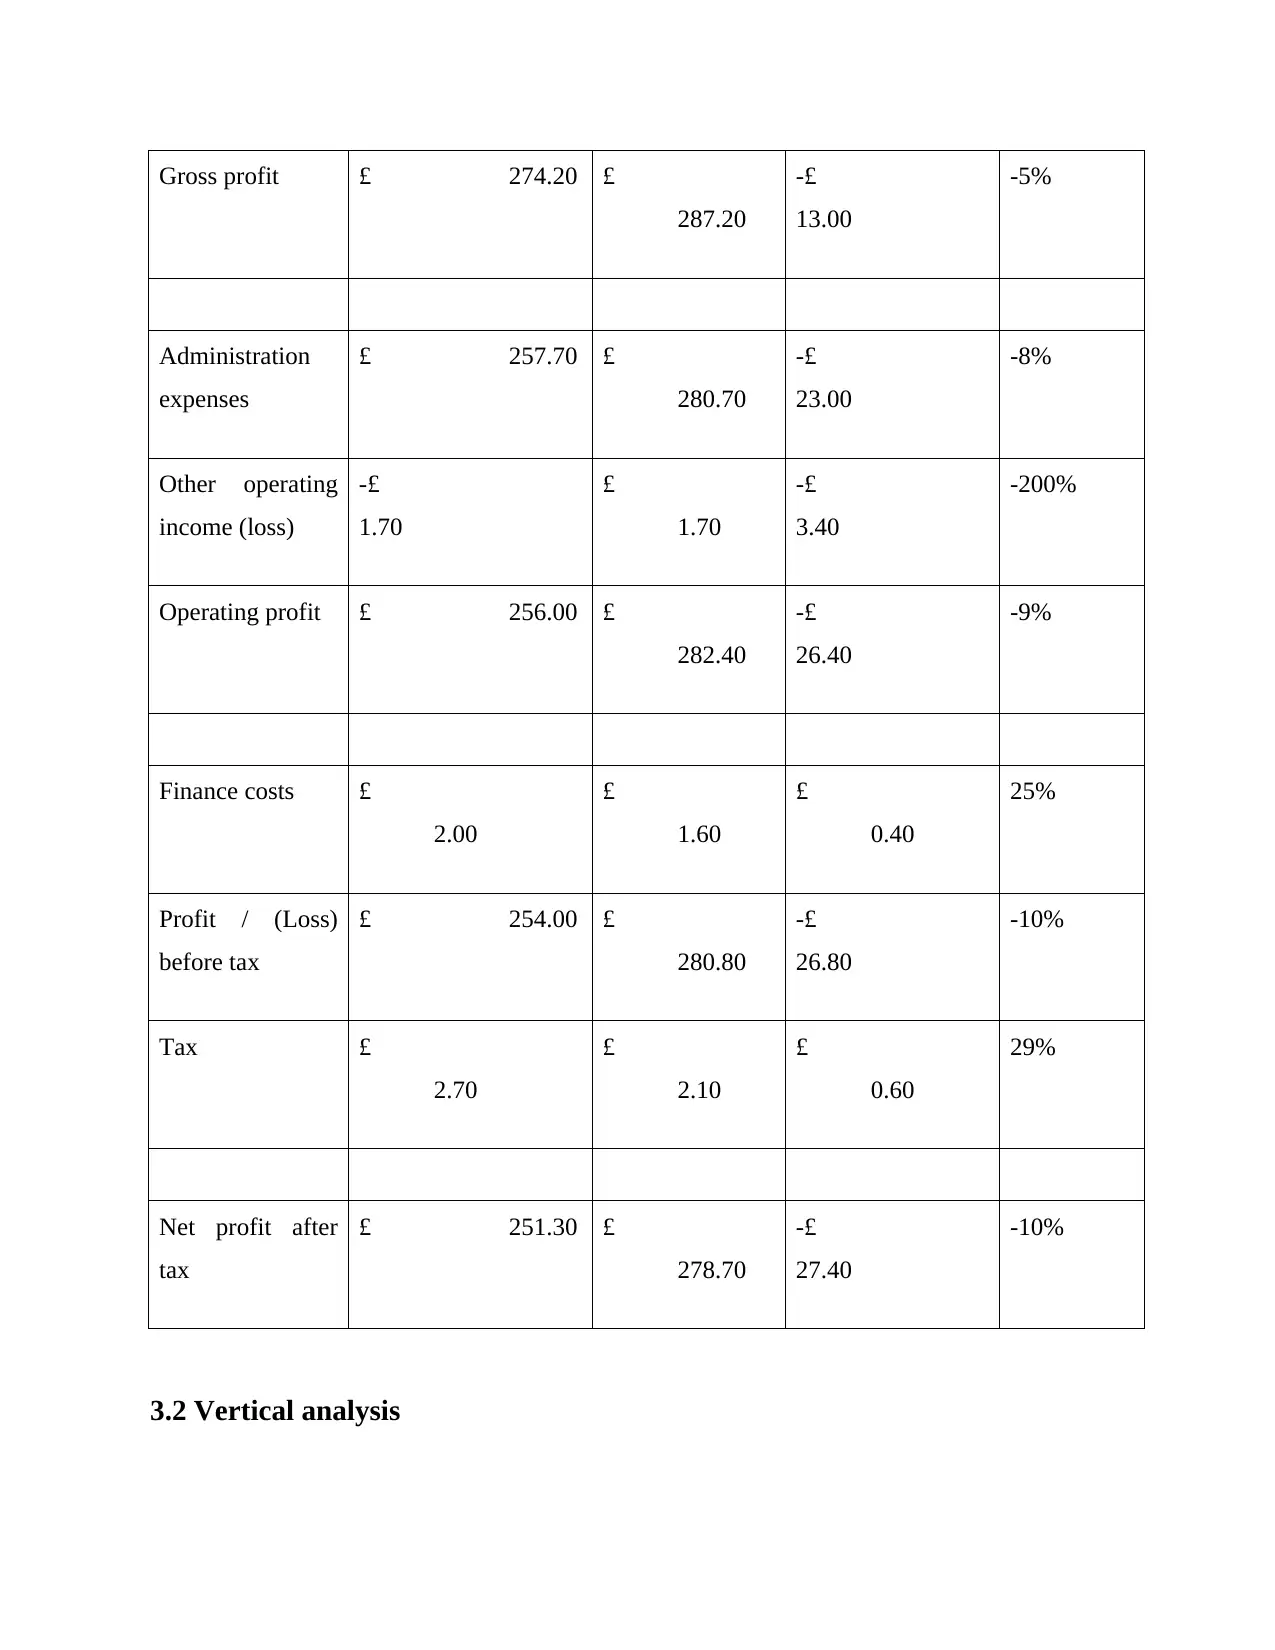
Gross profit £ 274.20 £
287.20
-£
13.00
-5%
Administration
expenses
£ 257.70 £
280.70
-£
23.00
-8%
Other operating
income (loss)
-£
1.70
£
1.70
-£
3.40
-200%
Operating profit £ 256.00 £
282.40
-£
26.40
-9%
Finance costs £
2.00
£
1.60
£
0.40
25%
Profit / (Loss)
before tax
£ 254.00 £
280.80
-£
26.80
-10%
Tax £
2.70
£
2.10
£
0.60
29%
Net profit after
tax
£ 251.30 £
278.70
-£
27.40
-10%
3.2 Vertical analysis
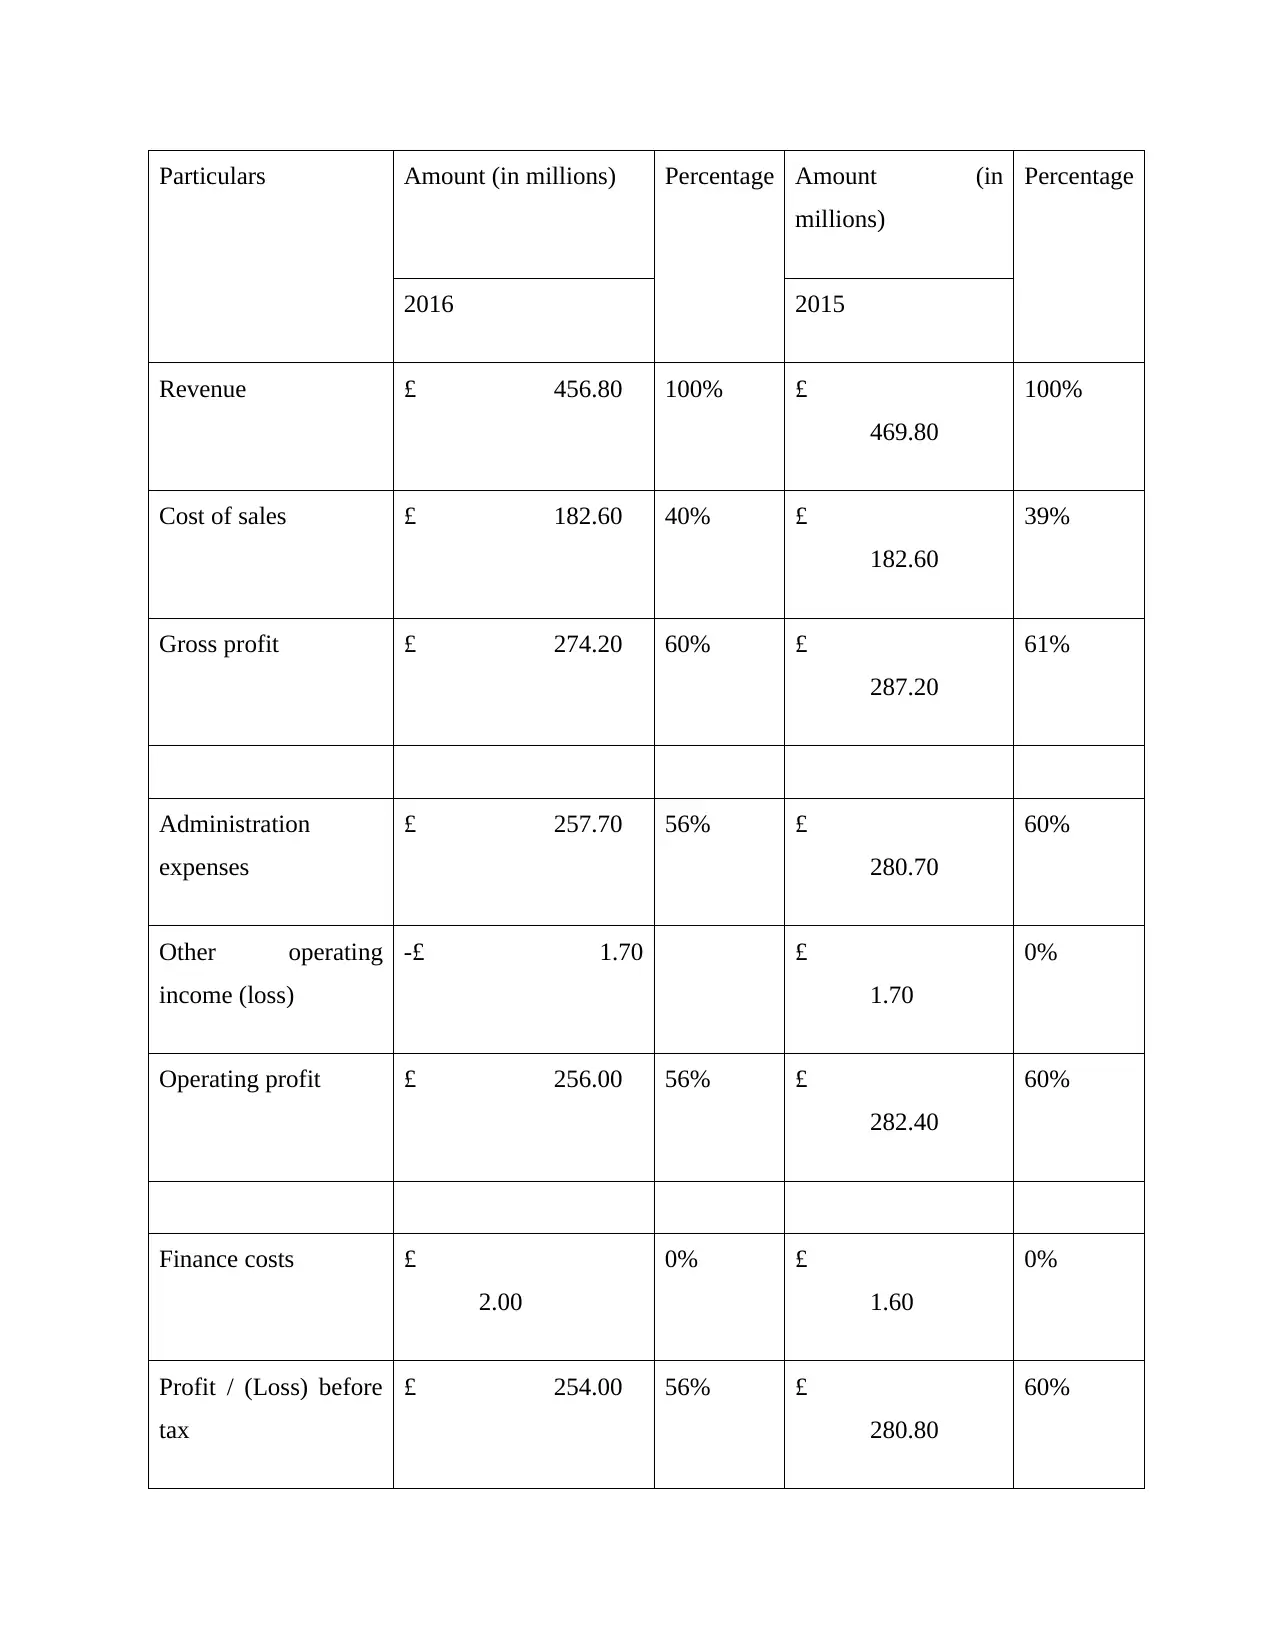
Particulars Amount (in millions) Percentage Amount (in
millions)
Percentage
2016 2015
Revenue £ 456.80 100% £
469.80
100%
Cost of sales £ 182.60 40% £
182.60
39%
Gross profit £ 274.20 60% £
287.20
61%
Administration
expenses
£ 257.70 56% £
280.70
60%
Other operating
income (loss)
-£ 1.70 £
1.70
0%
Operating profit £ 256.00 56% £
282.40
60%
Finance costs £
2.00
0% £
1.60
0%
Profit / (Loss) before
tax
£ 254.00 56% £
280.80
60%
⊘ This is a preview!⊘
Do you want full access?
Subscribe today to unlock all pages.
Trusted by 1+ million students worldwide
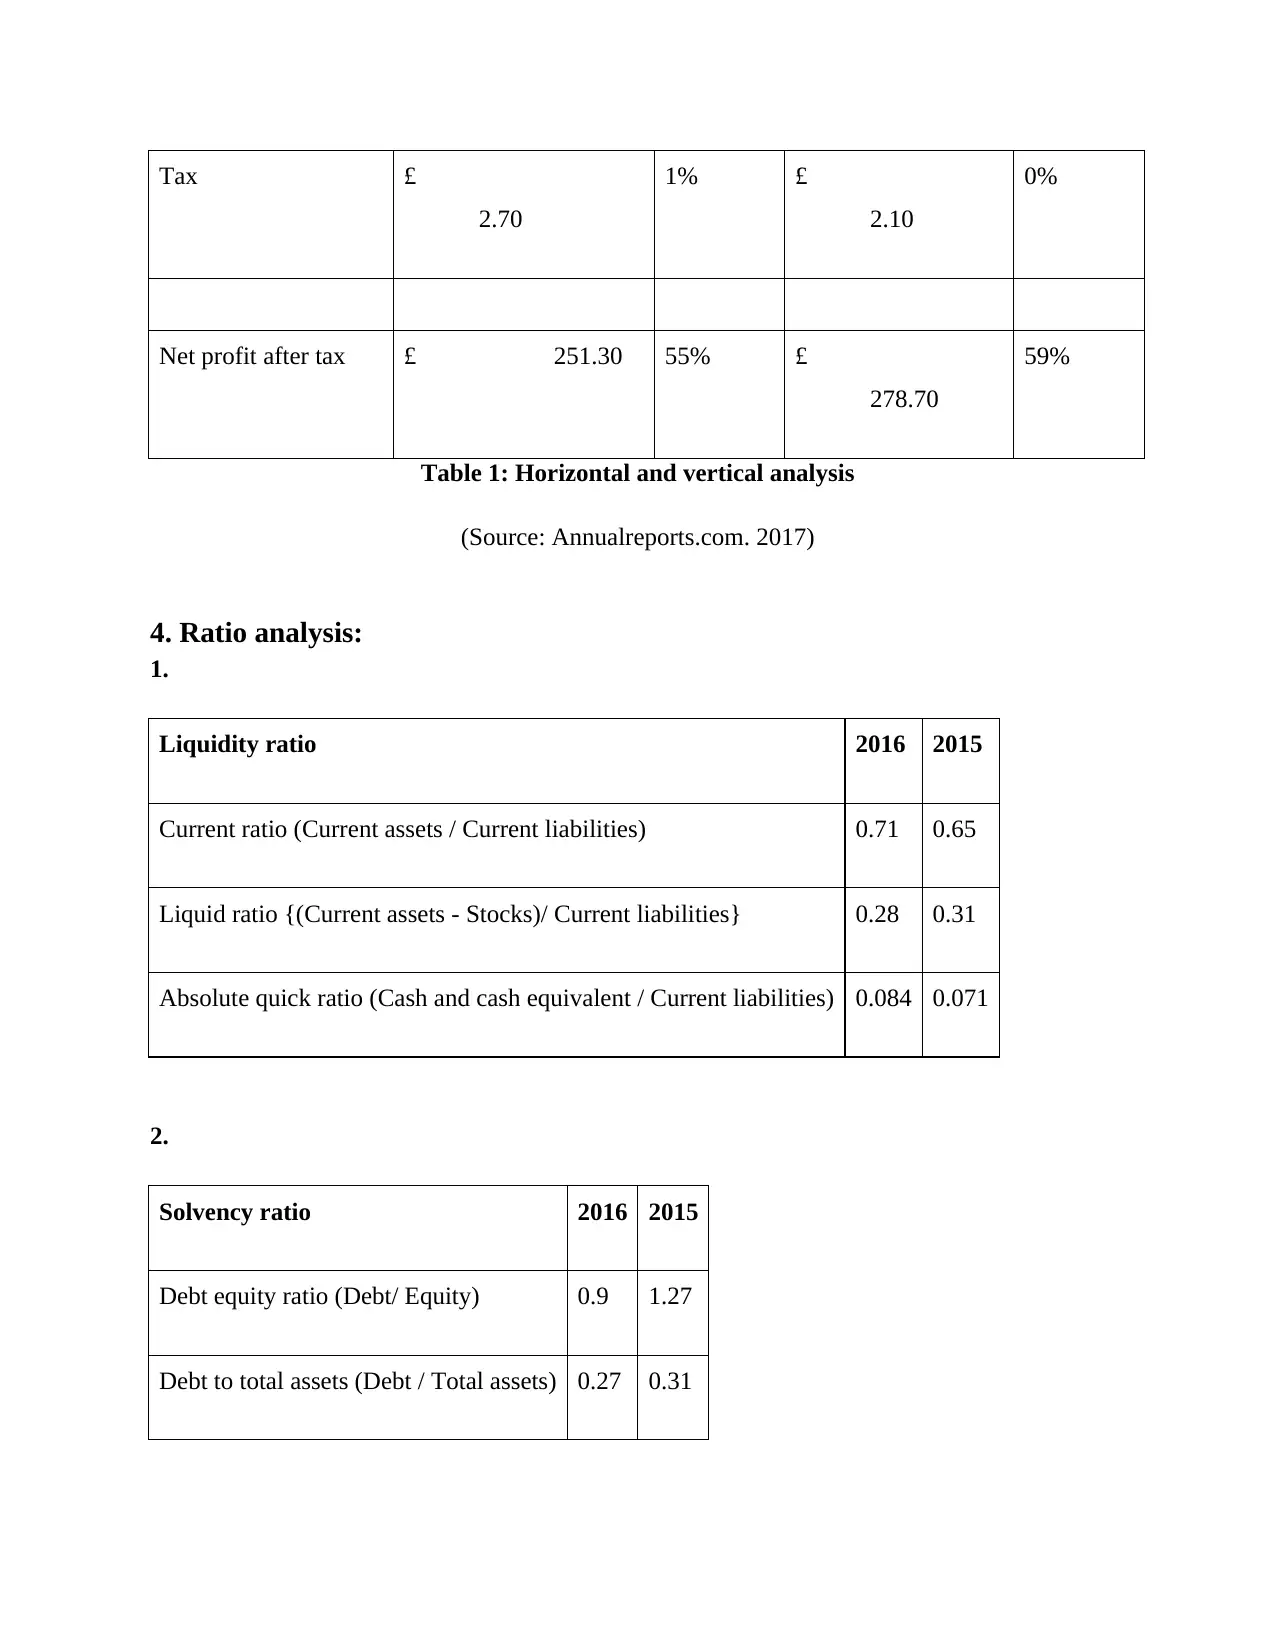
Tax £
2.70
1% £
2.10
0%
Net profit after tax £ 251.30 55% £
278.70
59%
Table 1: Horizontal and vertical analysis
(Source: Annualreports.com. 2017)
4. Ratio analysis:
1.
Liquidity ratio 2016 2015
Current ratio (Current assets / Current liabilities) 0.71 0.65
Liquid ratio {(Current assets - Stocks)/ Current liabilities} 0.28 0.31
Absolute quick ratio (Cash and cash equivalent / Current liabilities) 0.084 0.071
2.
Solvency ratio 2016 2015
Debt equity ratio (Debt/ Equity) 0.9 1.27
Debt to total assets (Debt / Total assets) 0.27 0.31
Paraphrase This Document
Need a fresh take? Get an instant paraphrase of this document with our AI Paraphraser
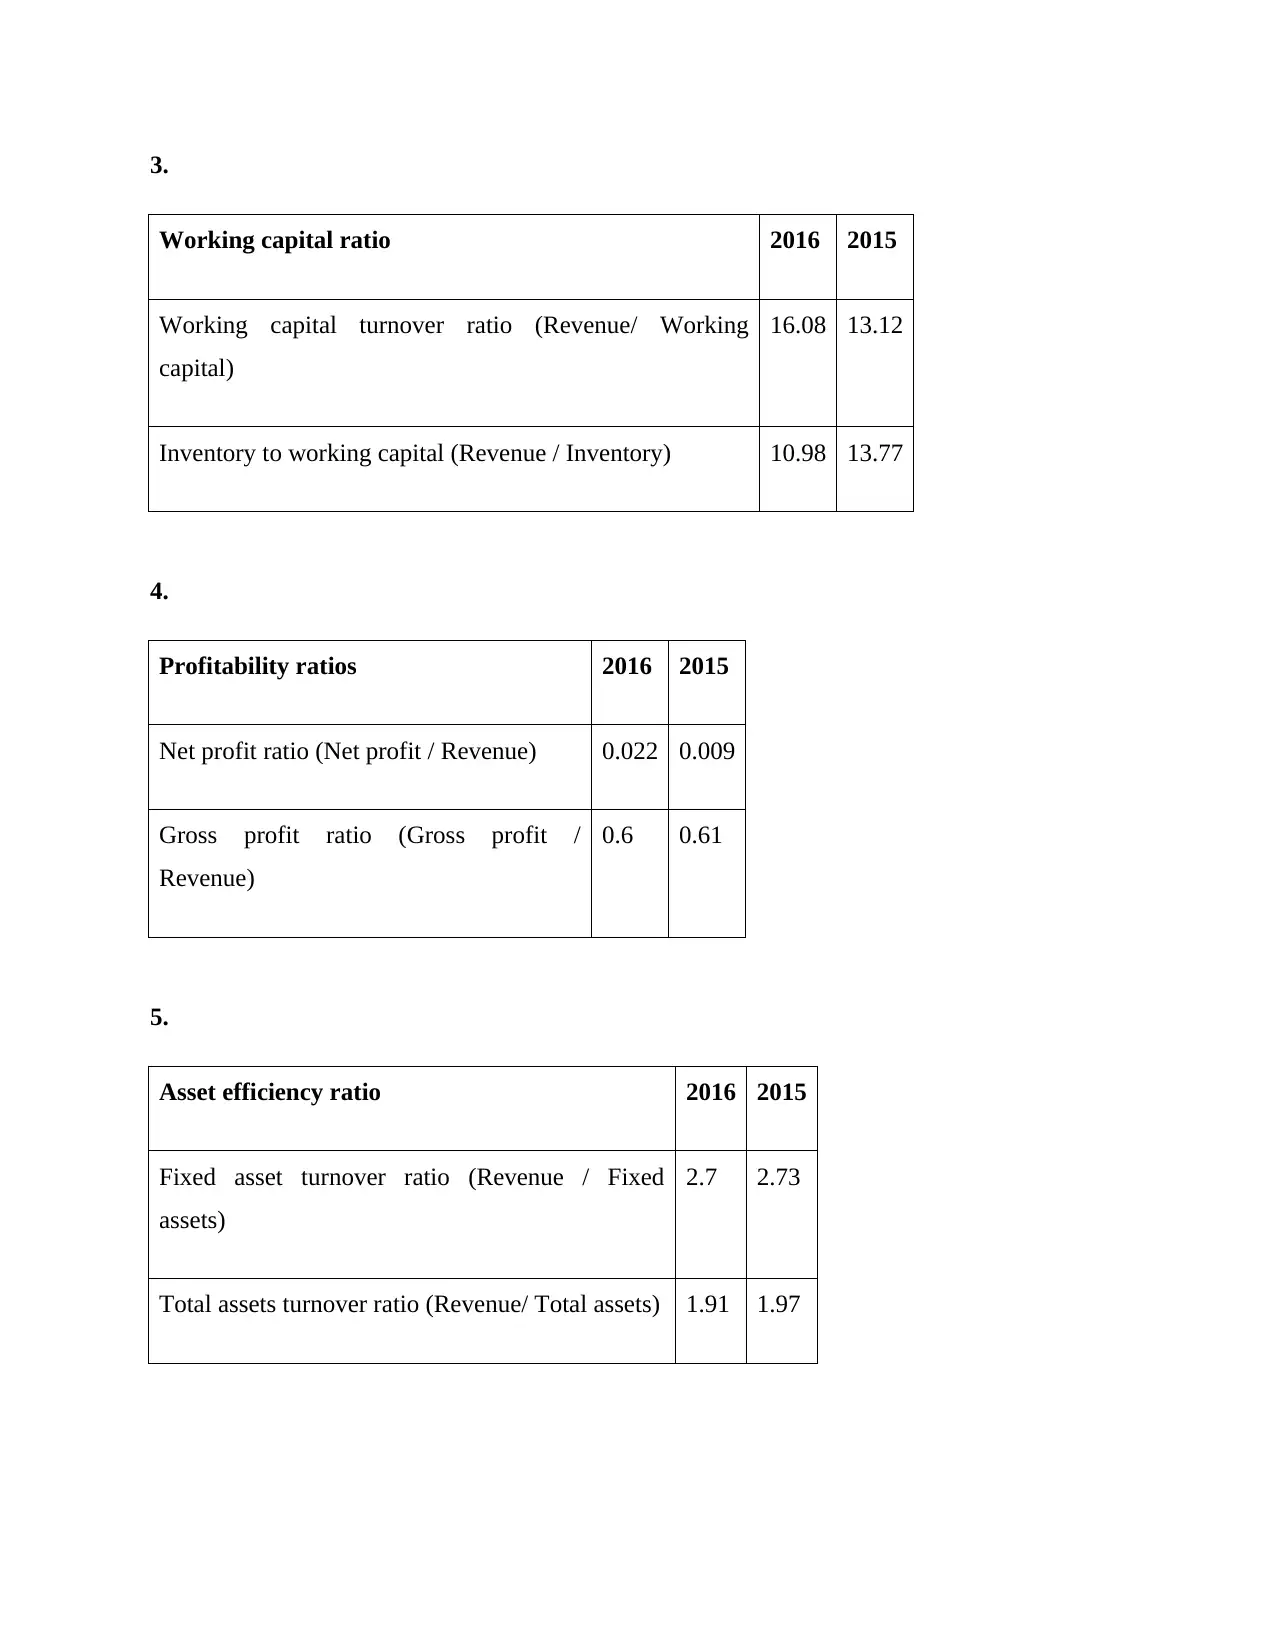
3.
Working capital ratio 2016 2015
Working capital turnover ratio (Revenue/ Working
capital)
16.08 13.12
Inventory to working capital (Revenue / Inventory) 10.98 13.77
4.
Profitability ratios 2016 2015
Net profit ratio (Net profit / Revenue) 0.022 0.009
Gross profit ratio (Gross profit /
Revenue)
0.6 0.61
5.
Asset efficiency ratio 2016 2015
Fixed asset turnover ratio (Revenue / Fixed
assets)
2.7 2.73
Total assets turnover ratio (Revenue/ Total assets) 1.91 1.97
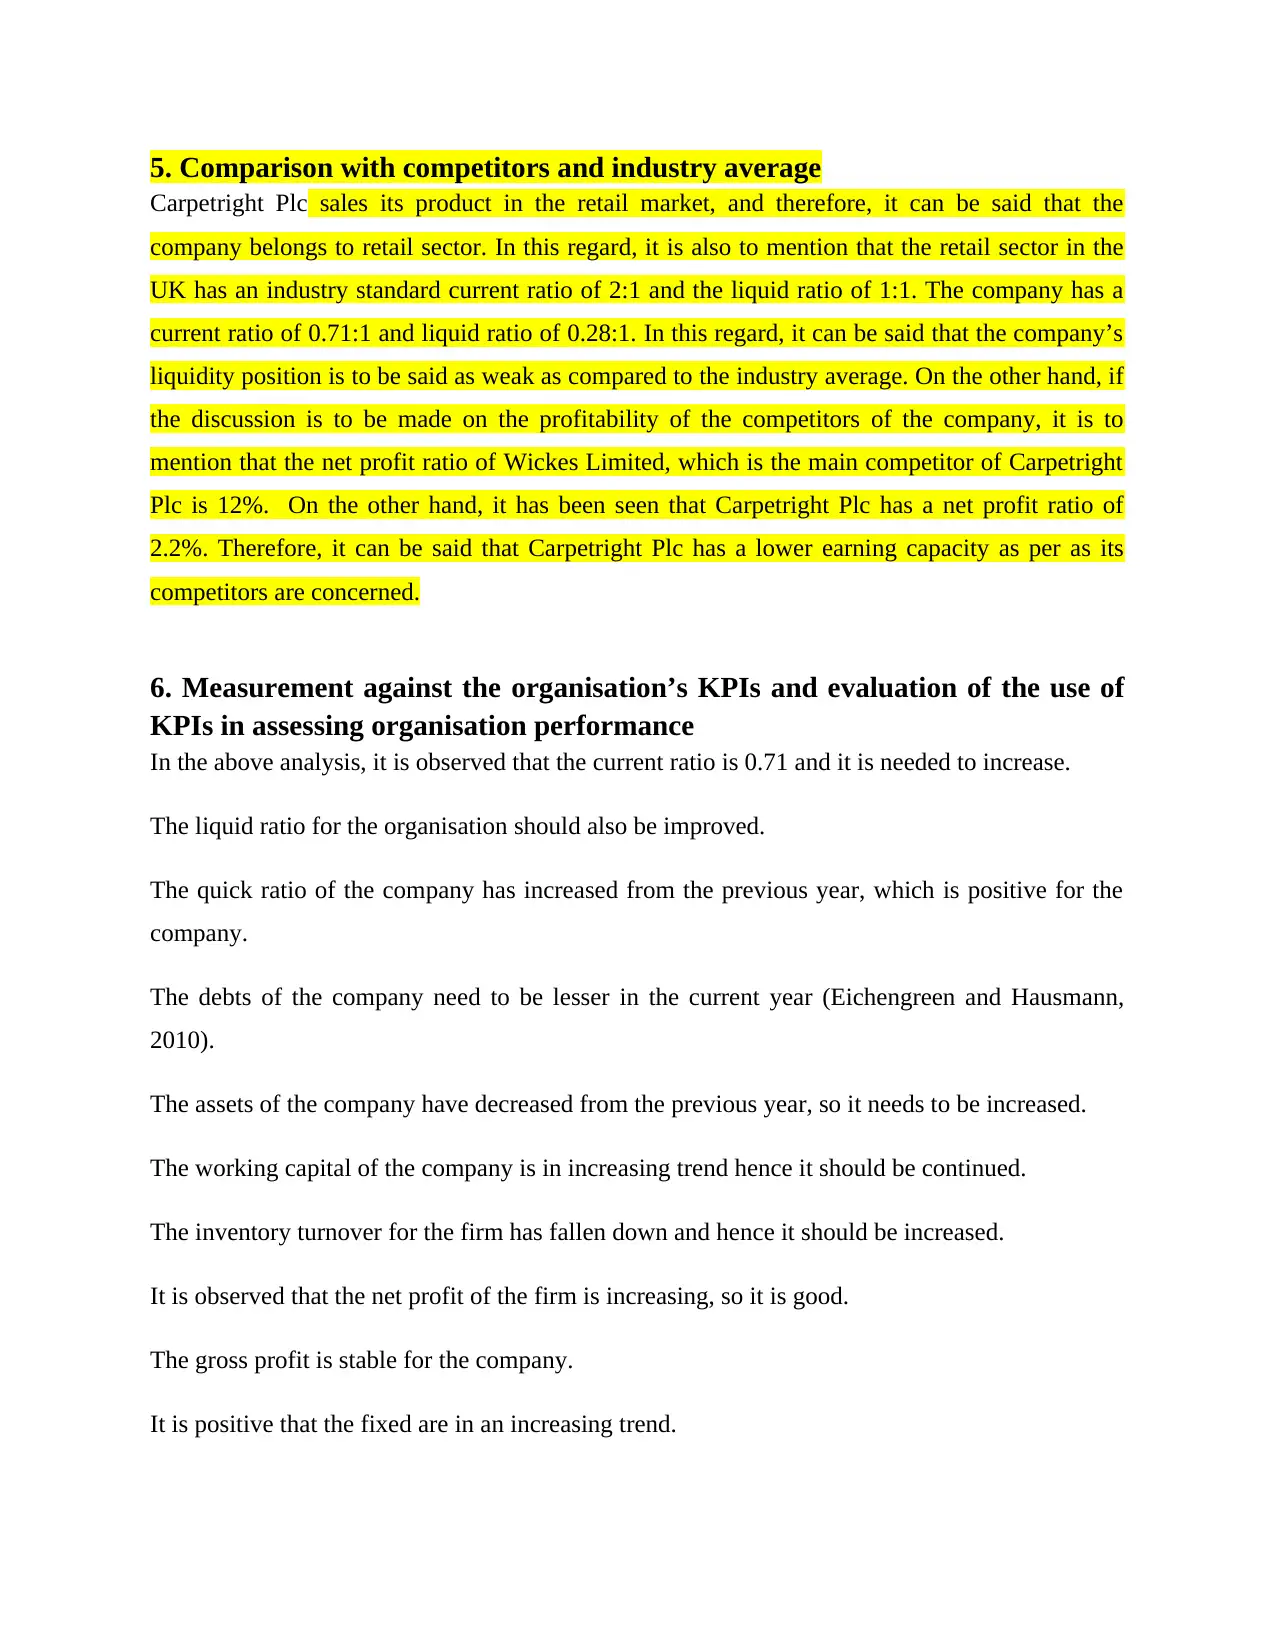
5. Comparison with competitors and industry average
Carpetright Plc sales its product in the retail market, and therefore, it can be said that the
company belongs to retail sector. In this regard, it is also to mention that the retail sector in the
UK has an industry standard current ratio of 2:1 and the liquid ratio of 1:1. The company has a
current ratio of 0.71:1 and liquid ratio of 0.28:1. In this regard, it can be said that the company’s
liquidity position is to be said as weak as compared to the industry average. On the other hand, if
the discussion is to be made on the profitability of the competitors of the company, it is to
mention that the net profit ratio of Wickes Limited, which is the main competitor of Carpetright
Plc is 12%. On the other hand, it has been seen that Carpetright Plc has a net profit ratio of
2.2%. Therefore, it can be said that Carpetright Plc has a lower earning capacity as per as its
competitors are concerned.
6. Measurement against the organisation’s KPIs and evaluation of the use of
KPIs in assessing organisation performance
In the above analysis, it is observed that the current ratio is 0.71 and it is needed to increase.
The liquid ratio for the organisation should also be improved.
The quick ratio of the company has increased from the previous year, which is positive for the
company.
The debts of the company need to be lesser in the current year (Eichengreen and Hausmann,
2010).
The assets of the company have decreased from the previous year, so it needs to be increased.
The working capital of the company is in increasing trend hence it should be continued.
The inventory turnover for the firm has fallen down and hence it should be increased.
It is observed that the net profit of the firm is increasing, so it is good.
The gross profit is stable for the company.
It is positive that the fixed are in an increasing trend.
⊘ This is a preview!⊘
Do you want full access?
Subscribe today to unlock all pages.
Trusted by 1+ million students worldwide
1 out of 18
Related Documents


Your All-in-One AI-Powered Toolkit for Academic Success.
+13062052269
info@desklib.com
Available 24*7 on WhatsApp / Email
![[object Object]](/_next/static/media/star-bottom.7253800d.svg)
Unlock your academic potential
Copyright © 2020–2026 A2Z Services. All Rights Reserved. Developed and managed by ZUCOL.