Carpooling Simulation for Dublin: Analysis Using Agent-Based Model
VerifiedAdded on 2022/10/01
|39
|7427
|316
Project
AI Summary
This project explores the potential of carpooling to reduce travel time in Dublin using an agent-based simulation model with the Janus platform. The model simulates agents traveling from point A to B, sharing rides, and compares the time and cost against bus travel. The study reviews Dublin's current transportation infrastructure, including the Dublin City Centre Transport Study and the implementation of Real Time Passenger Information (RTPI). The research aims to critically examine the effect of introducing carpooling in Dublin and to verify if it has the potential to meet the increasing population and reduce congestion in Dublin. The project includes a literature review, methodology description, results, and a conclusion, focusing on alternative approaches to improve transportation and address passenger frustrations with existing public transport options.
Abstract
Carpooling is one of the emerging method people are using to reduce the cost and time of
commuting (Carroll, P., Caulfield, B. and Ahern, A., 2017). The technique is eco-friendly and
sustainable in terms of time saved, cost, resource use and traffic congestion (Shahram Tahmasseby,
Lina Kattan & Brian Barbour, 2015). Carpooling involves car-sharing between people going to
similar or different destinations in a particular direction. The process of carpooling starts with the
motive for car-sharing, communication of purpose between various agents, negotiation, and
feedback. The reasons for carpooling may be time-saving, convenience, cost of resources, and other
constraints.
The paper will focus on the simulation model of carpooling with the Janus multi-agent platform.
Essentially, it will simulate carpooling where one agent travelling from point A to B so will put a
request in the model which is also accessible by another person moving in the same direction who
will pool the same car. The model will tell how much time each of the agents takes to reach their
destinations assuming in the same direction. Therefore, the model can be used to compare the time
and cost taken by bus and car to travel the same route. The aim is to find an alternative to reduce
travel time in Dublin, mainly focusing on how carpooling if introduced, will help in achieving this.
Paraphrase This Document
Need a fresh take? Get an instant paraphrase of this document with our AI Paraphraser
Chapter 1
Introduction
Introduction

1
⊘ This is a preview!⊘
Do you want full access?
Subscribe today to unlock all pages.
Trusted by 1+ million students worldwide
4
1.0 Introduction
1.1 Context
This research project is about exploring alternatives that could potentially reduce the travel time
users spend on public transport in Dublin. Independently of the demand for a particular route. In a
sense, the research project is about exploring alternative transportation options for Dublin, such as
carpooling; and understanding its potential impact via agent-based model experiments.
The public bus service follows strict timetable and other than being occasionally late it follows same
imposed rules, like for example bus 120 follows the route from Parnell Street to Ashtown and vice
versa starting from 6 a.m. with next bus at half an hour intervals and after 5 p.m the duration of next
bus increases to 45 to 50 minutes. With increasing use of technology, the public transport system
improved; however, its users still face many issues in travelling around; such as Real time passenger
information has been implemented, but the awareness and usage of this system differs from age
groups as per the finding mentioned in the case study of Dublin (Bryan Sweeney, Ba GPEP, 2012).
Even after the implementation of Real Time Information of the bus timings, there has been no
significant difference in the travel time that people experience (Bryan Sweeney, Ba GPEP, 2012). If
one misses the bus and has to be somewhere urgently the only current option is a taxi, and that is not
an affordable option to many, particularly if this need is presented with a certain regularity (e.g. daily
or occasional commute).
There are many routes in Dublin which are not connected by bus services or the frequency of buses
is just not good enough to meet the demand of the consumers, for example, if one has to travel from
Paraphrase This Document
Need a fresh take? Get an instant paraphrase of this document with our AI Paraphraser
5
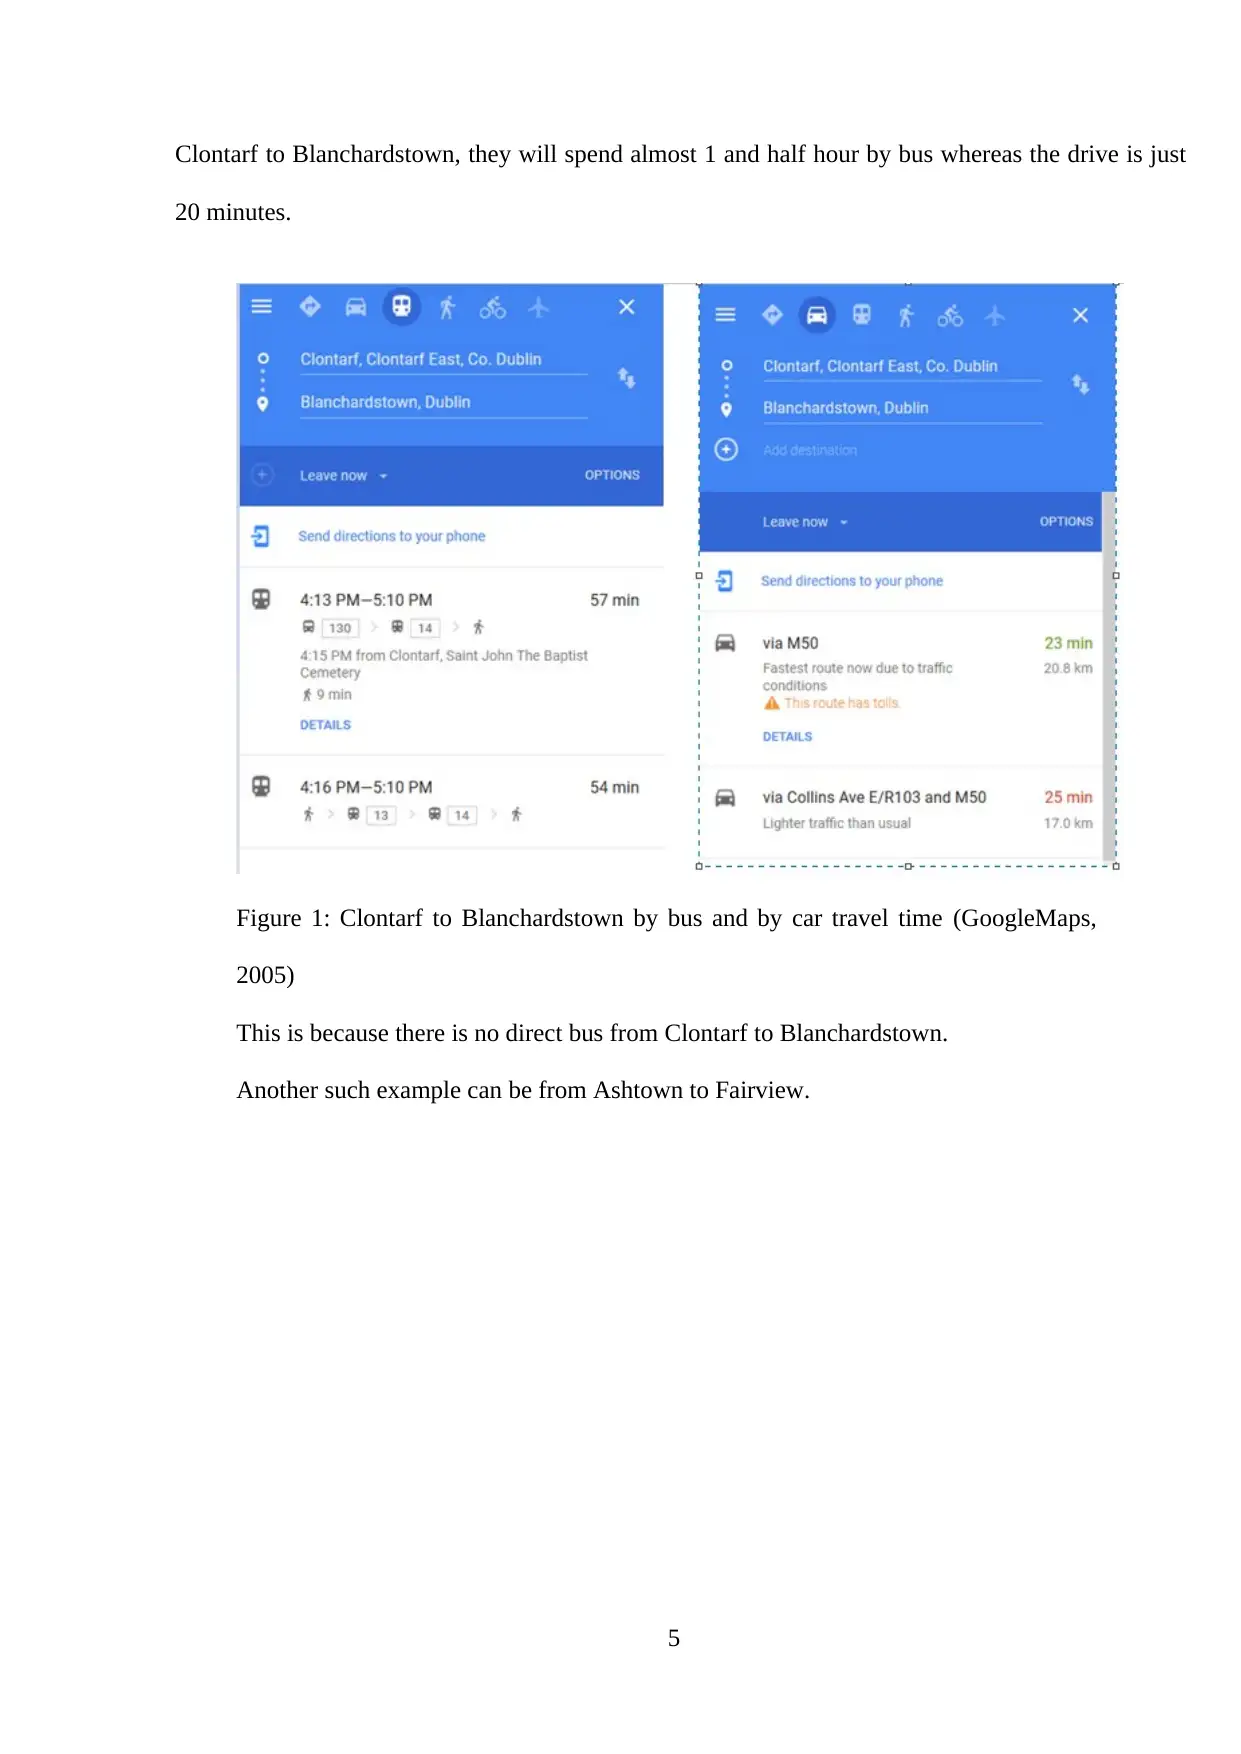
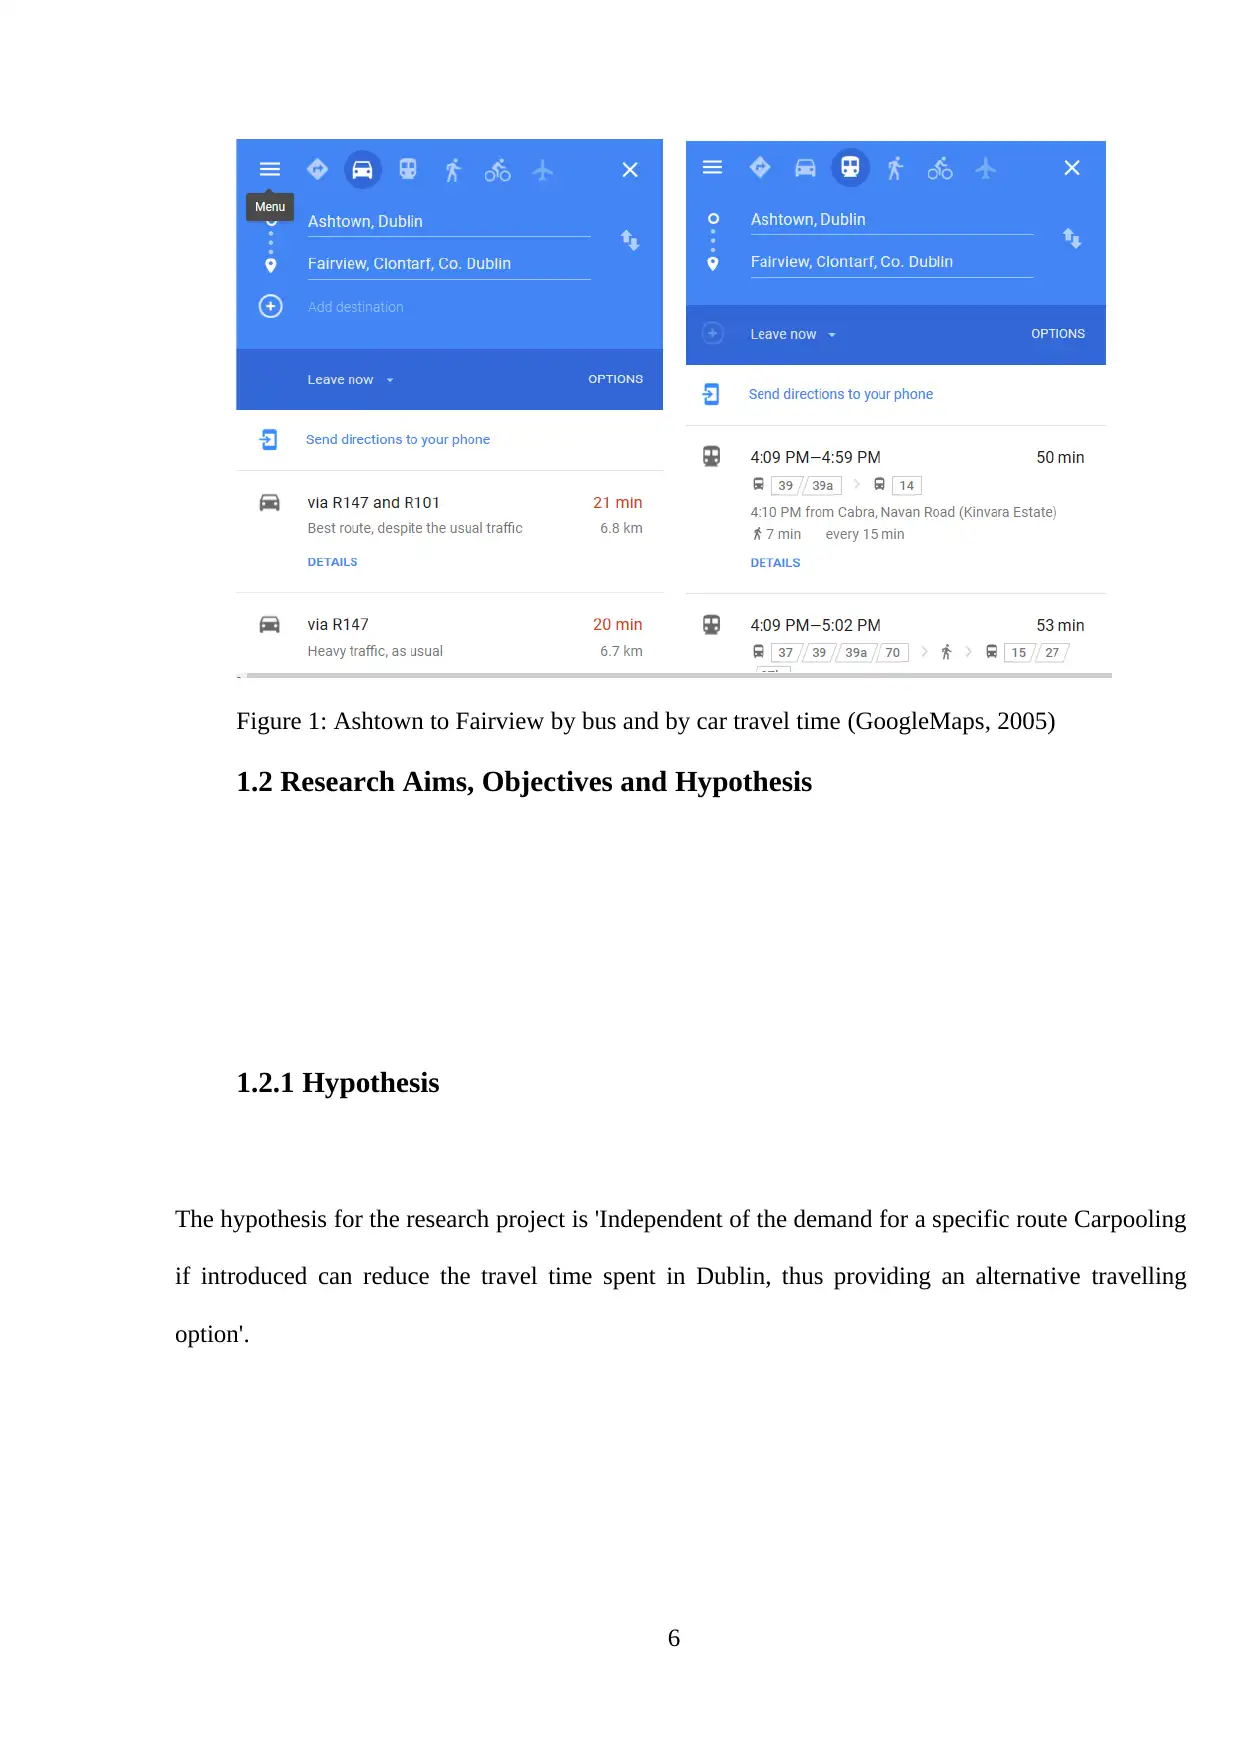
Clontarf to Blanchardstown, they will spend almost 1 and half hour by bus whereas the drive is just
20 minutes.
Figure 1: Clontarf to Blanchardstown by bus and by car travel time (GoogleMaps,
2005)
This is because there is no direct bus from Clontarf to Blanchardstown.
Another such example can be from Ashtown to Fairview.
6
Figure 1: Ashtown to Fairview by bus and by car travel time (GoogleMaps, 2005)
1.2 Research Aims, Objectives and Hypothesis
1.2.1 Hypothesis
The hypothesis for the research project is 'Independent of the demand for a specific route Carpooling
if introduced can reduce the travel time spent in Dublin, thus providing an alternative travelling
option'.
⊘ This is a preview!⊘
Do you want full access?
Subscribe today to unlock all pages.
Trusted by 1+ million students worldwide
7
1.2.2 Aim
The study aims to critically examine the effect of introducing car-pooling in Dublin
and to verify if it has the potential to meet the increasing population and reduce
congestion in Dublin.
1.2.3 Objectives
In order for these aims to be achieved a number of objectives were set out:
To explore the evidence on the benefits of implementing carpooling in
Dublin.
To research and analyse existing systems or new approaches already proposed for the
same cause.
To examine the reliability of carpooling.
To establish what are the passengers greatest frustrations associated with taking
the bus, taxies etc. while traveling in Dublin.
Paraphrase This Document
Need a fresh take? Get an instant paraphrase of this document with our AI Paraphraser
8
1.3 Research Structure
This capstone research project paper comprises of five chapters. The first chapter is the
introduction; second is the literature review, which will cover a range of related topics
regarding alternative approaches to improve transportation in Dublin and Dublin transportation
study. Chapter 3 describes the methodology used in the primary research, the agent-based
model and algorithms. Chapter 4 includes all of the main findings in the results Chapter, and
Chapter 5 is the conclusion.

9
Chapter 2
Literature Review
Chapter 2
Literature Review
⊘ This is a preview!⊘
Do you want full access?
Subscribe today to unlock all pages.
Trusted by 1+ million students worldwide
10
2.0 Literature Review
2.1 Introduction
This chapter will discuss all the relevant literature with regard to the current Dublin
transportation study. The literature further gives insights into what other approaches are
suggested to improve Dublin transportation and what passengers find to be the most frustrating
aspect of taking the bus?
2.2 Study Reviews
Dublin city center transport study has been developed as an input into the Dublin City council
development plan. The aim was to redefine the framework so that it can provide better
sustainability towards the transport infrastructure. The infrastructure for transport is considered
as one of the major aspects that need to be resolved. It has been identified that within the year
2010 and 2015, funding for the transport system was done around €97 million. This was
mainly provided with the use of NTA to Dublin City Council for facilitating the transport
infrastructure of the city (Becker, T.A., Caulfield, B. and Shiels, 2017). This program helped
in delivering many projects successfully and ensured that the entire basic infrastructure is
developed. That included spanning bus infrastructure, cycling, and road resurfacing, and
walking schemes, along with Real Time Passenger Information (RTPI) and traffic
management systems. The basic requirements that were identified by the city center transport
system include granting a future development that will meet the potential need of the city
center and will ensure that the infrastructure has been improved (Ahern, A., Vega, A. and
Caulfield, 2016). The main reason for implementing new infrastructure for the transport
Paraphrase This Document
Need a fresh take? Get an instant paraphrase of this document with our AI Paraphraser
11
system is to overcome the basic issues. The issues that are faced while managing the transport
includes the ban on taxi in college green so that they can have better control over the transport
system. Apart from this, there is a huge concern related to the access over mobility and
disabled people (Gieras, J.F., Piech, Z.J. and Tomczuk, 2018). The transport is being prepared
based on the 11 major street areas. This includes the college green area, Grafton Street lower,
Suffolk Street and St. Stephen's green and many more other streets. Apart from this, the city
has also been developed with the facility of appropriate public transport so that the customer
can get access across the street. It is expected that the journey time will be reliable and
predictable. With the integrated transport system, it is expected that the fare structure will also
get integrated that will avoid unnecessary penalty. This offers an easy way -to-use cashless
payment system for the purpose of public transport trips and for utilizing the supplementary
services (Koç, Çağrı & Bektas, Tolga & Jabali, Ola & Laporte, Gilbert, 2016). This service
mainly includes facilities related to car parking that enable multi-modal trips within the city
centre. The source includes integrated traffic management, vehicular traffic management, real
time passenger information and integrated transport fares and payment. Real time passenger
information on Dublin bus will provide better support towards the passengers and operators
(Hussam Achour, Abdul-Ghani Olabi, 2016). They store all the details regarding the people
travelling on the bus. The RTPI technology is used for the passengers so that they can access
up to date, and real time information on buses. This is both from the end of RTPI poles at bus
stops, as well as via mobile apps, such as the Transport for Ireland Journey Planner.
The proposed network for the transport will provide a better outline for the Dublin city
council's development plan. This will ensure that all the key strategies are being fulfilled
successfully. The proposed strategy will ensure that the footpaths prepared are wider and are
at key locations. Apart from this, the proposed pedestrian routes will include good signage,
surfaces and lighting. Provision for tourists will be provided along with the linking key Dublin
12
tourist destinations into the "strategic" network (Consultation. dublincity.ie., 2019). This will
help in providing better services towards the tourist destination point. The proposed network
will also include removal of unnecessary street clutter that will provide better mobility. This
will allow facilitating the passenger with better services on Luas Cross City, that is currently
under construction.
In addition to this, with the implementation of these proposals, it will also increase the
frequency and carrying capacity that is associated with the DART Service. The other reason
behind facilitating the passenger services on the Phoenix Park Tunnel Link. This will also
enhance the interchange opportunities that are available between the rail services and other
public transport.
Thus from the above report, it can be concluded that with the proposal of a new transport
model it will become easy to manage the transport and traffic within the city centre. However,
there are several issues that are faced with an online survey. This includes access for
deliveries, access towards the car parks and ensuring that no anti-social behaviour. Thus it can
be stated that with the implementation of a new transport system it will become easy to
manage the activities.
According to (Kong, X., Li, M., Tang, T., Tian, K., Moreira-Matias, L. and Xia, F., 2018),
with the present implementation of the public transportation system, it is found that the people
are generally forced in order to adhere different types of timetables as well as fixed routes in
order to reach their journey however they are mainly impacted negatively with the rising issue
of the vehicles as well as because of the overcapacity. It is found that the buses generally need
to make different types of an endless journey in order to allow for the possibility of demand
with an improper way of knowing whether the entire trip that is done is worthy or not until it is
completed. Furthermore, this generally creates a harmful environmental impact with different
⊘ This is a preview!⊘
Do you want full access?
Subscribe today to unlock all pages.
Trusted by 1+ million students worldwide
1 out of 39
Related Documents


Your All-in-One AI-Powered Toolkit for Academic Success.
+13062052269
info@desklib.com
Available 24*7 on WhatsApp / Email
![[object Object]](/_next/static/media/star-bottom.7253800d.svg)
Unlock your academic potential
Copyright © 2020–2026 A2Z Services. All Rights Reserved. Developed and managed by ZUCOL.