Financial Analysis of Carsales.com: Finance Module Report, AUS
VerifiedAdded on 2020/05/11
|19
|2147
|87
Report
AI Summary
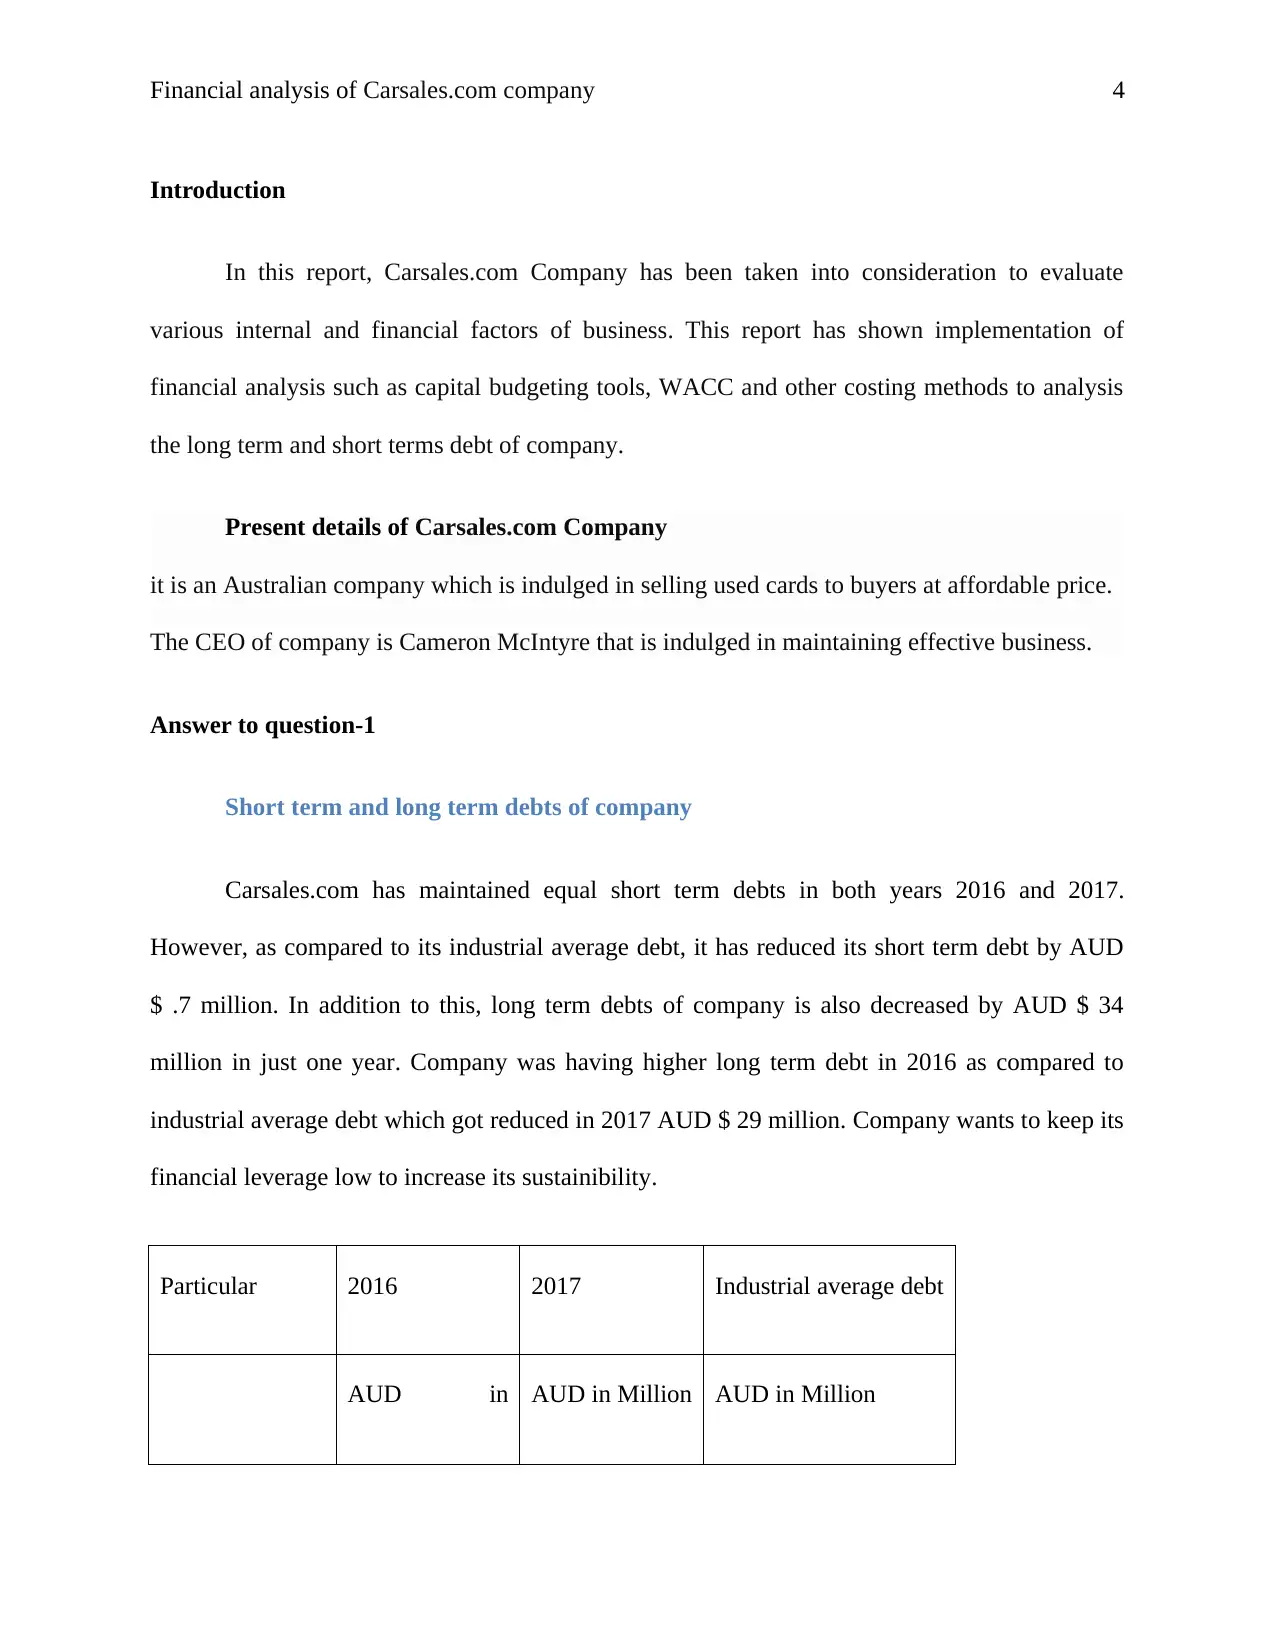
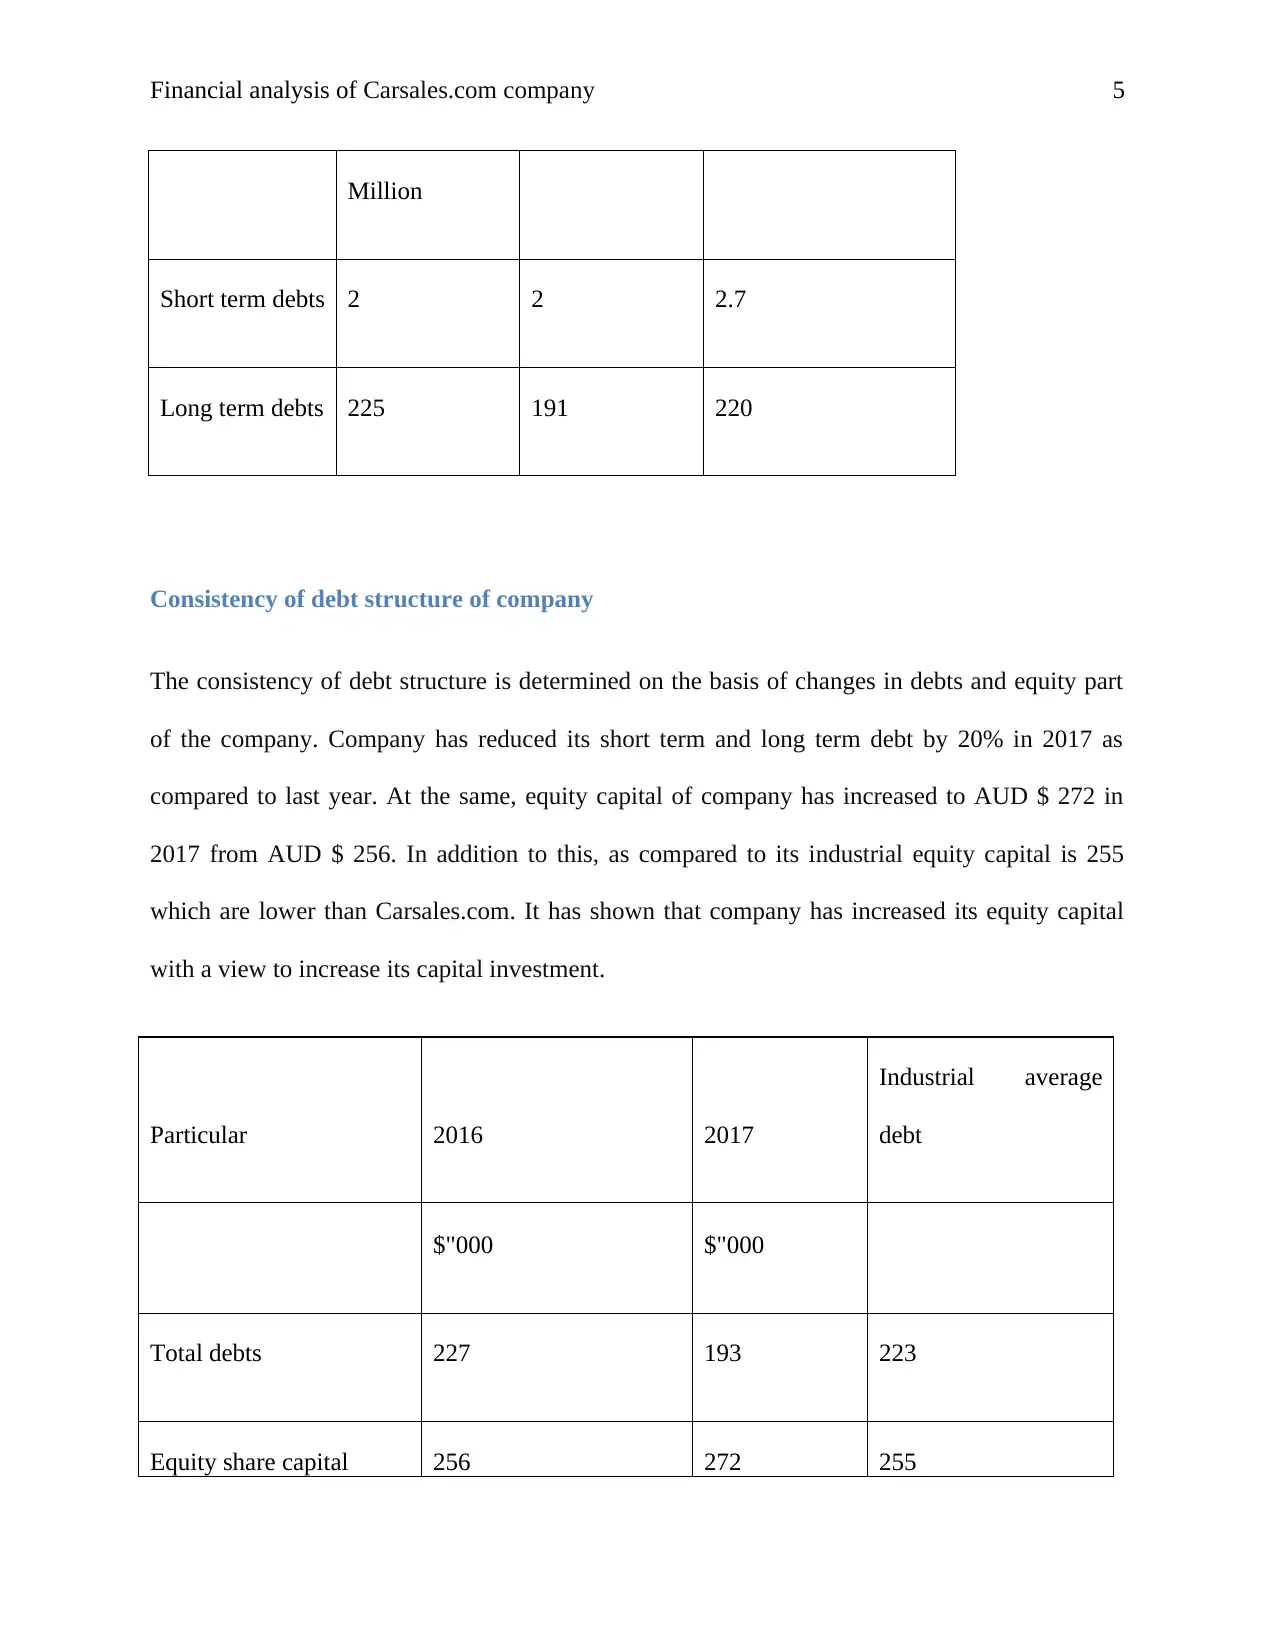
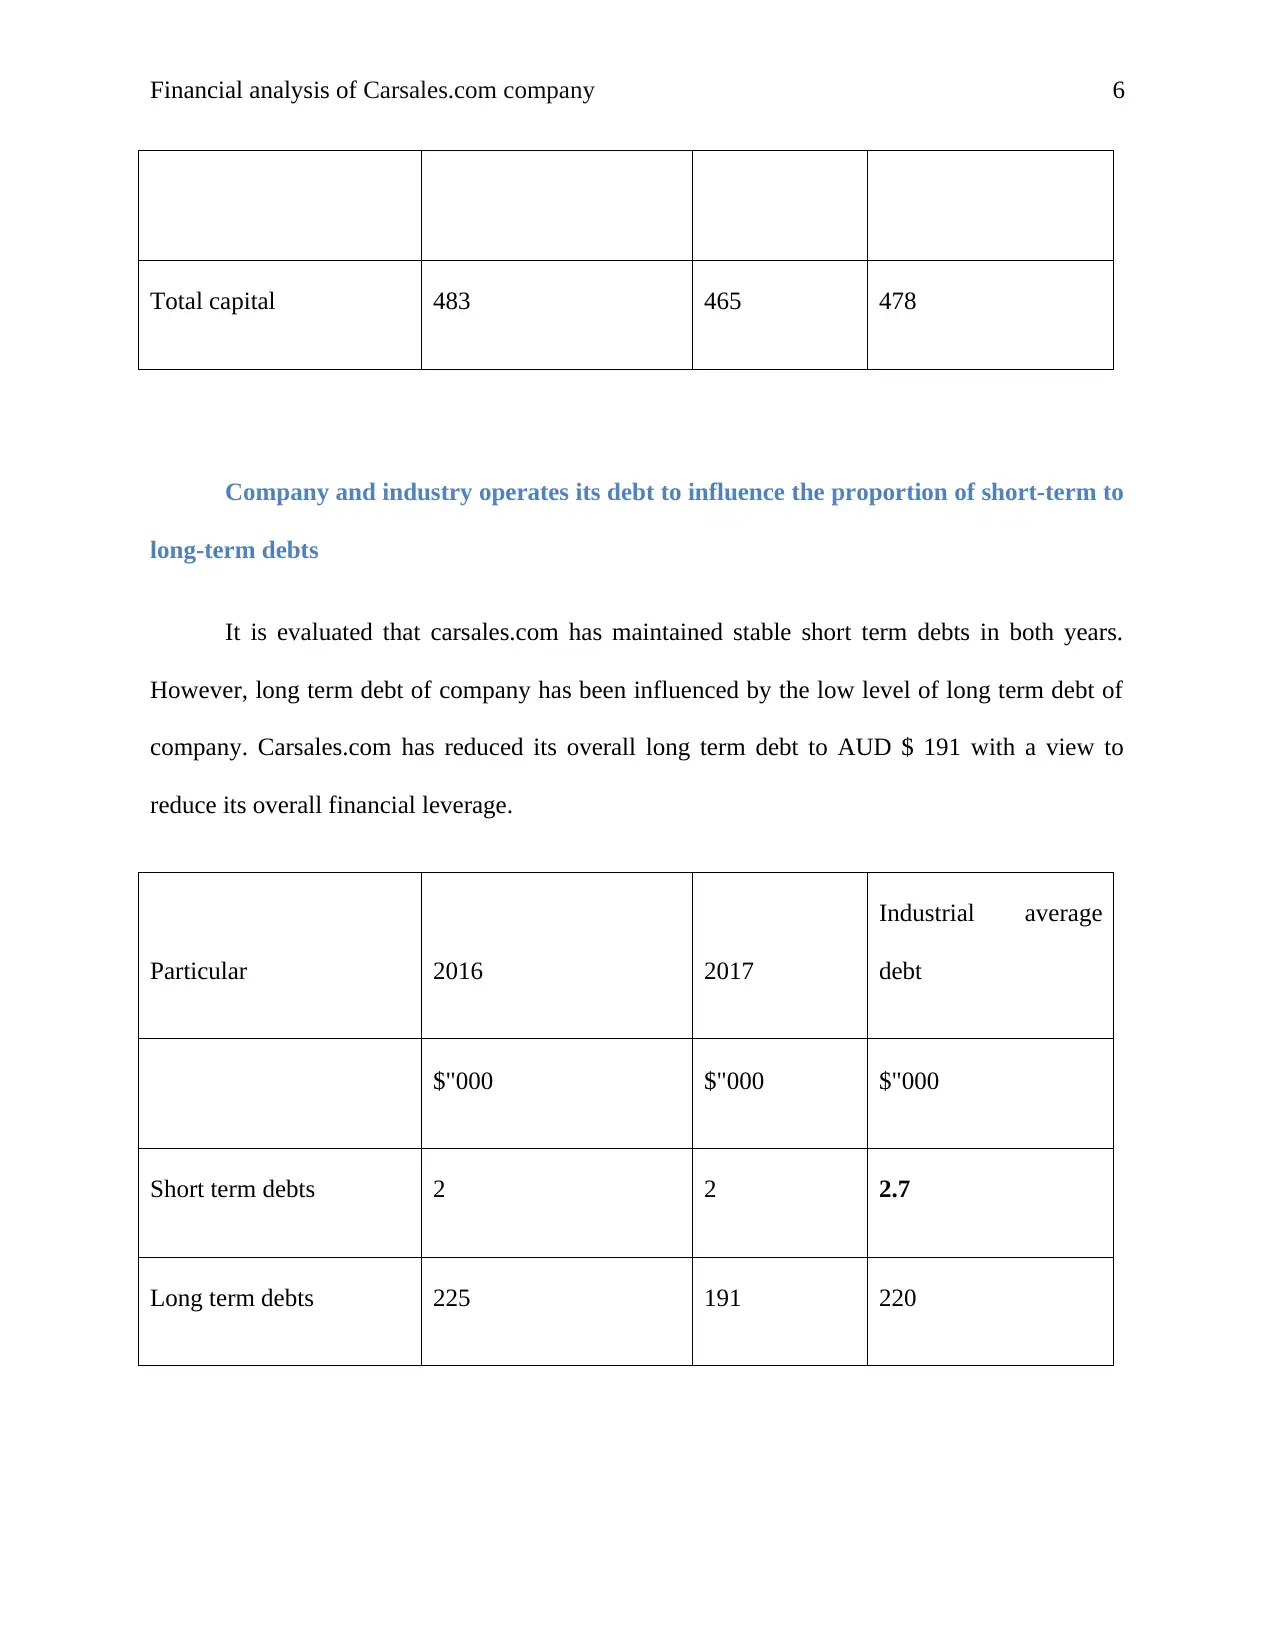
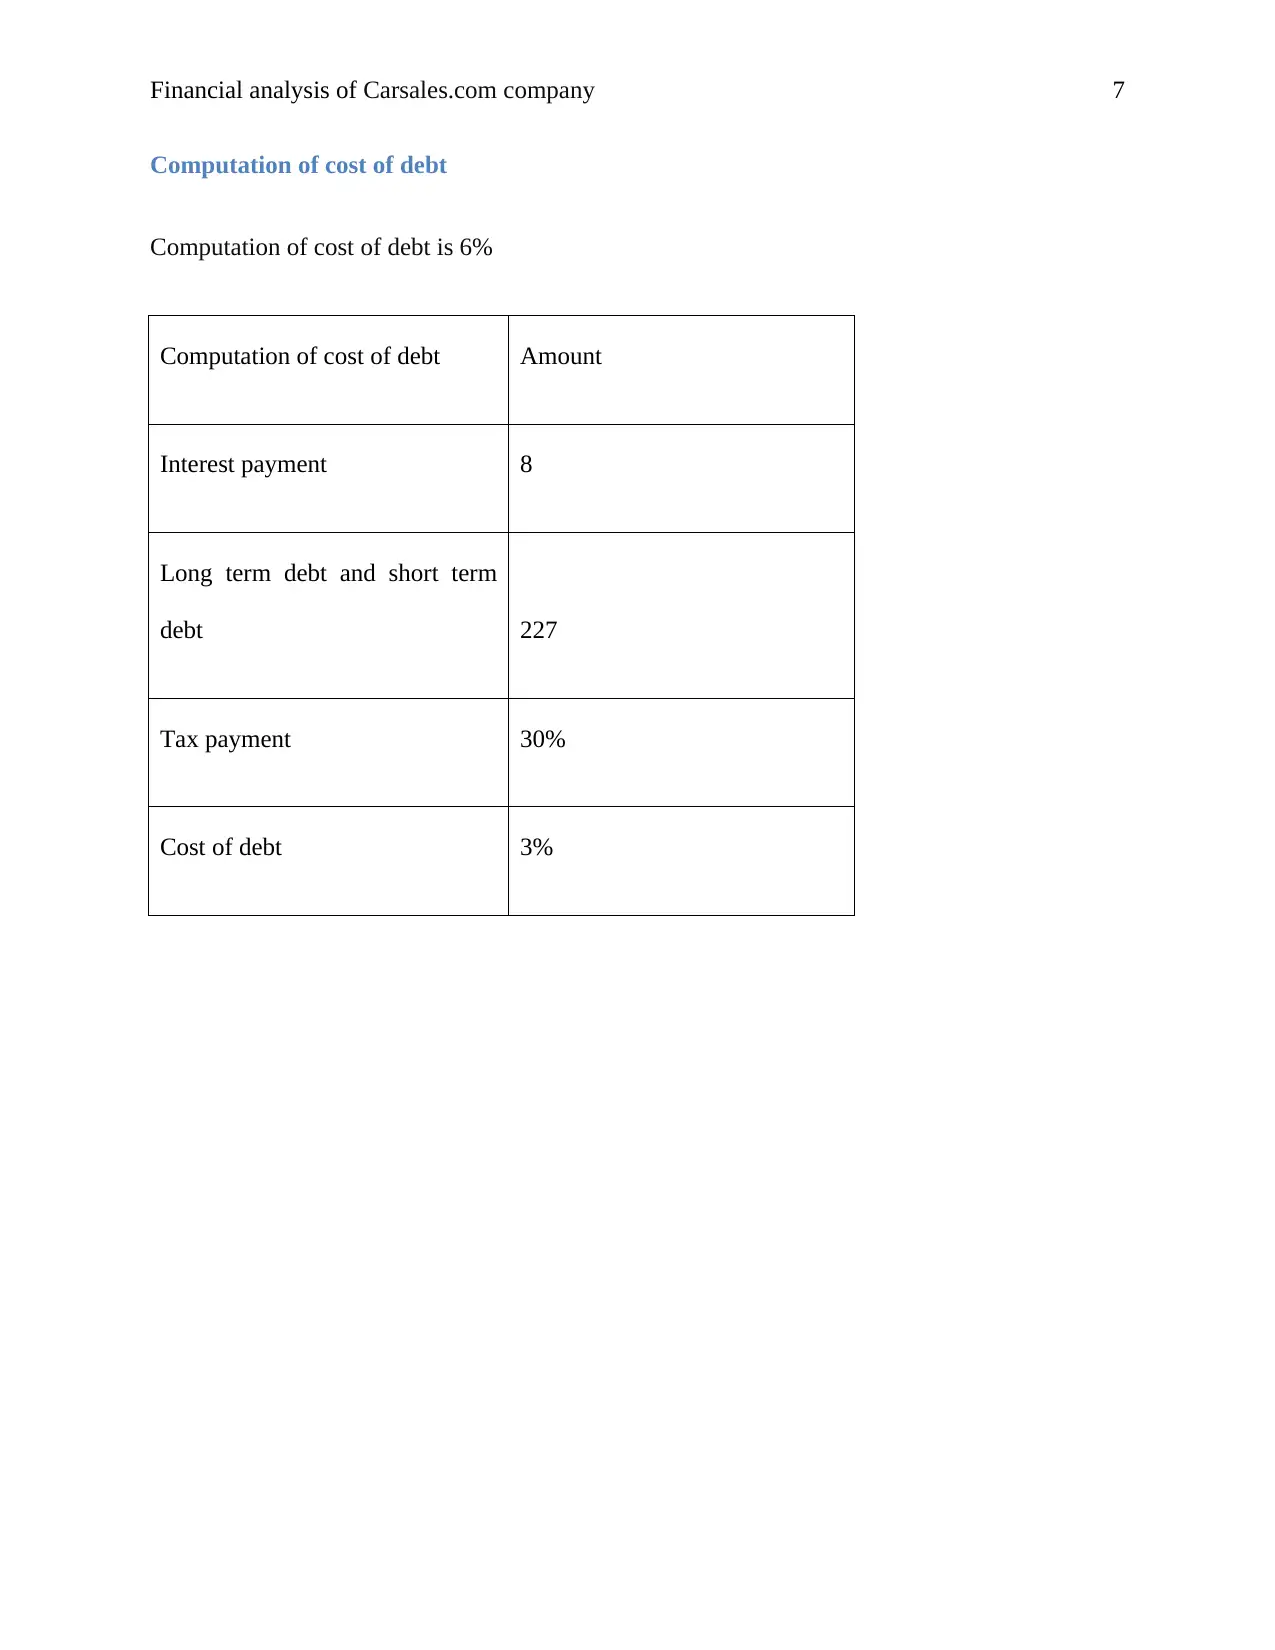
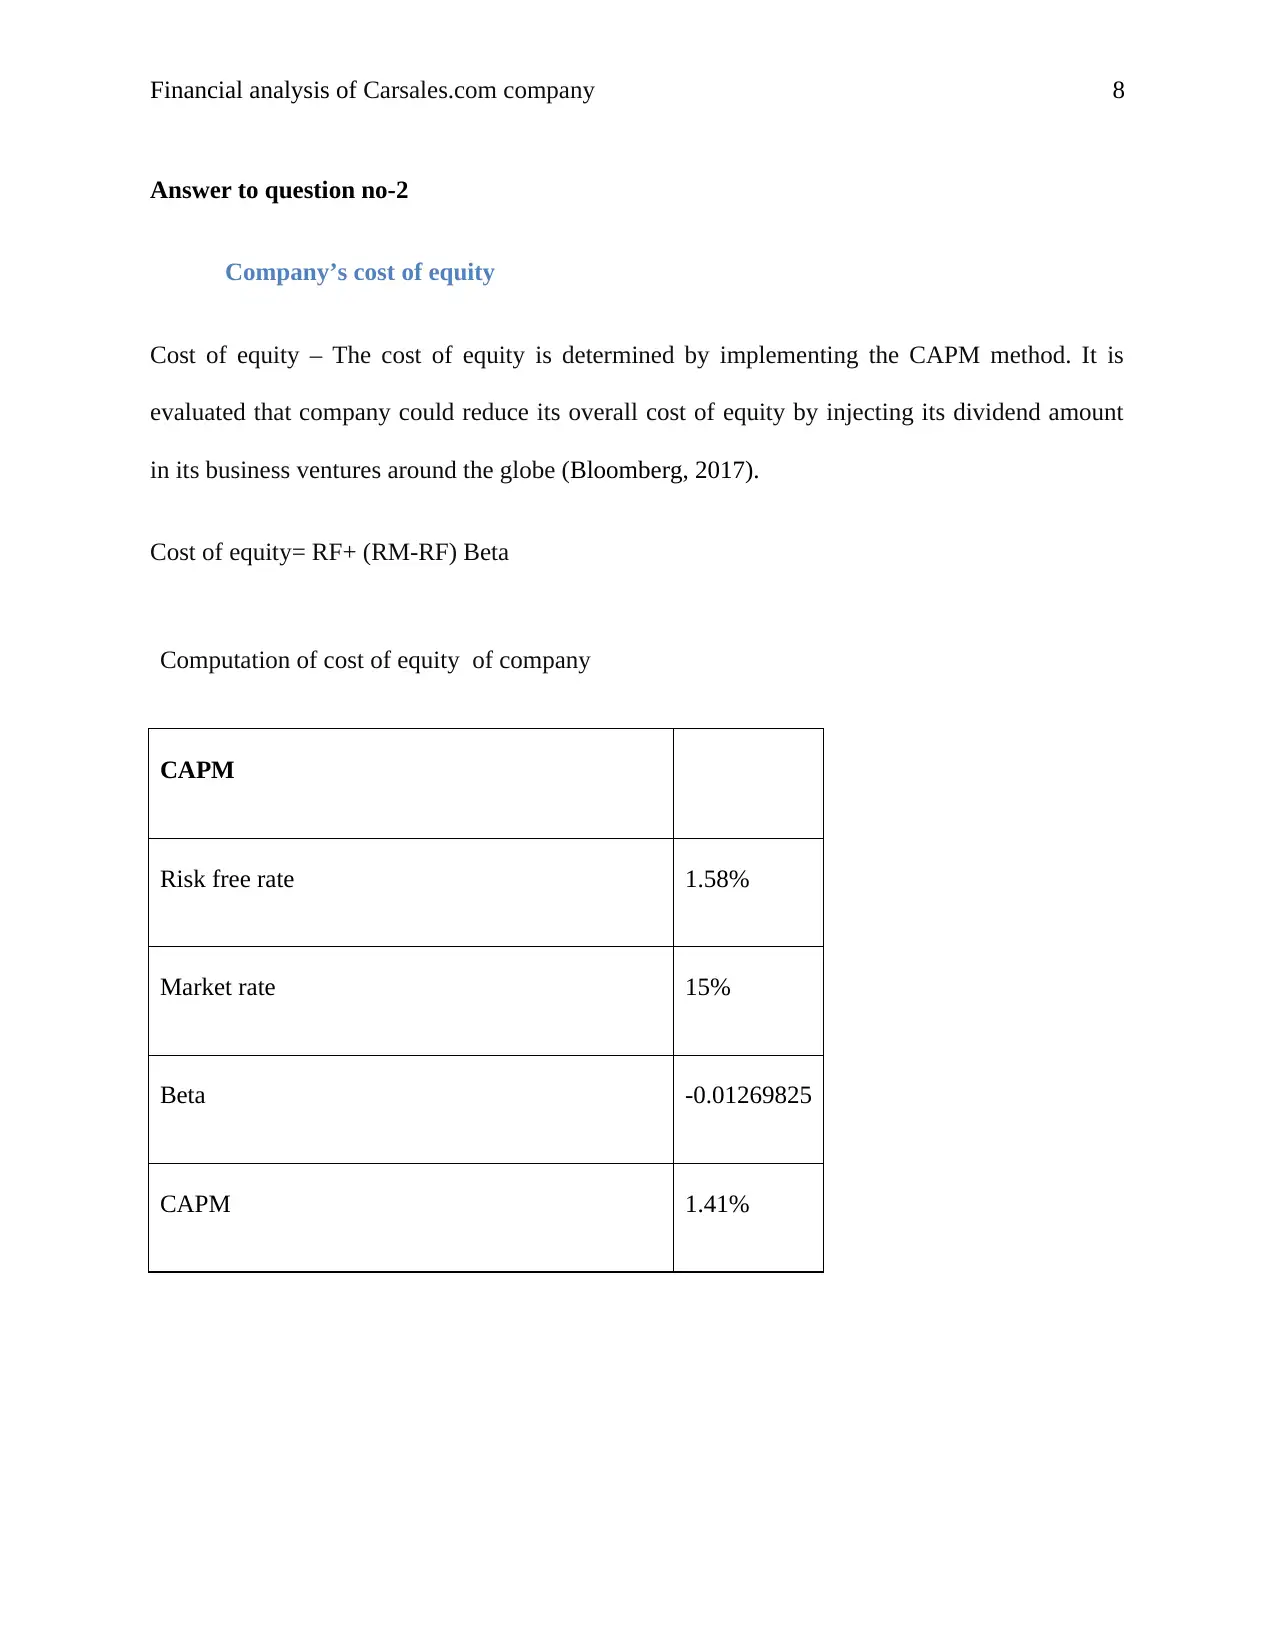
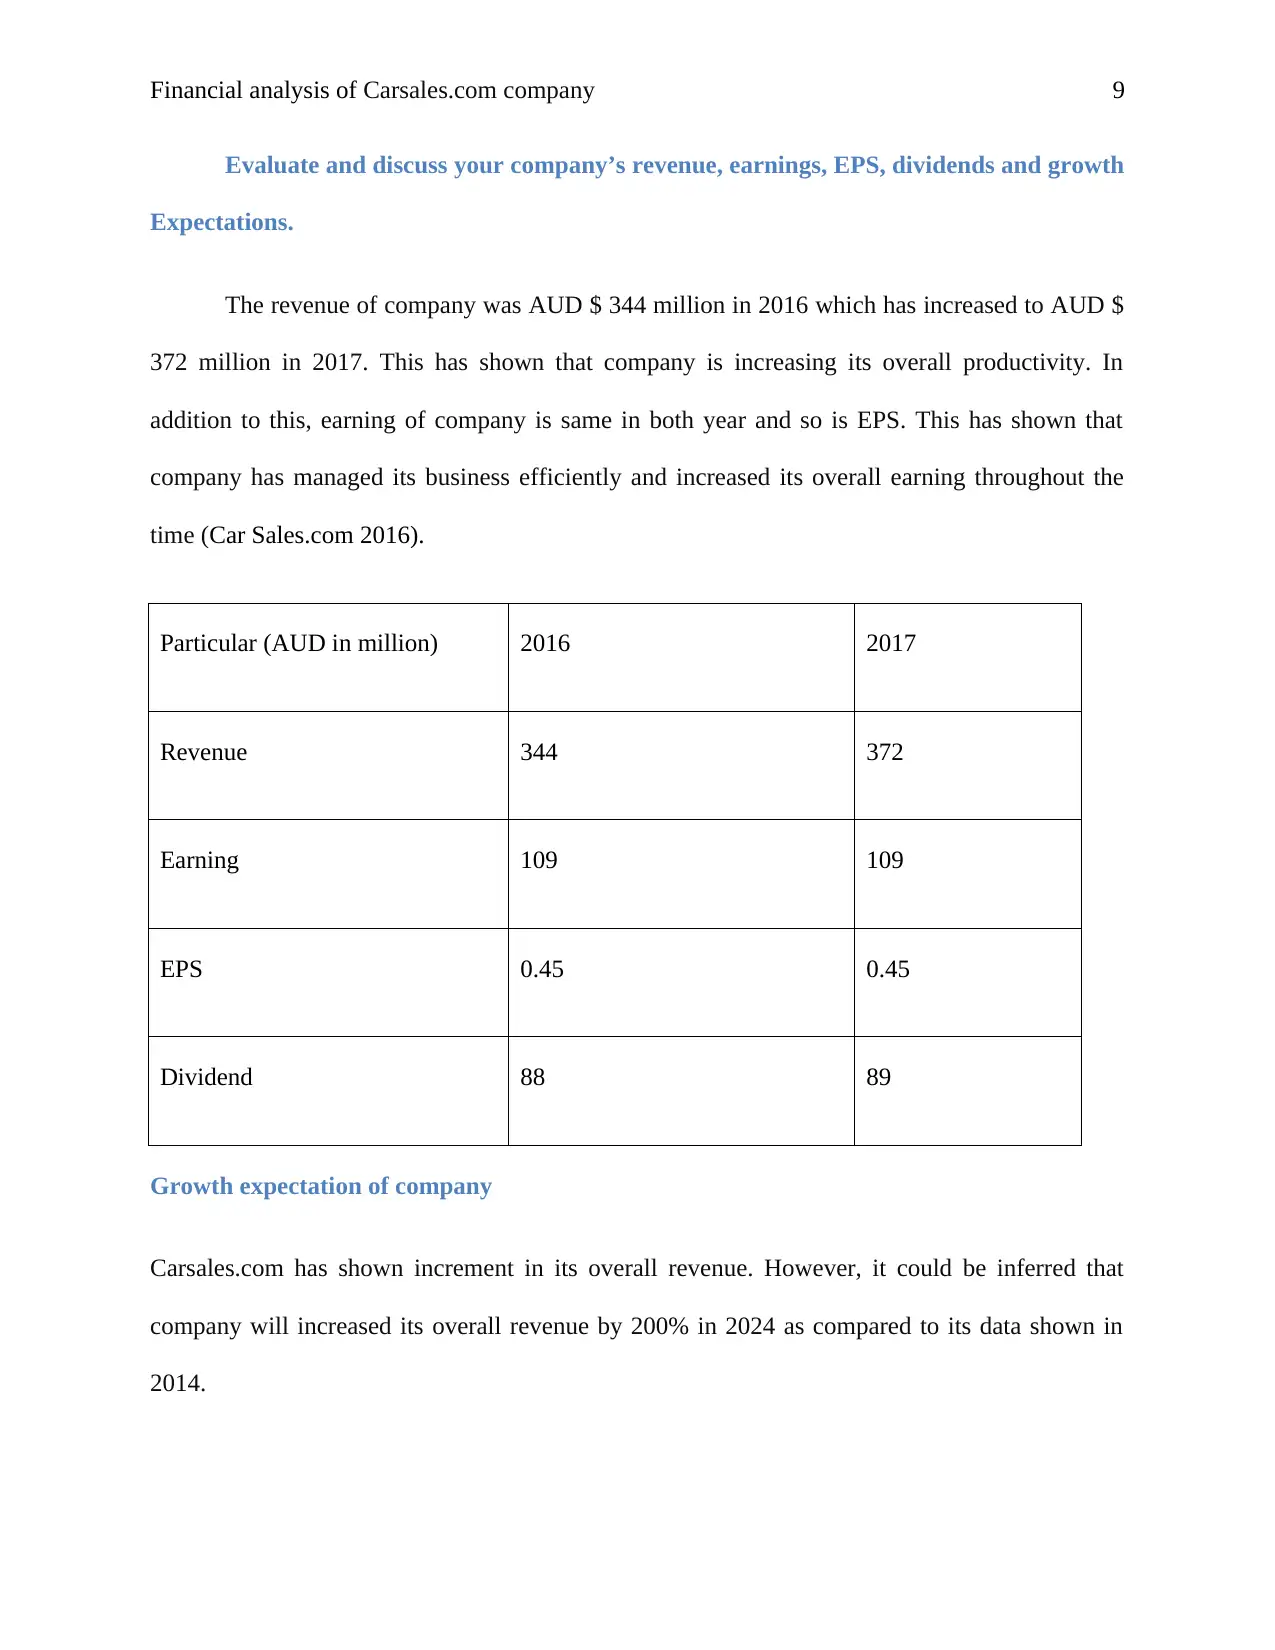
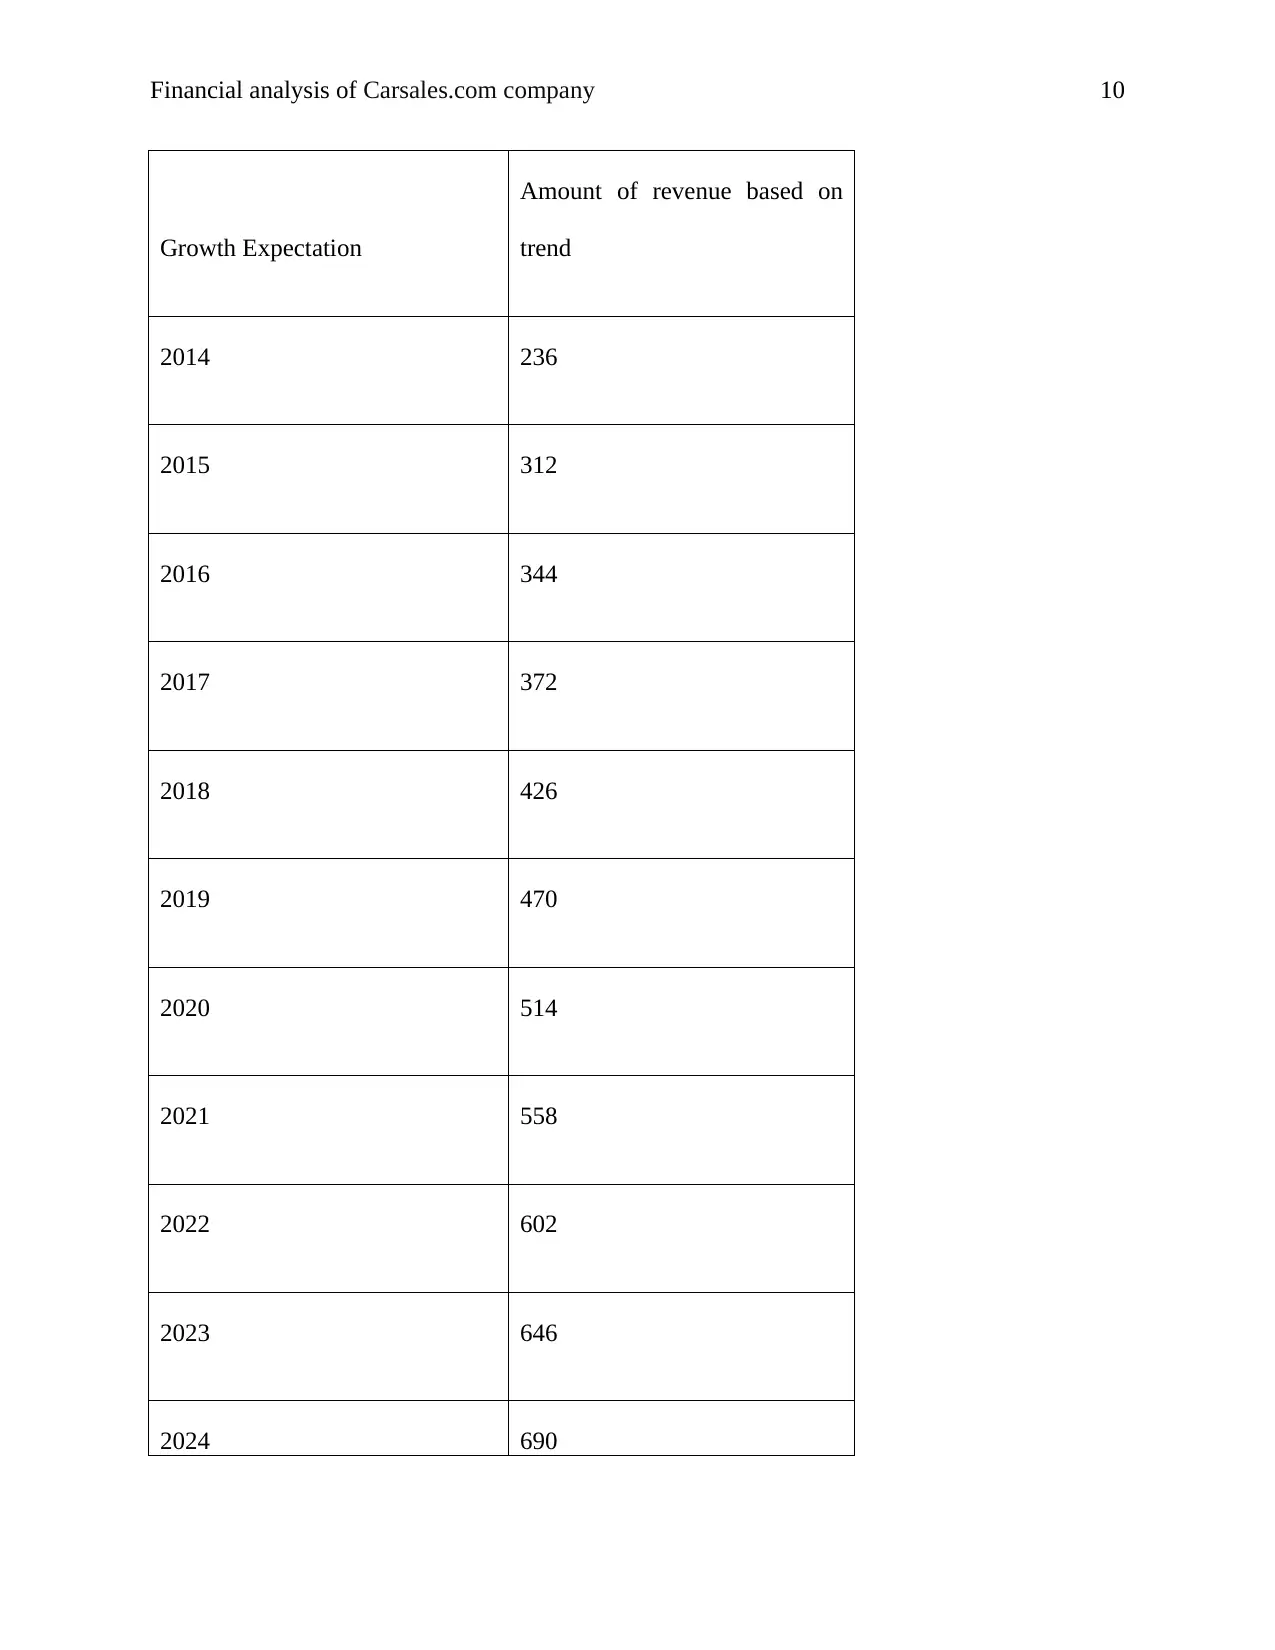
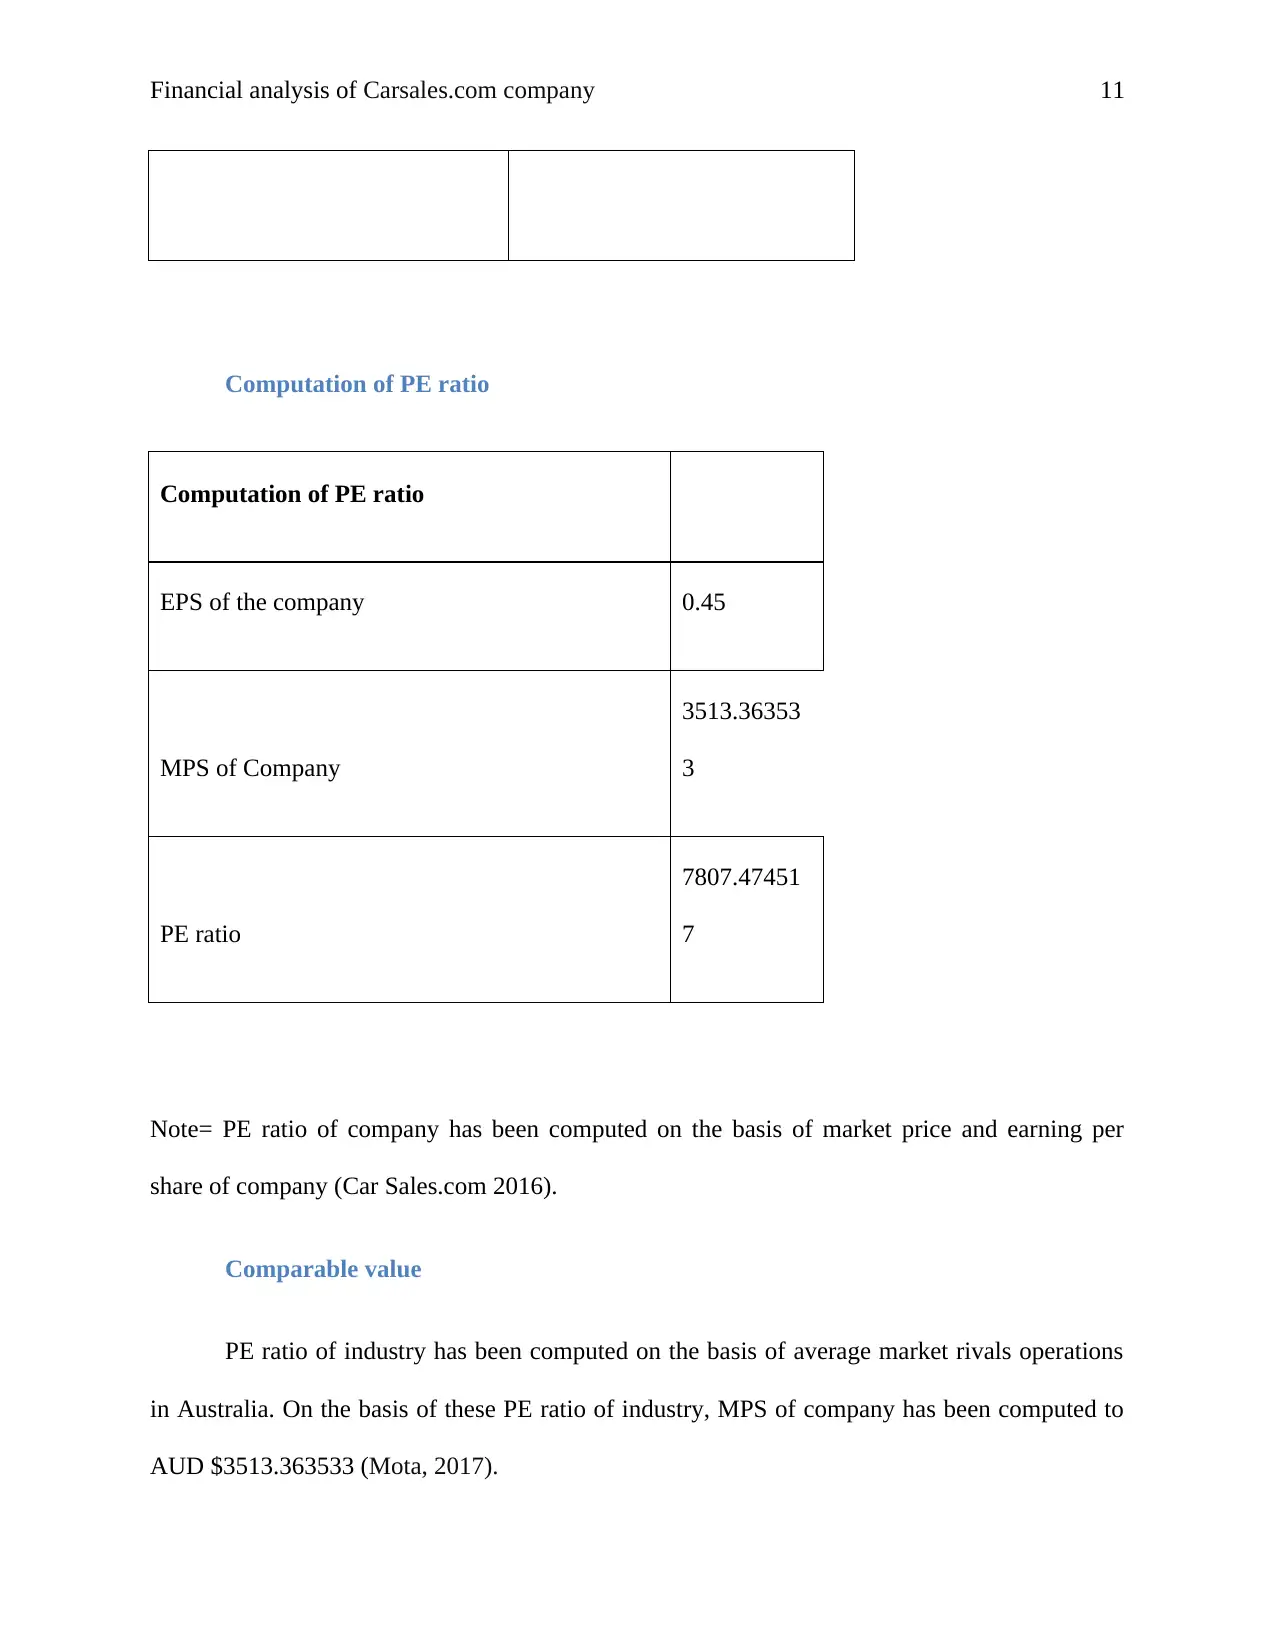
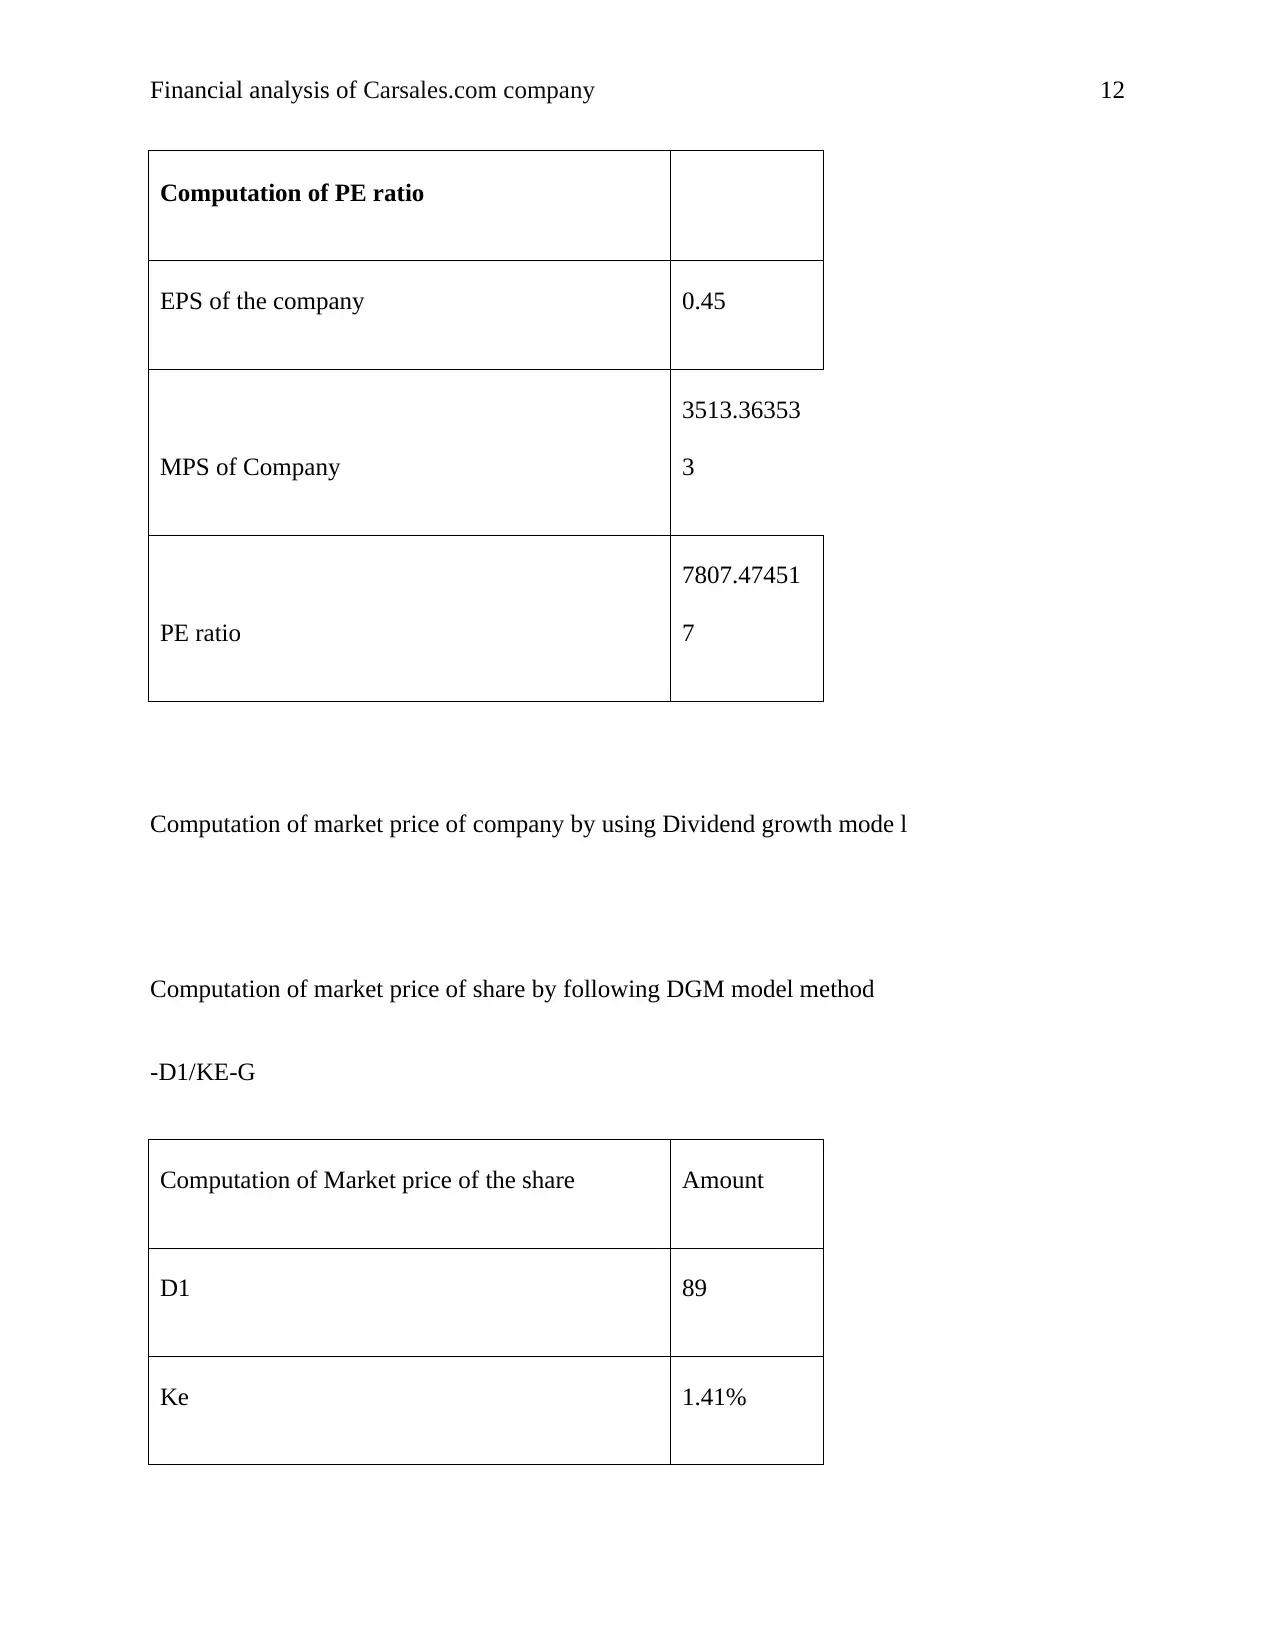
This report conducts a comprehensive financial analysis of Carsales.com Ltd, evaluating its performance based on various financial metrics. The analysis includes an examination of the company's short-term and long-term debts, assessing their consistency and influence on the debt structure. The report calculates the cost of debt and equity using CAPM, and evaluates the company's revenue, earnings per share (EPS), dividends, and growth expectations, including a projection of revenue through 2024. The PE ratio and comparable values are computed, along with a discussion on additional data for asset valuation. Furthermore, the report computes the weighted average cost of capital (WACC), explains the relationship between tax rates and WACC, and discusses the rationale behind the difference between the cost of debt and equity. It also addresses the inclusion of current liabilities in the cost of capital and highlights the major values within the WACC calculation. Finally, the report analyzes Carsales.com's market position, including a literature search, the company's uniqueness, and its strategic investment decisions, concluding with a comprehensive overview of the company's financial health and investment strategies.

RUNNING Head: Financial analysis of Carsales.com company
1
Name of the student
Topic- Financial analysis of Carsales.com Ltd AUS
University name
1
Name of the student
Topic- Financial analysis of Carsales.com Ltd AUS
University name
Paraphrase This Document
Need a fresh take? Get an instant paraphrase of this document with our AI Paraphraser

Financial analysis of Carsales.com company 2
Table of Contents
Introduction.......................................................................................................................2
Answer to question-1.........................................................................................................2
Short term and long term debts of company...................................................................2
Consistency of debt structure of company.....................................................................3
Company and industry operates its debt to influence the proportion of short-term to
long-term debts.......................................................................................................................... 4
Computation of cost of debt...........................................................................................4
Answer to question no-2....................................................................................................6
Company’s cost of equity...............................................................................................6
Evaluate and discuss your company’s revenue, earnings, EPS, dividends and growth
Expectations...............................................................................................................................7
Growth expectation of company....................................................................................7
Computation of PE ratio................................................................................................ 9
Comparable value.......................................................................................................... 9
Additional data and information would be preferred to value of the assets..................11
Answer to question no-3..................................................................................................12
Computation of weighted average cost of capital.........................................................12
Explanation of tax rate in relation to WACC...............................................................12

Financial analysis of Carsales.com company 3
Why there is difference in cost of debt and cost of equity............................................12
Should current liabilities be included in cost of capital?..............................................13
Major value of the WACC calculation.........................................................................13
Carsales.com Company has used WACC in investment decision................................14
Capital structure of company with the relevancy of the industry.................................14
Capital structure and what economic circumstances....................................................15
Answer to question-4.......................................................................................................16
Market analysis............................................................................................................16
Current literature search...............................................................................................16
Uniqueness of carsales.com.........................................................................................16
Conclusion........................................................................................................................17
References....................................................................................................................... 18
Car Sales.com...................................................................................................................18
⊘ This is a preview!⊘
Do you want full access?
Subscribe today to unlock all pages.

Trusted by 1+ million students worldwide

Financial analysis of Carsales.com company 4
Introduction
In this report, Carsales.com Company has been taken into consideration to evaluate
various internal and financial factors of business. This report has shown implementation of
financial analysis such as capital budgeting tools, WACC and other costing methods to analysis
the long term and short terms debt of company.
Present details of Carsales.com Company
it is an Australian company which is indulged in selling used cards to buyers at affordable price.
The CEO of company is Cameron McIntyre that is indulged in maintaining effective business.
Answer to question-1
Short term and long term debts of company
Carsales.com has maintained equal short term debts in both years 2016 and 2017.
However, as compared to its industrial average debt, it has reduced its short term debt by AUD
$ .7 million. In addition to this, long term debts of company is also decreased by AUD $ 34
million in just one year. Company was having higher long term debt in 2016 as compared to
industrial average debt which got reduced in 2017 AUD $ 29 million. Company wants to keep its
financial leverage low to increase its sustainibility.
Particular 2016 2017 Industrial average debt
AUD in AUD in Million AUD in Million
Paraphrase This Document
Need a fresh take? Get an instant paraphrase of this document with our AI Paraphraser

Financial analysis of Carsales.com company 5
Million
Short term debts 2 2 2.7
Long term debts 225 191 220
Consistency of debt structure of company
The consistency of debt structure is determined on the basis of changes in debts and equity part
of the company. Company has reduced its short term and long term debt by 20% in 2017 as
compared to last year. At the same, equity capital of company has increased to AUD $ 272 in
2017 from AUD $ 256. In addition to this, as compared to its industrial equity capital is 255
which are lower than Carsales.com. It has shown that company has increased its equity capital
with a view to increase its capital investment.
Particular 2016 2017
Industrial average
debt
$"000 $"000
Total debts 227 193 223
Equity share capital 256 272 255

Financial analysis of Carsales.com company 6
Total capital 483 465 478
Company and industry operates its debt to influence the proportion of short-term to
long-term debts
It is evaluated that carsales.com has maintained stable short term debts in both years.
However, long term debt of company has been influenced by the low level of long term debt of
company. Carsales.com has reduced its overall long term debt to AUD $ 191 with a view to
reduce its overall financial leverage.
Particular 2016 2017
Industrial average
debt
$"000 $"000 $"000
Short term debts 2 2 2.7
Long term debts 225 191 220
⊘ This is a preview!⊘
Do you want full access?
Subscribe today to unlock all pages.

Trusted by 1+ million students worldwide

Financial analysis of Carsales.com company 7
Computation of cost of debt
Computation of cost of debt is 6%
Computation of cost of debt Amount
Interest payment 8
Long term debt and short term
debt 227
Tax payment 30%
Cost of debt 3%
Computation of cost of debt
Computation of cost of debt is 6%
Computation of cost of debt Amount
Interest payment 8
Long term debt and short term
debt 227
Tax payment 30%
Cost of debt 3%
Paraphrase This Document
Need a fresh take? Get an instant paraphrase of this document with our AI Paraphraser

Financial analysis of Carsales.com company 8
Answer to question no-2
Company’s cost of equity
Cost of equity – The cost of equity is determined by implementing the CAPM method. It is
evaluated that company could reduce its overall cost of equity by injecting its dividend amount
in its business ventures around the globe (Bloomberg, 2017).
Cost of equity= RF+ (RM-RF) Beta
Computation of cost of equity of company
CAPM
Risk free rate 1.58%
Market rate 15%
Beta -0.01269825
CAPM 1.41%

Financial analysis of Carsales.com company 9
Evaluate and discuss your company’s revenue, earnings, EPS, dividends and growth
Expectations.
The revenue of company was AUD $ 344 million in 2016 which has increased to AUD $
372 million in 2017. This has shown that company is increasing its overall productivity. In
addition to this, earning of company is same in both year and so is EPS. This has shown that
company has managed its business efficiently and increased its overall earning throughout the
time (Car Sales.com 2016).
Particular (AUD in million) 2016 2017
Revenue 344 372
Earning 109 109
EPS 0.45 0.45
Dividend 88 89
Growth expectation of company
Carsales.com has shown increment in its overall revenue. However, it could be inferred that
company will increased its overall revenue by 200% in 2024 as compared to its data shown in
2014.
⊘ This is a preview!⊘
Do you want full access?
Subscribe today to unlock all pages.

Trusted by 1+ million students worldwide

Financial analysis of Carsales.com company 10
Growth Expectation
Amount of revenue based on
trend
2014 236
2015 312
2016 344
2017 372
2018 426
2019 470
2020 514
2021 558
2022 602
2023 646
2024 690
Growth Expectation
Amount of revenue based on
trend
2014 236
2015 312
2016 344
2017 372
2018 426
2019 470
2020 514
2021 558
2022 602
2023 646
2024 690
Paraphrase This Document
Need a fresh take? Get an instant paraphrase of this document with our AI Paraphraser

Financial analysis of Carsales.com company 11
Computation of PE ratio
EPS of the company 0.45
MPS of Company
3513.36353
3
PE ratio
7807.47451
7
Note= PE ratio of company has been computed on the basis of market price and earning per
share of company (Car Sales.com 2016).
Comparable value
PE ratio of industry has been computed on the basis of average market rivals operations
in Australia. On the basis of these PE ratio of industry, MPS of company has been computed to
AUD $3513.363533 (Mota, 2017).

Financial analysis of Carsales.com company 12
Computation of PE ratio
EPS of the company 0.45
MPS of Company
3513.36353
3
PE ratio
7807.47451
7
Computation of market price of company by using Dividend growth mode l
Computation of market price of share by following DGM model method
-D1/KE-G
Computation of Market price of the share Amount
D1 89
Ke 1.41%
⊘ This is a preview!⊘
Do you want full access?
Subscribe today to unlock all pages.

Trusted by 1+ million students worldwide
1 out of 19
Related Documents

Your All-in-One AI-Powered Toolkit for Academic Success.
+13062052269
info@desklib.com
Available 24*7 on WhatsApp / Email
Unlock your academic potential
Copyright © 2020–2025 A2Z Services. All Rights Reserved. Developed and managed by ZUCOL.