Comprehensive Strategic Management Analysis: Cartwell Residents Report
VerifiedAdded on 2021/02/20
|14
|3740
|29
Report
AI Summary
This report provides a strategic management analysis of Cartwell Retirement Residents, examining the company's financial performance over a four-year period. The analysis includes key financial ratios such as Return on Assets, Return on Equity, Asset Turnover, Debt to Equity, and Current Ratio, along with an assessment of the company's liquidity, capacity to raise capital, and competitive advantages. The report addresses common questions regarding the company's ability to pay bills, capacity to raise capital, and financial performance compared to competitors, evaluating the implications of the financials for future strategy and execution. It highlights trends in sales growth, profit margins, and ROI relative to the industry. The analysis concludes with an overall assessment of financial performance, including financial strength, key operating measures, and strategic implications, offering insights into the company's strengths and weaknesses and suggesting strategies for improvement, such as investing excessive liquidity and improving debt capacity.

Strategic management
Paraphrase This Document
Need a fresh take? Get an instant paraphrase of this document with our AI Paraphraser
Table of Contents
INTRODUCTION...........................................................................................................................1
CONCLUSIONS .............................................................................................................................4
REFERENCES................................................................................................................................5
APPENDICES.................................................................................................................................6
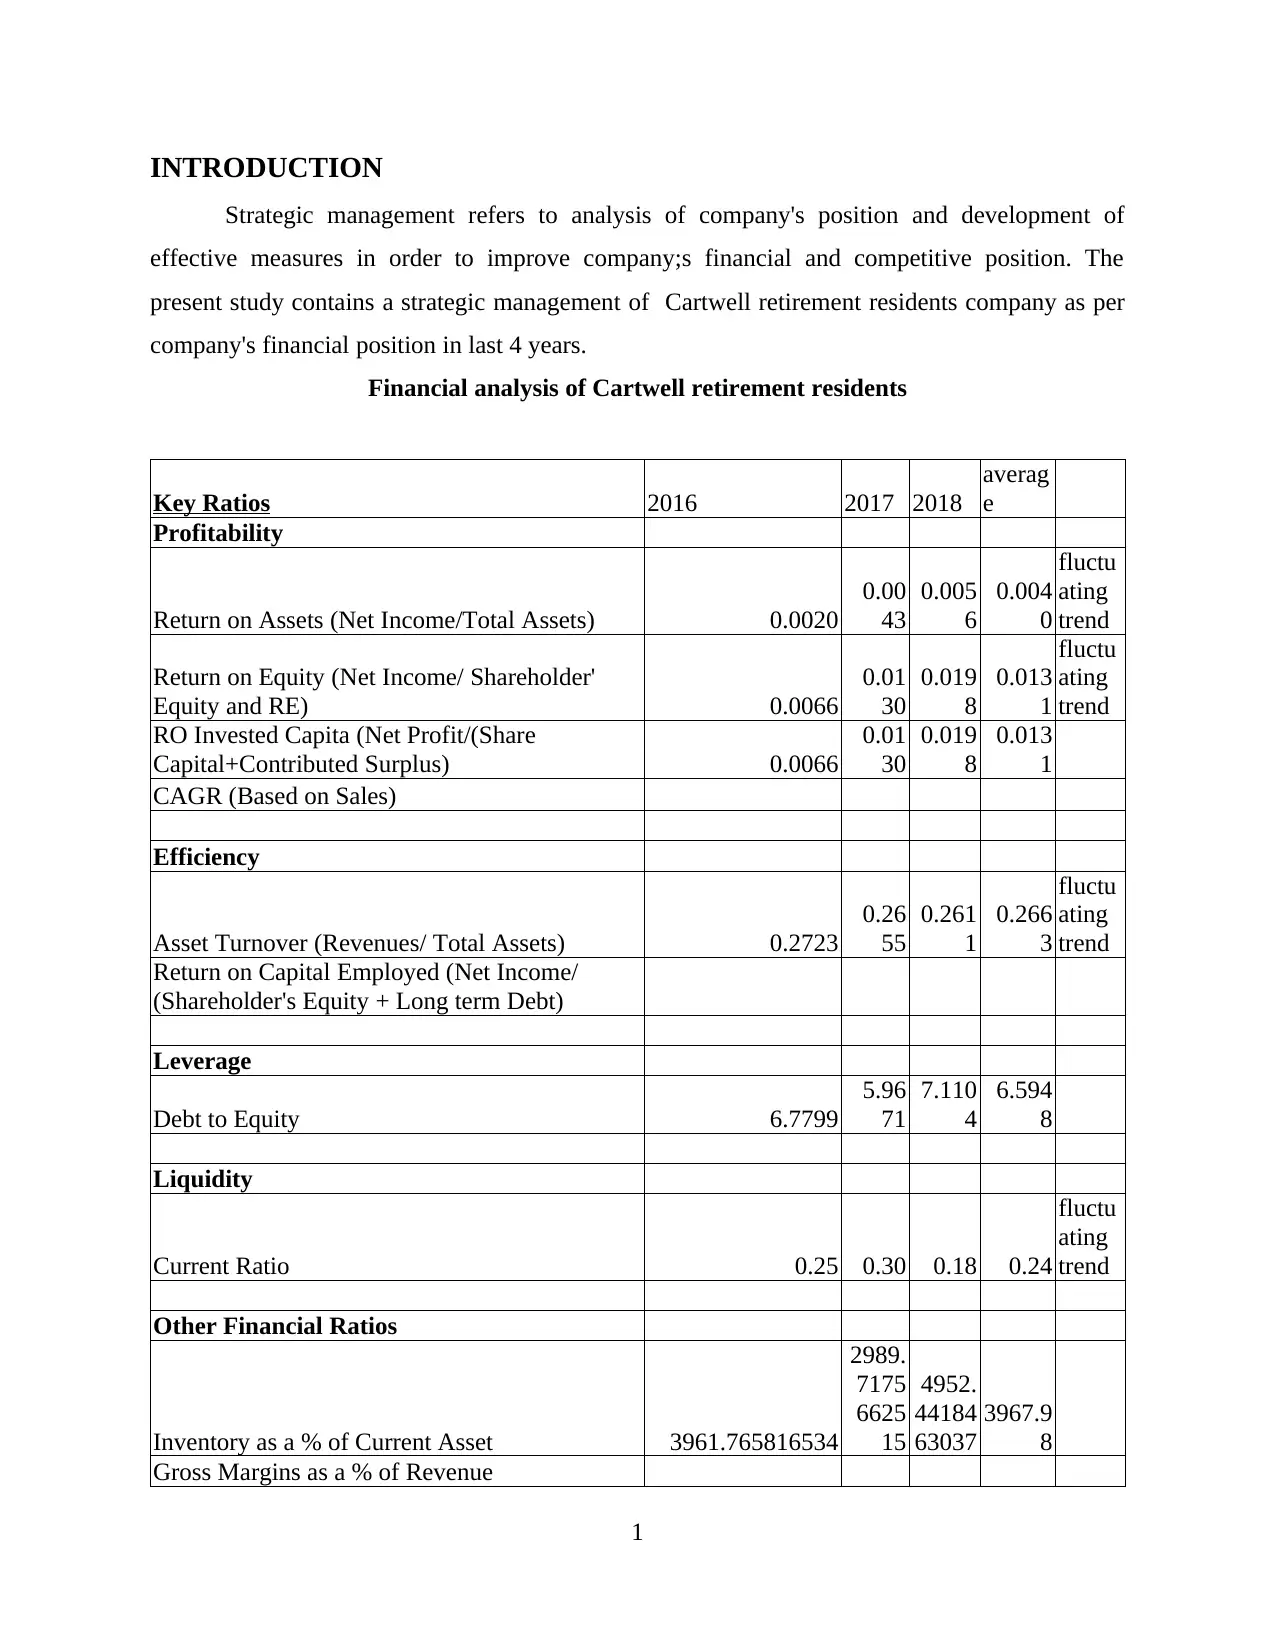
INTRODUCTION
Strategic management refers to analysis of company's position and development of
effective measures in order to improve company;s financial and competitive position. The
present study contains a strategic management of Cartwell retirement residents company as per
company's financial position in last 4 years.
Financial analysis of Cartwell retirement residents
Key Ratios 2016 2017 2018
averag
e
Profitability
Return on Assets (Net Income/Total Assets) 0.0020
0.00
43
0.005
6
0.004
0
fluctu
ating
trend
Return on Equity (Net Income/ Shareholder'
Equity and RE) 0.0066
0.01
30
0.019
8
0.013
1
fluctu
ating
trend
RO Invested Capita (Net Profit/(Share
Capital+Contributed Surplus) 0.0066
0.01
30
0.019
8
0.013
1
CAGR (Based on Sales)
Efficiency
Asset Turnover (Revenues/ Total Assets) 0.2723
0.26
55
0.261
1
0.266
3
fluctu
ating
trend
Return on Capital Employed (Net Income/
(Shareholder's Equity + Long term Debt)
Leverage
Debt to Equity 6.7799
5.96
71
7.110
4
6.594
8
Liquidity
Current Ratio 0.25 0.30 0.18 0.24
fluctu
ating
trend
Other Financial Ratios
Inventory as a % of Current Asset 3961.765816534
2989.
7175
6625
15
4952.
44184
63037
3967.9
8
Gross Margins as a % of Revenue
1
⊘ This is a preview!⊘
Do you want full access?
Subscribe today to unlock all pages.
Trusted by 1+ million students worldwide
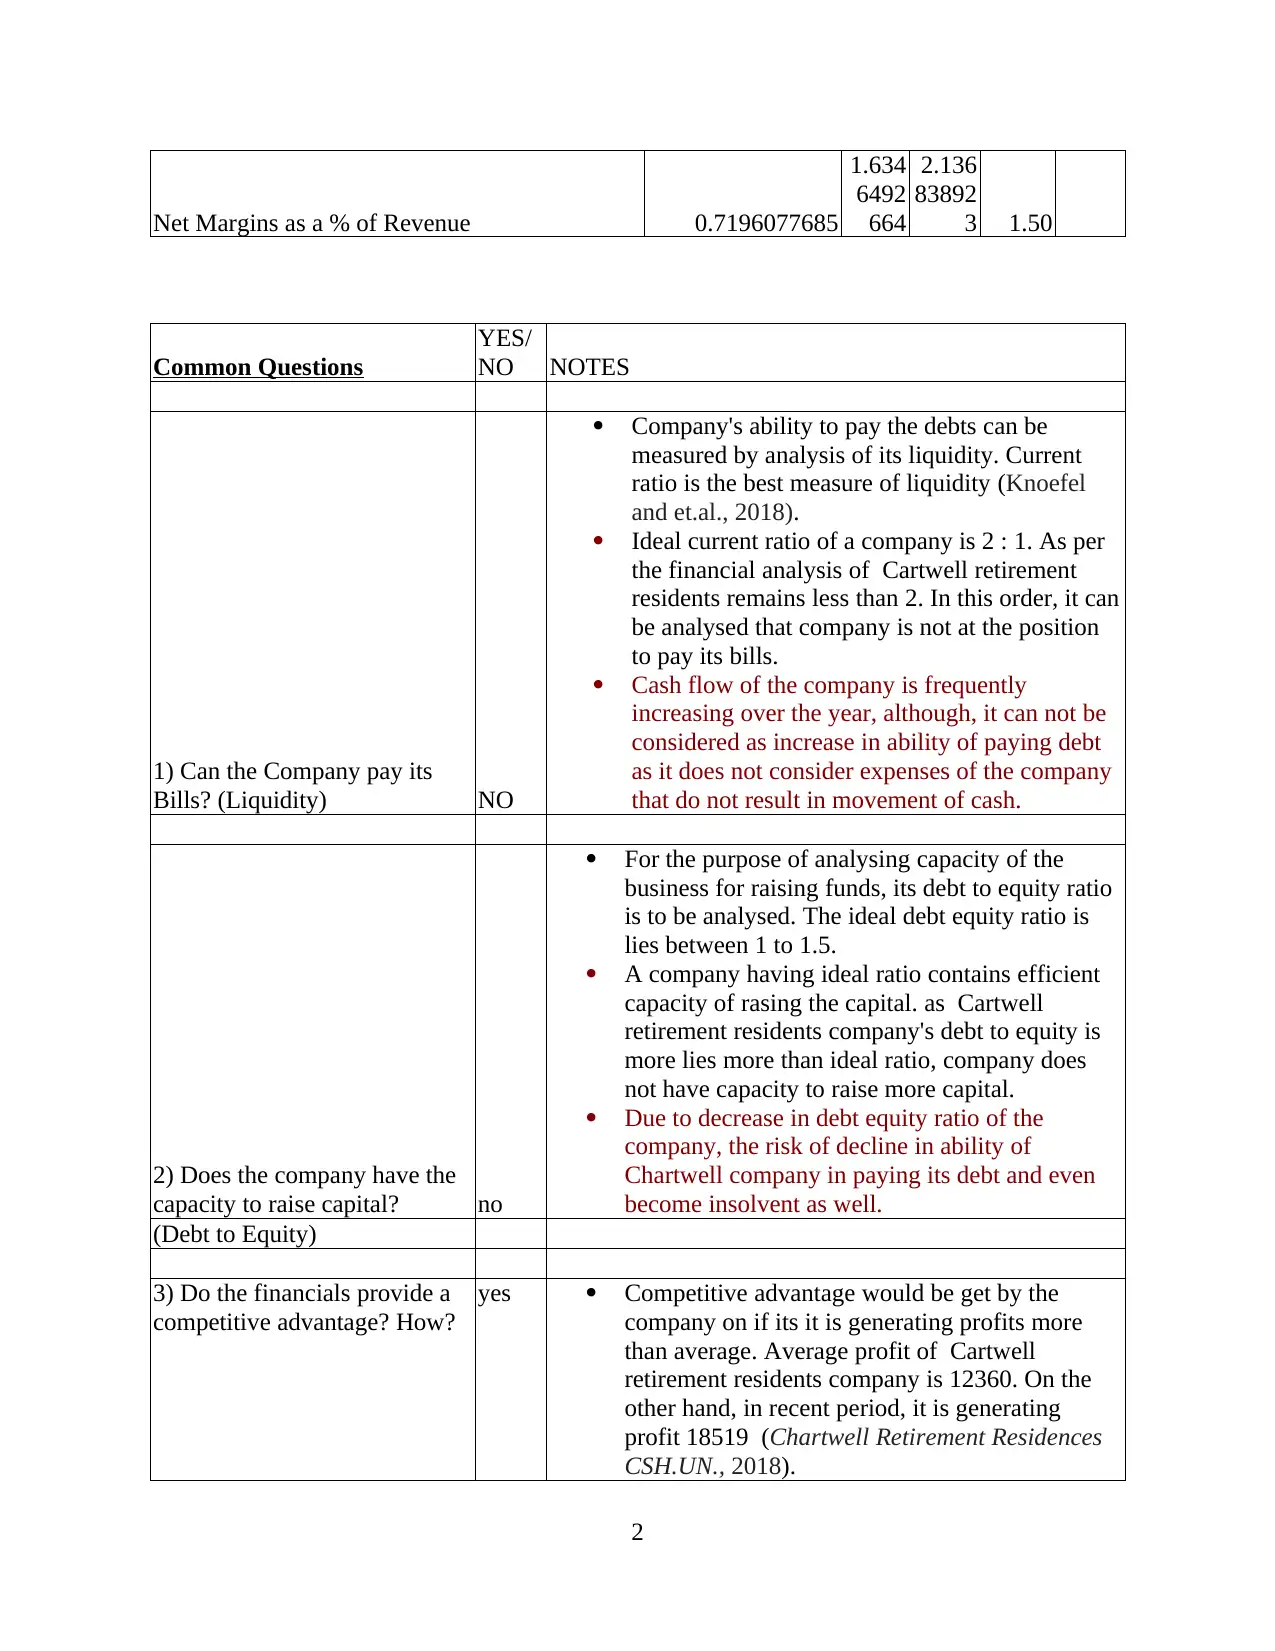
Net Margins as a % of Revenue 0.7196077685
1.634
6492
664
2.136
83892
3 1.50
Common Questions
YES/
NO NOTES
1) Can the Company pay its
Bills? (Liquidity) NO
Company's ability to pay the debts can be
measured by analysis of its liquidity. Current
ratio is the best measure of liquidity (Knoefel
and et.al., 2018).
Ideal current ratio of a company is 2 : 1. As per
the financial analysis of Cartwell retirement
residents remains less than 2. In this order, it can
be analysed that company is not at the position
to pay its bills.
Cash flow of the company is frequently
increasing over the year, although, it can not be
considered as increase in ability of paying debt
as it does not consider expenses of the company
that do not result in movement of cash.
2) Does the company have the
capacity to raise capital? no
For the purpose of analysing capacity of the
business for raising funds, its debt to equity ratio
is to be analysed. The ideal debt equity ratio is
lies between 1 to 1.5.
A company having ideal ratio contains efficient
capacity of rasing the capital. as Cartwell
retirement residents company's debt to equity is
more lies more than ideal ratio, company does
not have capacity to raise more capital.
Due to decrease in debt equity ratio of the
company, the risk of decline in ability of
Chartwell company in paying its debt and even
become insolvent as well.
(Debt to Equity)
3) Do the financials provide a
competitive advantage? How?
yes Competitive advantage would be get by the
company on if its it is generating profits more
than average. Average profit of Cartwell
retirement residents company is 12360. On the
other hand, in recent period, it is generating
profit 18519 (Chartwell Retirement Residences
CSH.UN., 2018).
2
Paraphrase This Document
Need a fresh take? Get an instant paraphrase of this document with our AI Paraphraser
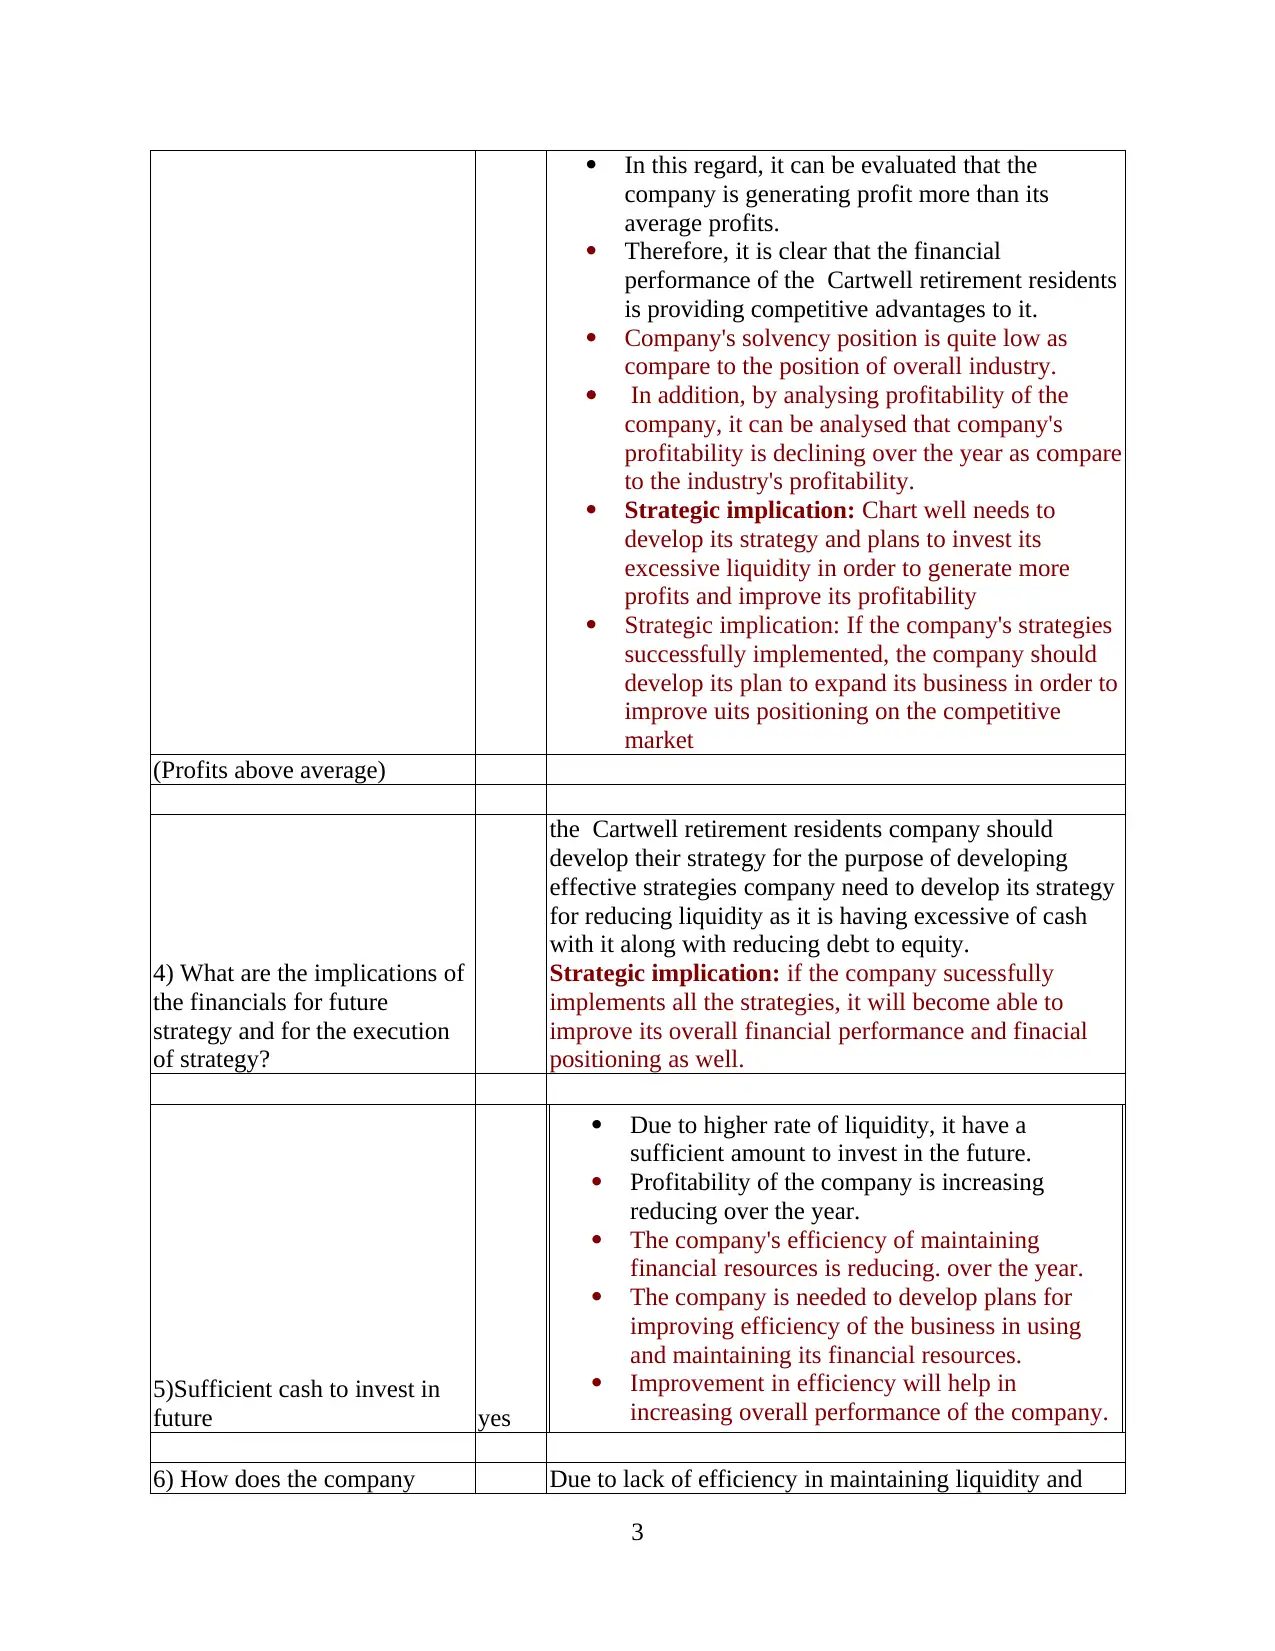
In this regard, it can be evaluated that the
company is generating profit more than its
average profits.
Therefore, it is clear that the financial
performance of the Cartwell retirement residents
is providing competitive advantages to it.
Company's solvency position is quite low as
compare to the position of overall industry.
In addition, by analysing profitability of the
company, it can be analysed that company's
profitability is declining over the year as compare
to the industry's profitability.
Strategic implication: Chart well needs to
develop its strategy and plans to invest its
excessive liquidity in order to generate more
profits and improve its profitability
Strategic implication: If the company's strategies
successfully implemented, the company should
develop its plan to expand its business in order to
improve uits positioning on the competitive
market
(Profits above average)
4) What are the implications of
the financials for future
strategy and for the execution
of strategy?
the Cartwell retirement residents company should
develop their strategy for the purpose of developing
effective strategies company need to develop its strategy
for reducing liquidity as it is having excessive of cash
with it along with reducing debt to equity.
Strategic implication: if the company sucessfully
implements all the strategies, it will become able to
improve its overall financial performance and finacial
positioning as well.
5)Sufficient cash to invest in
future yes
Due to higher rate of liquidity, it have a
sufficient amount to invest in the future.
Profitability of the company is increasing
reducing over the year.
The company's efficiency of maintaining
financial resources is reducing. over the year.
The company is needed to develop plans for
improving efficiency of the business in using
and maintaining its financial resources.
Improvement in efficiency will help in
increasing overall performance of the company.
6) How does the company Due to lack of efficiency in maintaining liquidity and
3
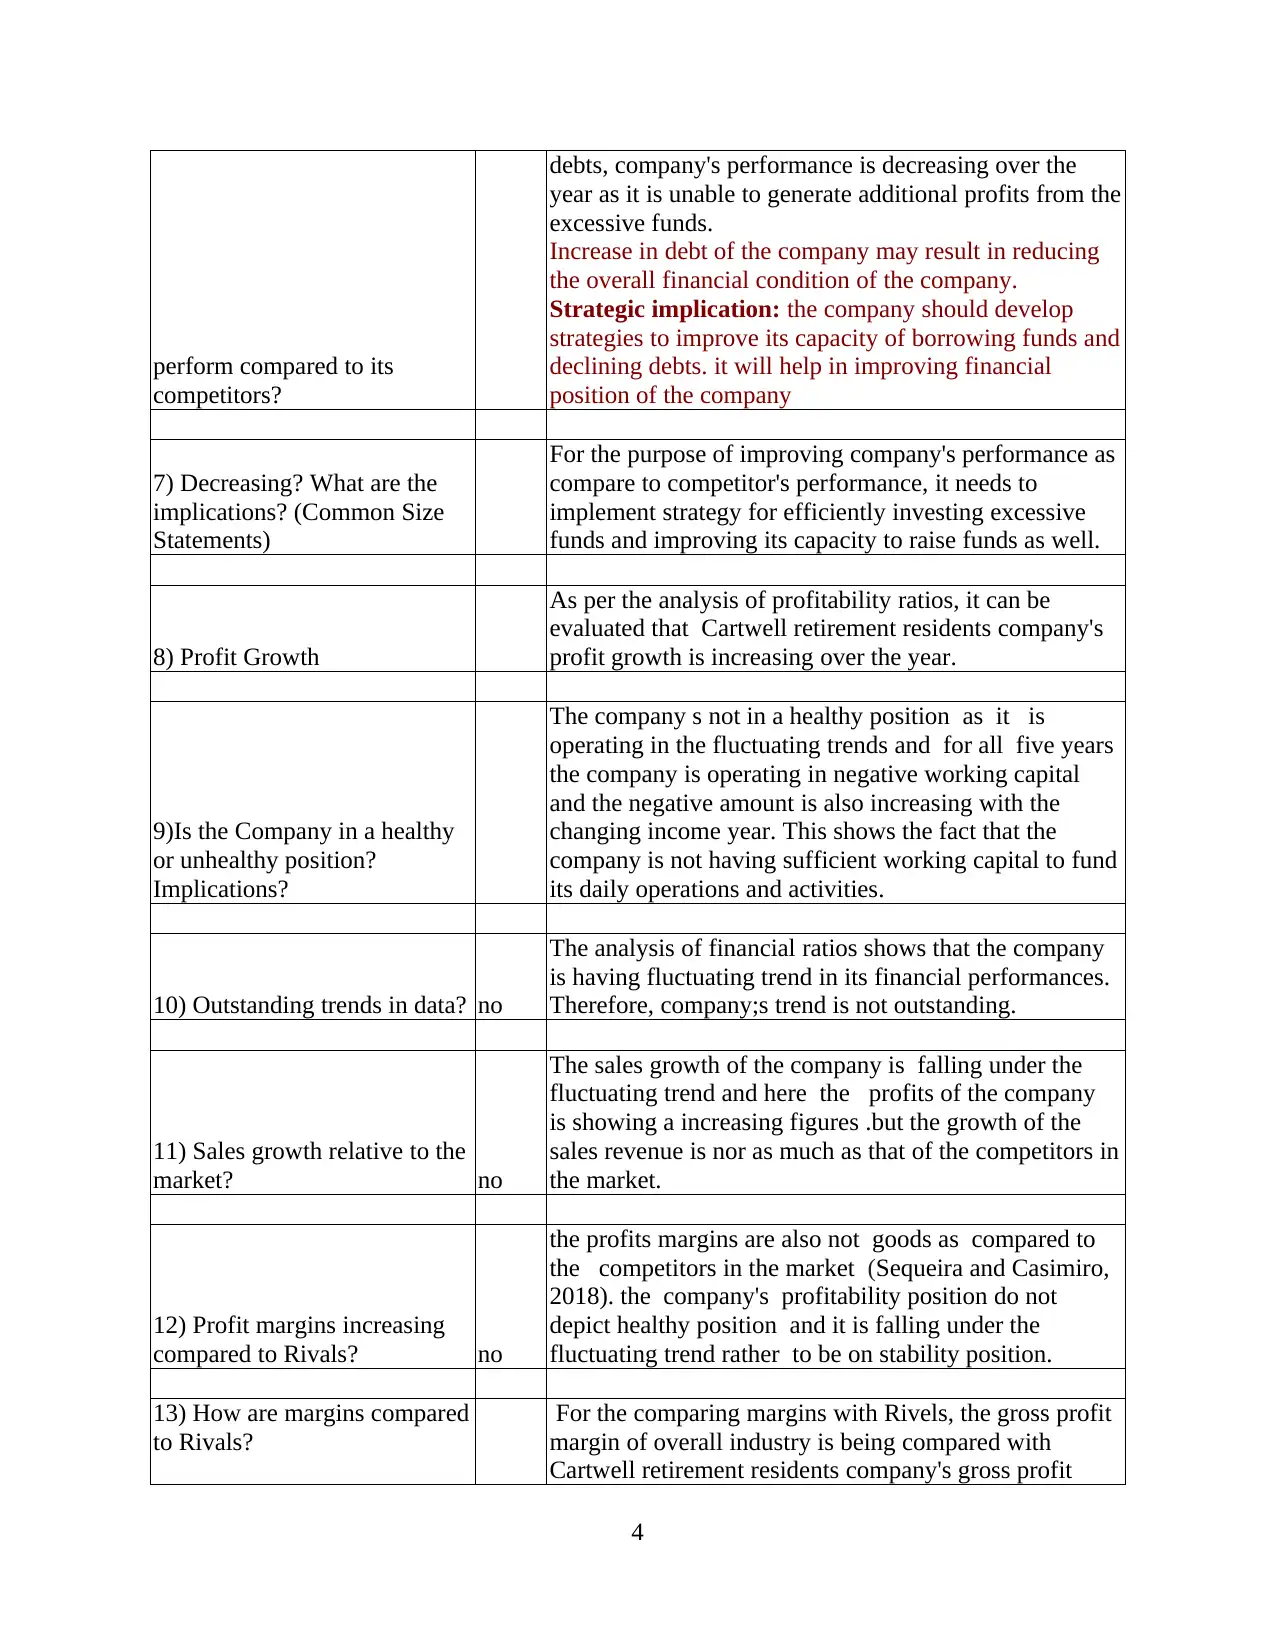
perform compared to its
competitors?
debts, company's performance is decreasing over the
year as it is unable to generate additional profits from the
excessive funds.
Increase in debt of the company may result in reducing
the overall financial condition of the company.
Strategic implication: the company should develop
strategies to improve its capacity of borrowing funds and
declining debts. it will help in improving financial
position of the company
7) Decreasing? What are the
implications? (Common Size
Statements)
For the purpose of improving company's performance as
compare to competitor's performance, it needs to
implement strategy for efficiently investing excessive
funds and improving its capacity to raise funds as well.
8) Profit Growth
As per the analysis of profitability ratios, it can be
evaluated that Cartwell retirement residents company's
profit growth is increasing over the year.
9)Is the Company in a healthy
or unhealthy position?
Implications?
The company s not in a healthy position as it is
operating in the fluctuating trends and for all five years
the company is operating in negative working capital
and the negative amount is also increasing with the
changing income year. This shows the fact that the
company is not having sufficient working capital to fund
its daily operations and activities.
10) Outstanding trends in data? no
The analysis of financial ratios shows that the company
is having fluctuating trend in its financial performances.
Therefore, company;s trend is not outstanding.
11) Sales growth relative to the
market? no
The sales growth of the company is falling under the
fluctuating trend and here the profits of the company
is showing a increasing figures .but the growth of the
sales revenue is nor as much as that of the competitors in
the market.
12) Profit margins increasing
compared to Rivals? no
the profits margins are also not goods as compared to
the competitors in the market (Sequeira and Casimiro,
2018). the company's profitability position do not
depict healthy position and it is falling under the
fluctuating trend rather to be on stability position.
13) How are margins compared
to Rivals?
For the comparing margins with Rivels, the gross profit
margin of overall industry is being compared with
Cartwell retirement residents company's gross profit
4
⊘ This is a preview!⊘
Do you want full access?
Subscribe today to unlock all pages.
Trusted by 1+ million students worldwide
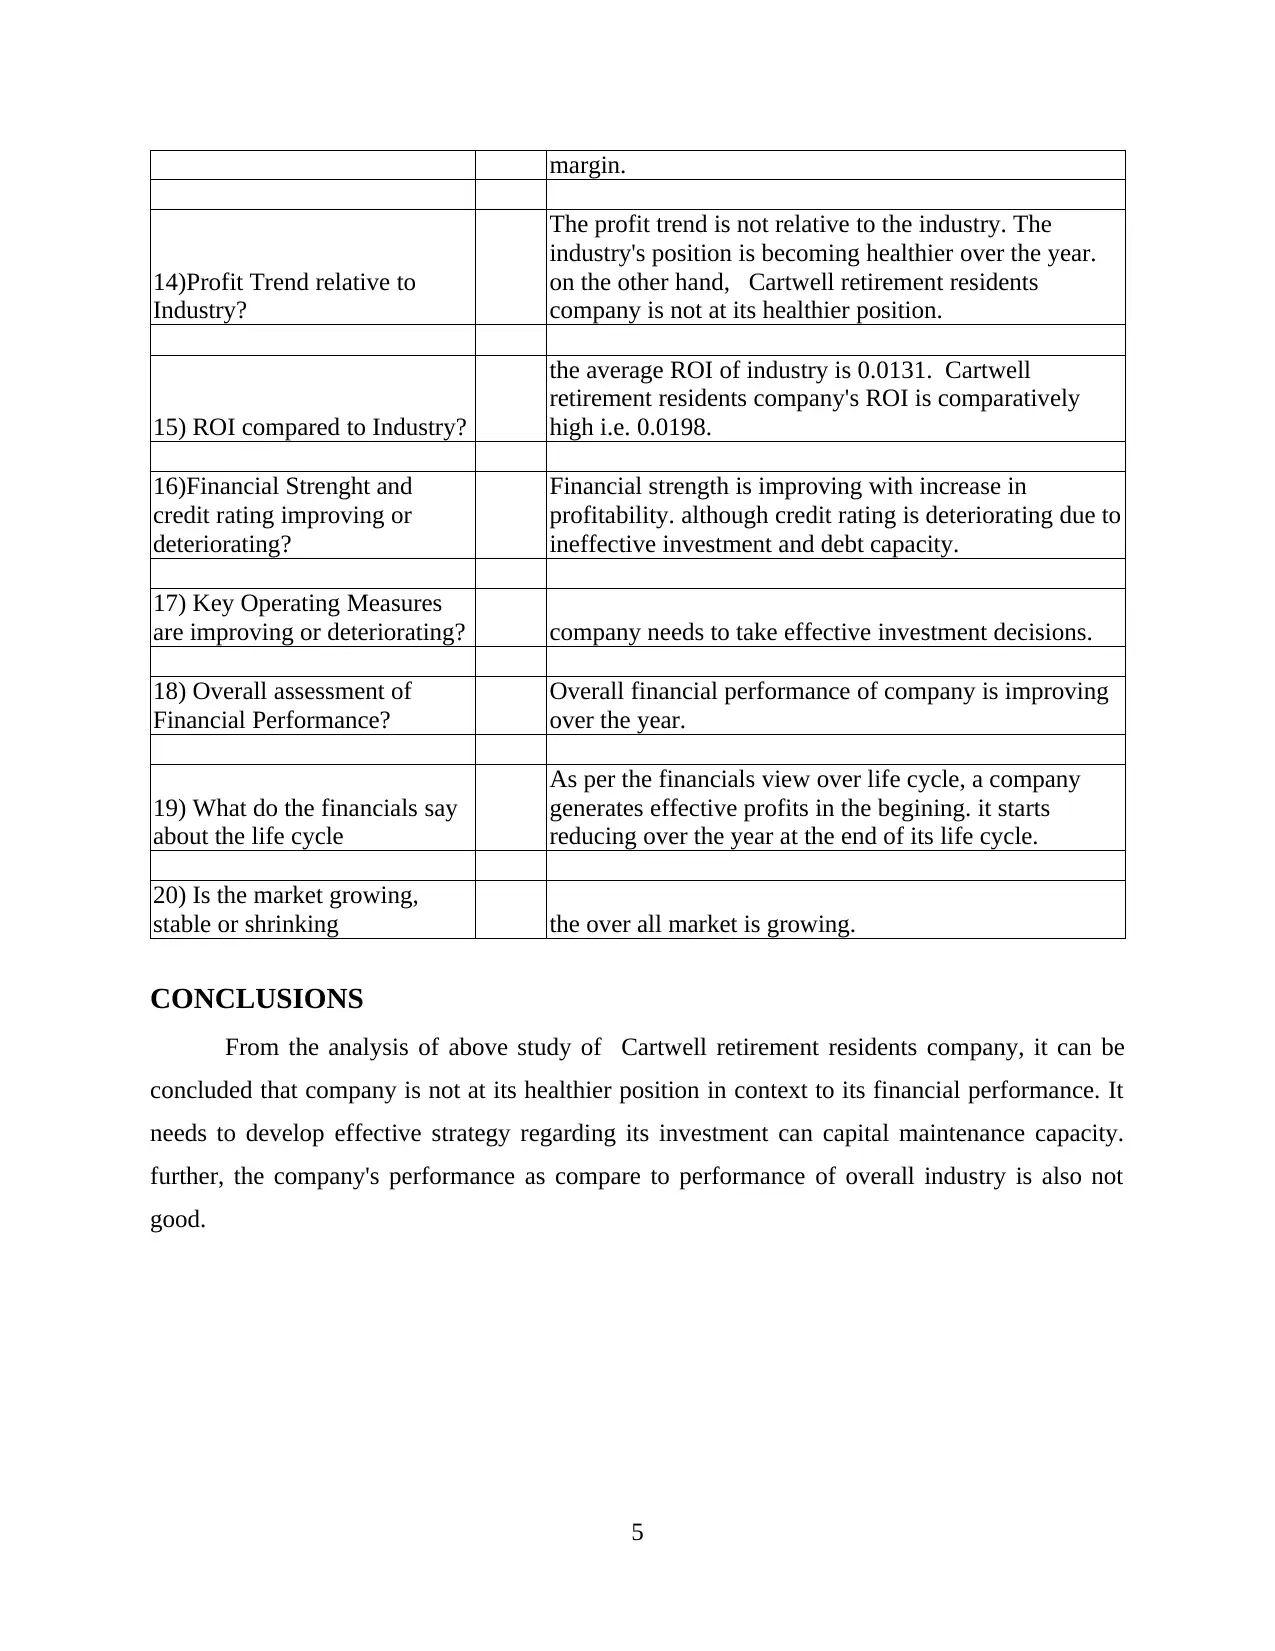
margin.
14)Profit Trend relative to
Industry?
The profit trend is not relative to the industry. The
industry's position is becoming healthier over the year.
on the other hand, Cartwell retirement residents
company is not at its healthier position.
15) ROI compared to Industry?
the average ROI of industry is 0.0131. Cartwell
retirement residents company's ROI is comparatively
high i.e. 0.0198.
16)Financial Strenght and
credit rating improving or
deteriorating?
Financial strength is improving with increase in
profitability. although credit rating is deteriorating due to
ineffective investment and debt capacity.
17) Key Operating Measures
are improving or deteriorating? company needs to take effective investment decisions.
18) Overall assessment of
Financial Performance?
Overall financial performance of company is improving
over the year.
19) What do the financials say
about the life cycle
As per the financials view over life cycle, a company
generates effective profits in the begining. it starts
reducing over the year at the end of its life cycle.
20) Is the market growing,
stable or shrinking the over all market is growing.
CONCLUSIONS
From the analysis of above study of Cartwell retirement residents company, it can be
concluded that company is not at its healthier position in context to its financial performance. It
needs to develop effective strategy regarding its investment can capital maintenance capacity.
further, the company's performance as compare to performance of overall industry is also not
good.
5
Paraphrase This Document
Need a fresh take? Get an instant paraphrase of this document with our AI Paraphraser
REFERENCES
Books and Journals
Knoefel, F. and et.al., 2018. Implementation of a Brain Training Pilot Study For People With
Mild Cognitive Impairment. Canadian Geriatrics Journal, 21(3), p.264.
Sequeira, J. L. and Casimiro, T. M., 2018. Portable Steam Engines and Traction Engines and
Their Use in Rural Areas: The Case of Lezíria Ribatejana, Portugal. Industrial
Archaeology Review, 40(1), pp.11-17.
Online
Chartwell Retirement Residences CSH.UN. 2018. [Online]. Available through :
<http://quote.morningstar.ca/Quicktakes/Financials/is.aspx?t=CSH.UN>.
6
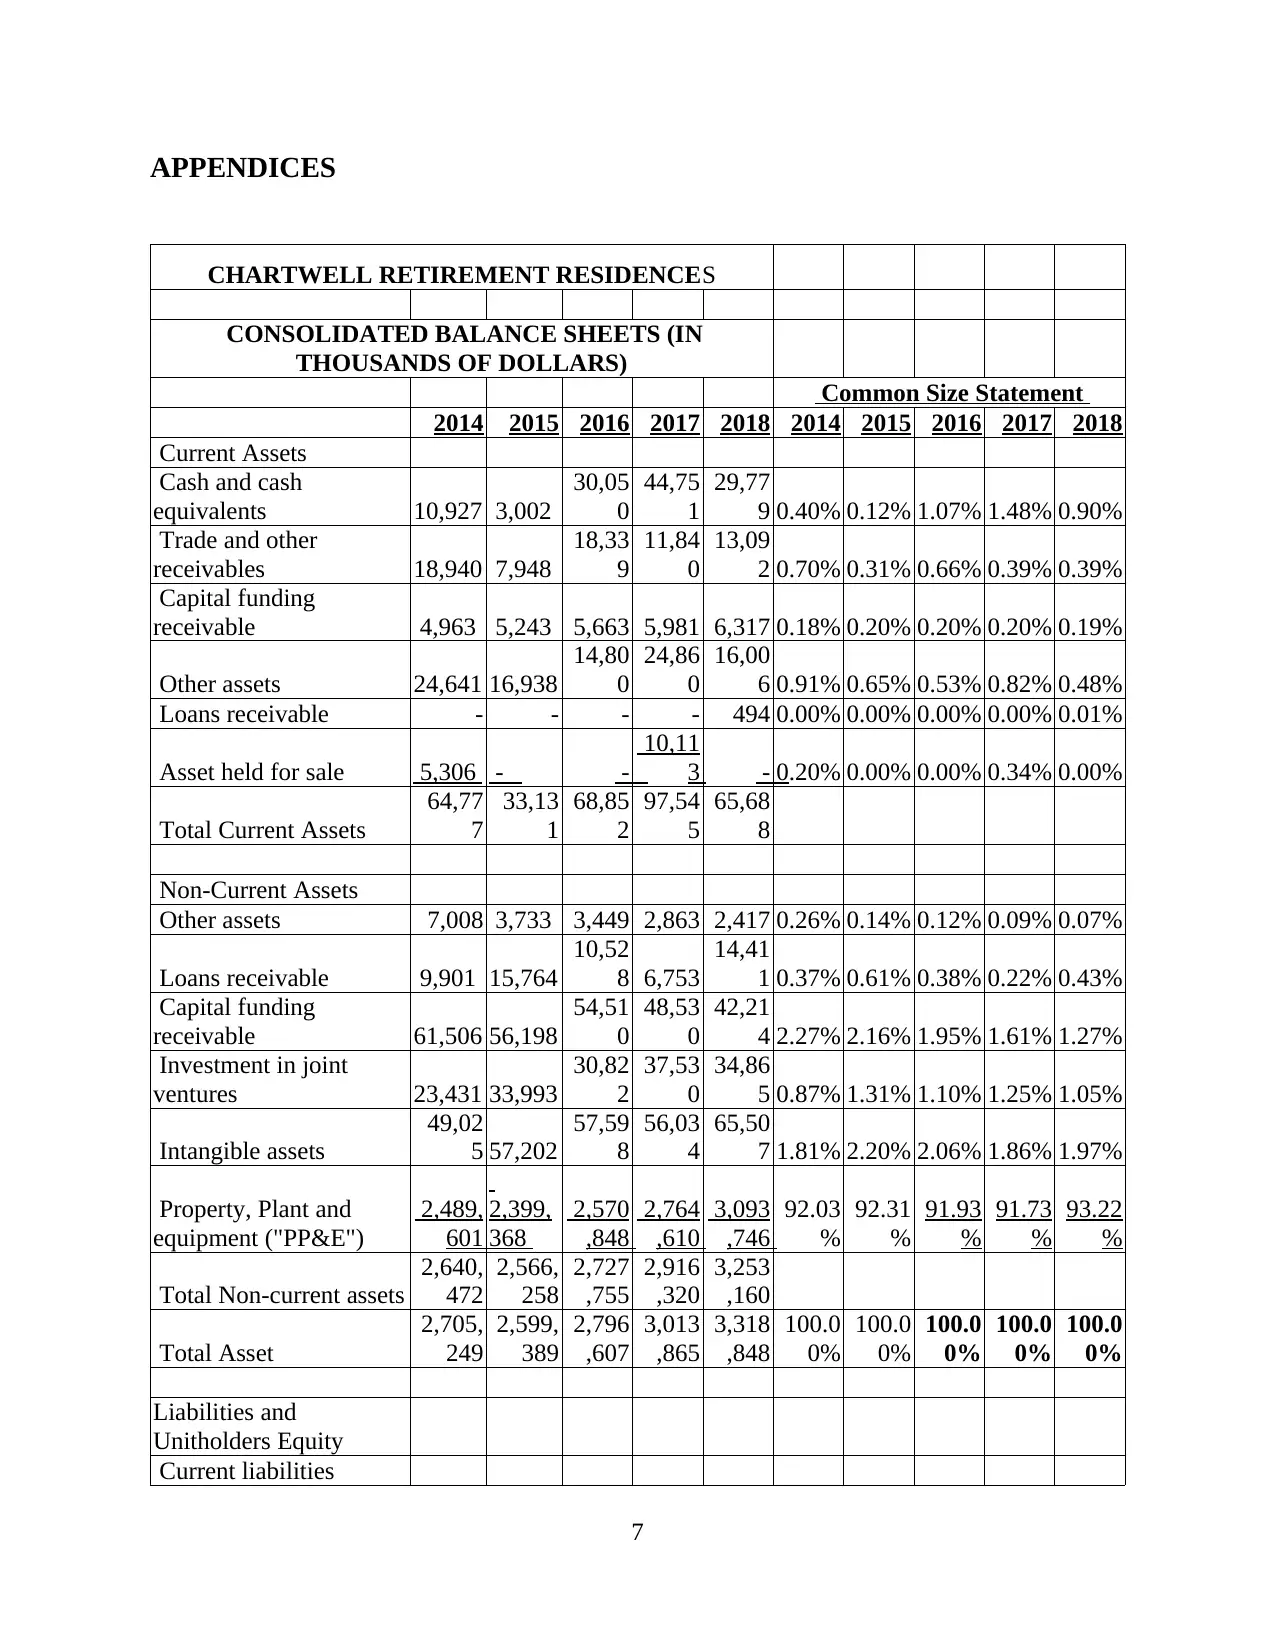
APPENDICES
CHARTWELL RETIREMENT RESIDENCES
CONSOLIDATED BALANCE SHEETS (IN
THOUSANDS OF DOLLARS)
Common Size Statement
2014 2015 2016 2017 2018 2014 2015 2016 2017 2018
Current Assets
Cash and cash
equivalents 10,927 3,002
30,05
0
44,75
1
29,77
9 0.40% 0.12% 1.07% 1.48% 0.90%
Trade and other
receivables 18,940 7,948
18,33
9
11,84
0
13,09
2 0.70% 0.31% 0.66% 0.39% 0.39%
Capital funding
receivable 4,963 5,243 5,663 5,981 6,317 0.18% 0.20% 0.20% 0.20% 0.19%
Other assets 24,641 16,938
14,80
0
24,86
0
16,00
6 0.91% 0.65% 0.53% 0.82% 0.48%
Loans receivable - - - - 494 0.00% 0.00% 0.00% 0.00% 0.01%
Asset held for sale 5,306 - -
10,11
3 - 0.20% 0.00% 0.00% 0.34% 0.00%
Total Current Assets
64,77
7
33,13
1
68,85
2
97,54
5
65,68
8
Non-Current Assets
Other assets 7,008 3,733 3,449 2,863 2,417 0.26% 0.14% 0.12% 0.09% 0.07%
Loans receivable 9,901 15,764
10,52
8 6,753
14,41
1 0.37% 0.61% 0.38% 0.22% 0.43%
Capital funding
receivable 61,506 56,198
54,51
0
48,53
0
42,21
4 2.27% 2.16% 1.95% 1.61% 1.27%
Investment in joint
ventures 23,431 33,993
30,82
2
37,53
0
34,86
5 0.87% 1.31% 1.10% 1.25% 1.05%
Intangible assets
49,02
5 57,202
57,59
8
56,03
4
65,50
7 1.81% 2.20% 2.06% 1.86% 1.97%
Property, Plant and
equipment ("PP&E")
2,489,
601
2,399,
368
2,570
,848
2,764
,610
3,093
,746
92.03
%
92.31
%
91.93
%
91.73
%
93.22
%
Total Non-current assets
2,640,
472
2,566,
258
2,727
,755
2,916
,320
3,253
,160
Total Asset
2,705,
249
2,599,
389
2,796
,607
3,013
,865
3,318
,848
100.0
0%
100.0
0%
100.0
0%
100.0
0%
100.0
0%
Liabilities and
Unitholders Equity
Current liabilities
7
⊘ This is a preview!⊘
Do you want full access?
Subscribe today to unlock all pages.
Trusted by 1+ million students worldwide
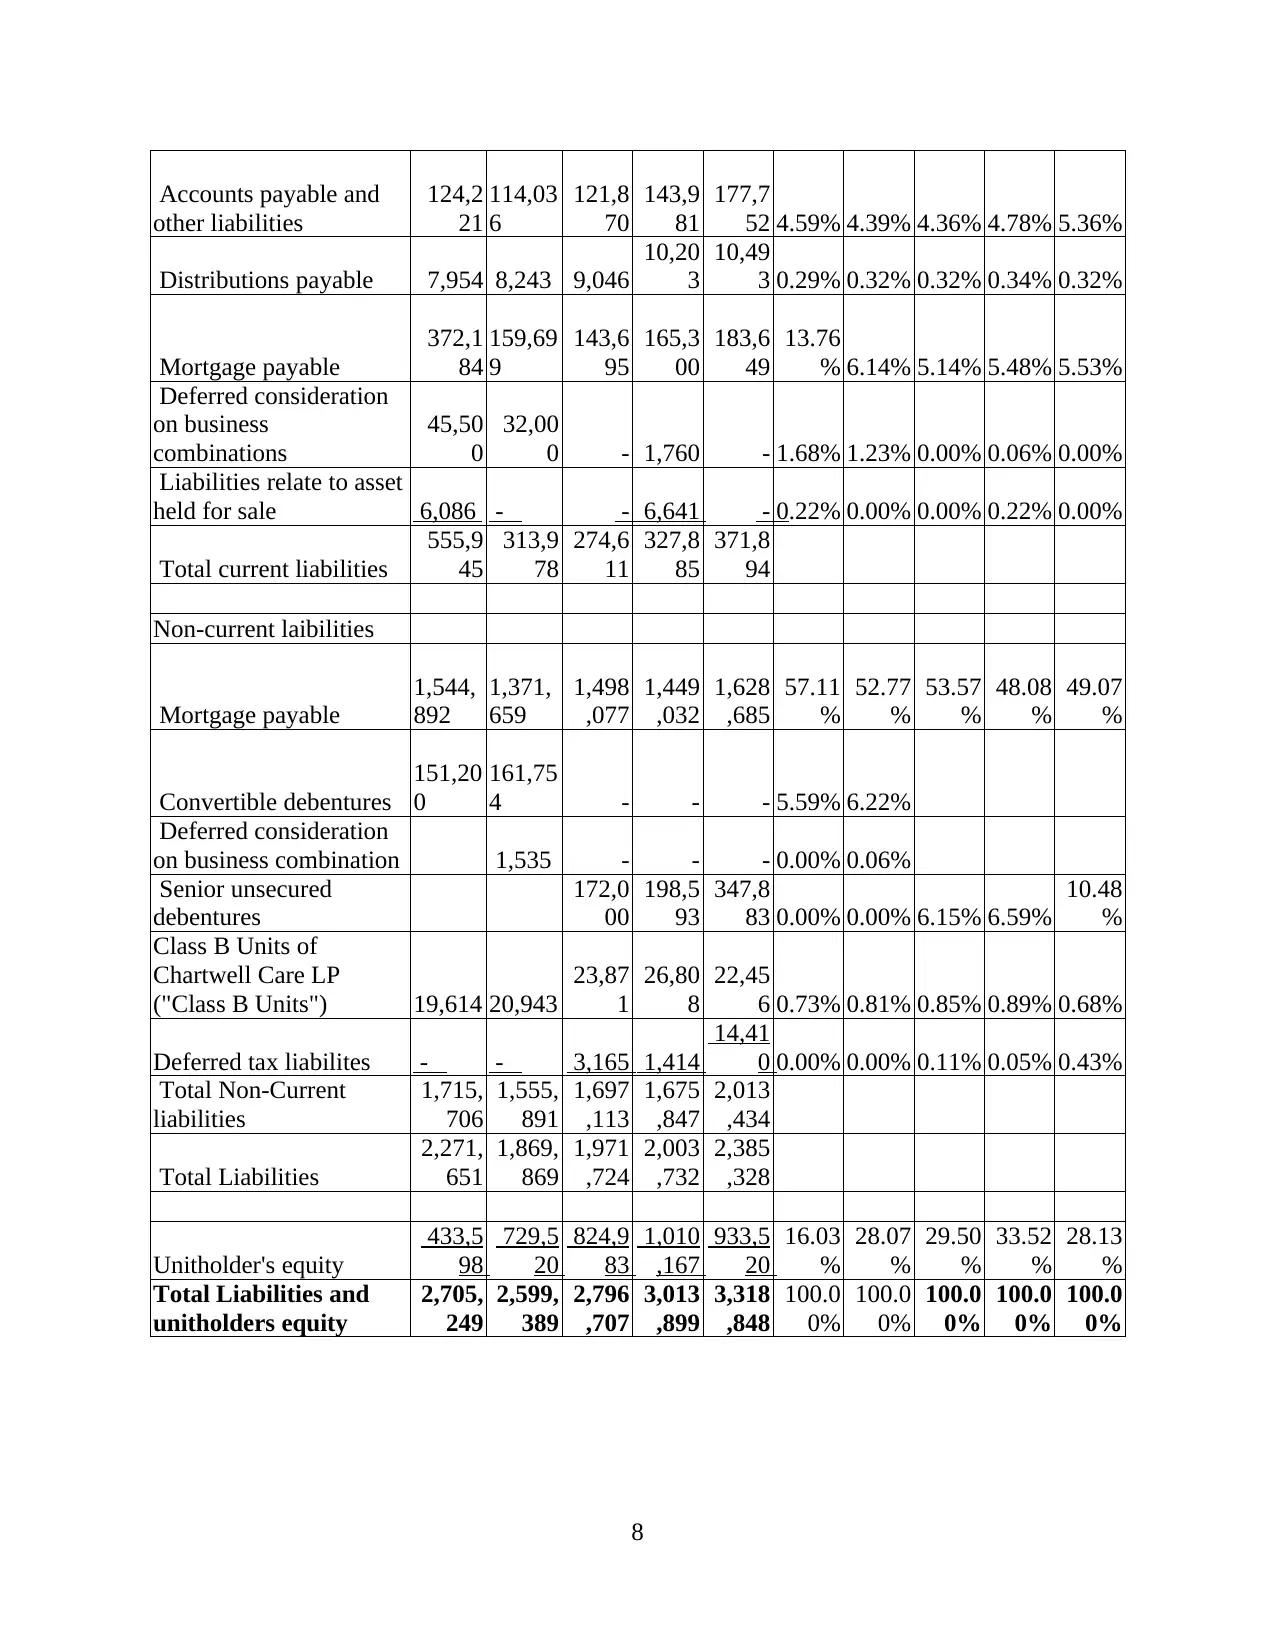
Accounts payable and
other liabilities
124,2
21
114,03
6
121,8
70
143,9
81
177,7
52 4.59% 4.39% 4.36% 4.78% 5.36%
Distributions payable 7,954 8,243 9,046
10,20
3
10,49
3 0.29% 0.32% 0.32% 0.34% 0.32%
Mortgage payable
372,1
84
159,69
9
143,6
95
165,3
00
183,6
49
13.76
% 6.14% 5.14% 5.48% 5.53%
Deferred consideration
on business
combinations
45,50
0
32,00
0 - 1,760 - 1.68% 1.23% 0.00% 0.06% 0.00%
Liabilities relate to asset
held for sale 6,086 - - 6,641 - 0.22% 0.00% 0.00% 0.22% 0.00%
Total current liabilities
555,9
45
313,9
78
274,6
11
327,8
85
371,8
94
Non-current laibilities
Mortgage payable
1,544,
892
1,371,
659
1,498
,077
1,449
,032
1,628
,685
57.11
%
52.77
%
53.57
%
48.08
%
49.07
%
Convertible debentures
151,20
0
161,75
4 - - - 5.59% 6.22%
Deferred consideration
on business combination 1,535 - - - 0.00% 0.06%
Senior unsecured
debentures
172,0
00
198,5
93
347,8
83 0.00% 0.00% 6.15% 6.59%
10.48
%
Class B Units of
Chartwell Care LP
("Class B Units") 19,614 20,943
23,87
1
26,80
8
22,45
6 0.73% 0.81% 0.85% 0.89% 0.68%
Deferred tax liabilites - - 3,165 1,414
14,41
0 0.00% 0.00% 0.11% 0.05% 0.43%
Total Non-Current
liabilities
1,715,
706
1,555,
891
1,697
,113
1,675
,847
2,013
,434
Total Liabilities
2,271,
651
1,869,
869
1,971
,724
2,003
,732
2,385
,328
Unitholder's equity
433,5
98
729,5
20
824,9
83
1,010
,167
933,5
20
16.03
%
28.07
%
29.50
%
33.52
%
28.13
%
Total Liabilities and
unitholders equity
2,705,
249
2,599,
389
2,796
,707
3,013
,899
3,318
,848
100.0
0%
100.0
0%
100.0
0%
100.0
0%
100.0
0%
8
Paraphrase This Document
Need a fresh take? Get an instant paraphrase of this document with our AI Paraphraser
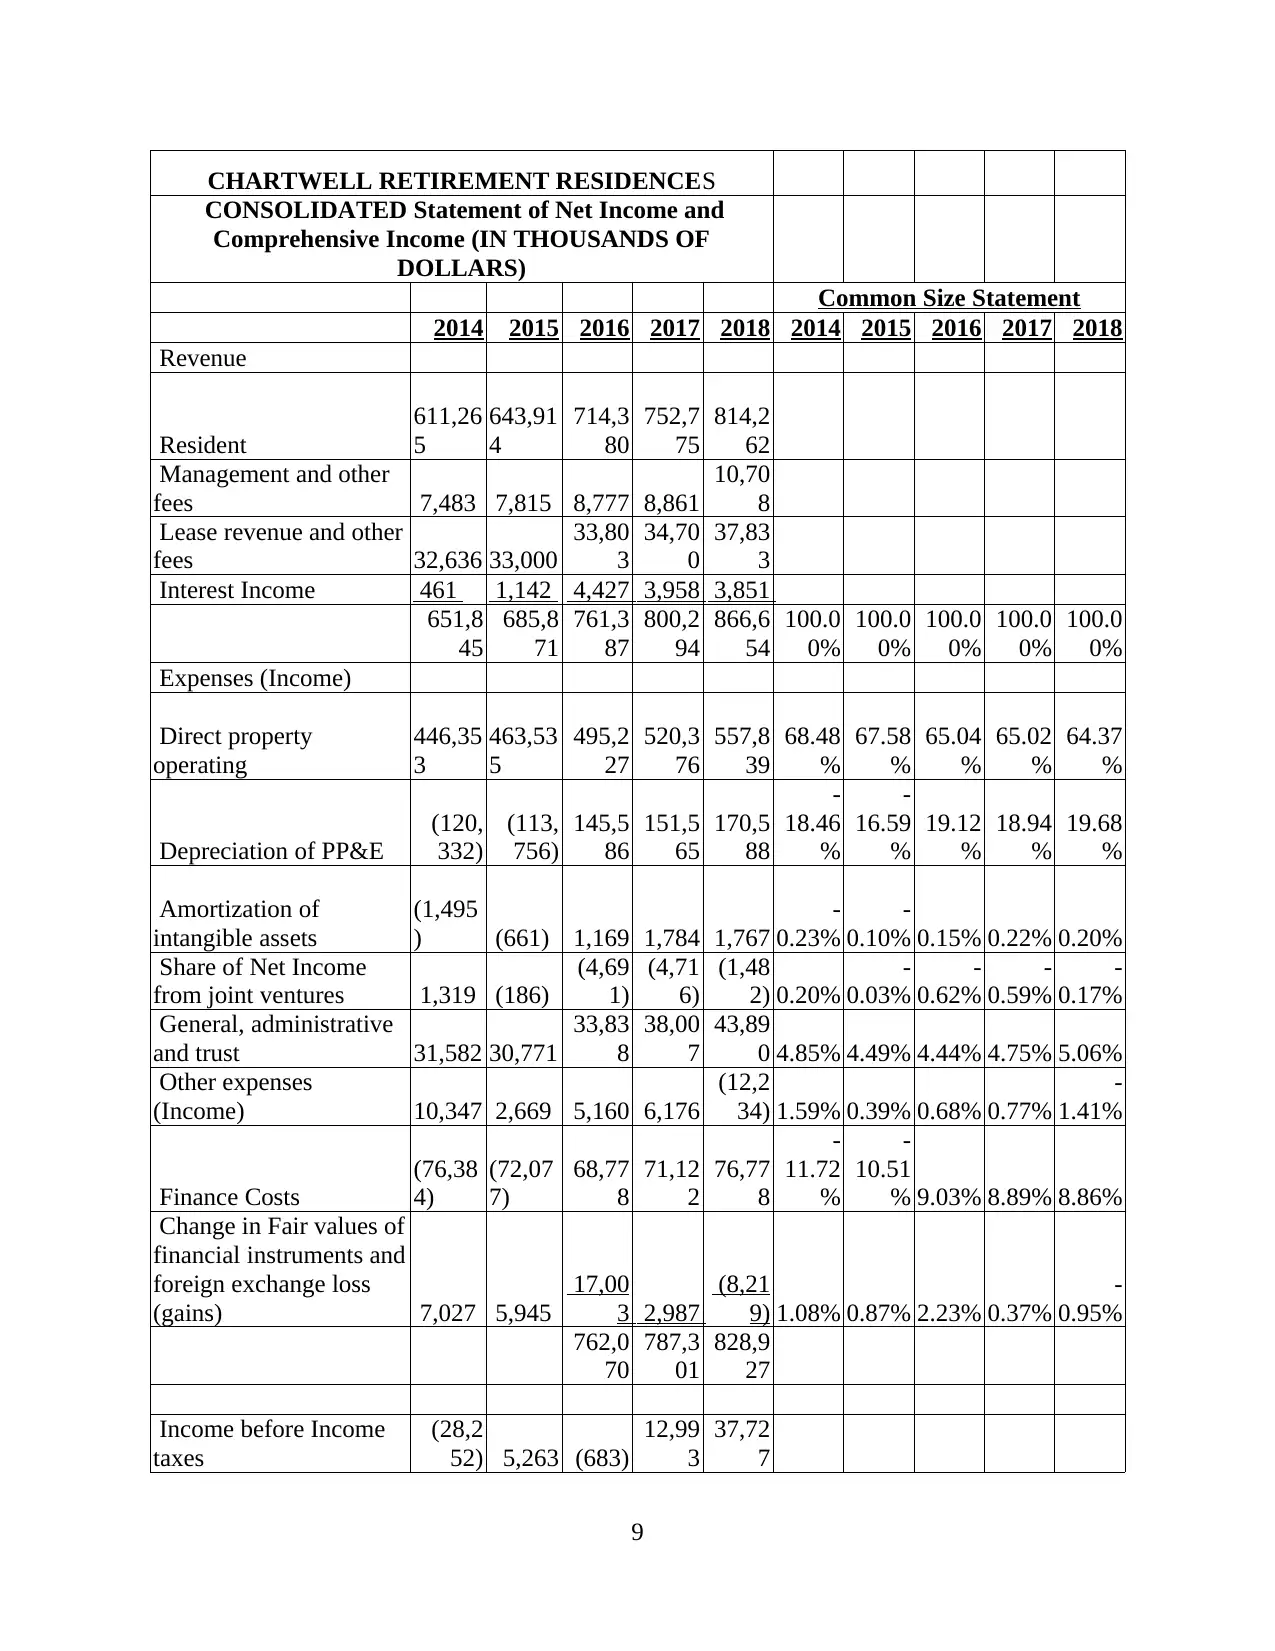
CHARTWELL RETIREMENT RESIDENCES
CONSOLIDATED Statement of Net Income and
Comprehensive Income (IN THOUSANDS OF
DOLLARS)
Common Size Statement
2014 2015 2016 2017 2018 2014 2015 2016 2017 2018
Revenue
Resident
611,26
5
643,91
4
714,3
80
752,7
75
814,2
62
Management and other
fees 7,483 7,815 8,777 8,861
10,70
8
Lease revenue and other
fees 32,636 33,000
33,80
3
34,70
0
37,83
3
Interest Income 461 1,142 4,427 3,958 3,851
651,8
45
685,8
71
761,3
87
800,2
94
866,6
54
100.0
0%
100.0
0%
100.0
0%
100.0
0%
100.0
0%
Expenses (Income)
Direct property
operating
446,35
3
463,53
5
495,2
27
520,3
76
557,8
39
68.48
%
67.58
%
65.04
%
65.02
%
64.37
%
Depreciation of PP&E
(120,
332)
(113,
756)
145,5
86
151,5
65
170,5
88
-
18.46
%
-
16.59
%
19.12
%
18.94
%
19.68
%
Amortization of
intangible assets
(1,495
) (661) 1,169 1,784 1,767
-
0.23%
-
0.10% 0.15% 0.22% 0.20%
Share of Net Income
from joint ventures 1,319 (186)
(4,69
1)
(4,71
6)
(1,48
2) 0.20%
-
0.03%
-
0.62%
-
0.59%
-
0.17%
General, administrative
and trust 31,582 30,771
33,83
8
38,00
7
43,89
0 4.85% 4.49% 4.44% 4.75% 5.06%
Other expenses
(Income) 10,347 2,669 5,160 6,176
(12,2
34) 1.59% 0.39% 0.68% 0.77%
-
1.41%
Finance Costs
(76,38
4)
(72,07
7)
68,77
8
71,12
2
76,77
8
-
11.72
%
-
10.51
% 9.03% 8.89% 8.86%
Change in Fair values of
financial instruments and
foreign exchange loss
(gains) 7,027 5,945
17,00
3 2,987
(8,21
9) 1.08% 0.87% 2.23% 0.37%
-
0.95%
762,0
70
787,3
01
828,9
27
Income before Income
taxes
(28,2
52) 5,263 (683)
12,99
3
37,72
7
9
Income tax expense
(benefit):
Current 2,222
(1,340
) (27) 15 63 0.34%
-
0.20% 0.00% 0.00% 0.01%
Deffered - 8,216 - (104)
19,14
5 0.00% 1.20% 0.00%
-
0.01% 2.21%
(27) (89)
19,20
8
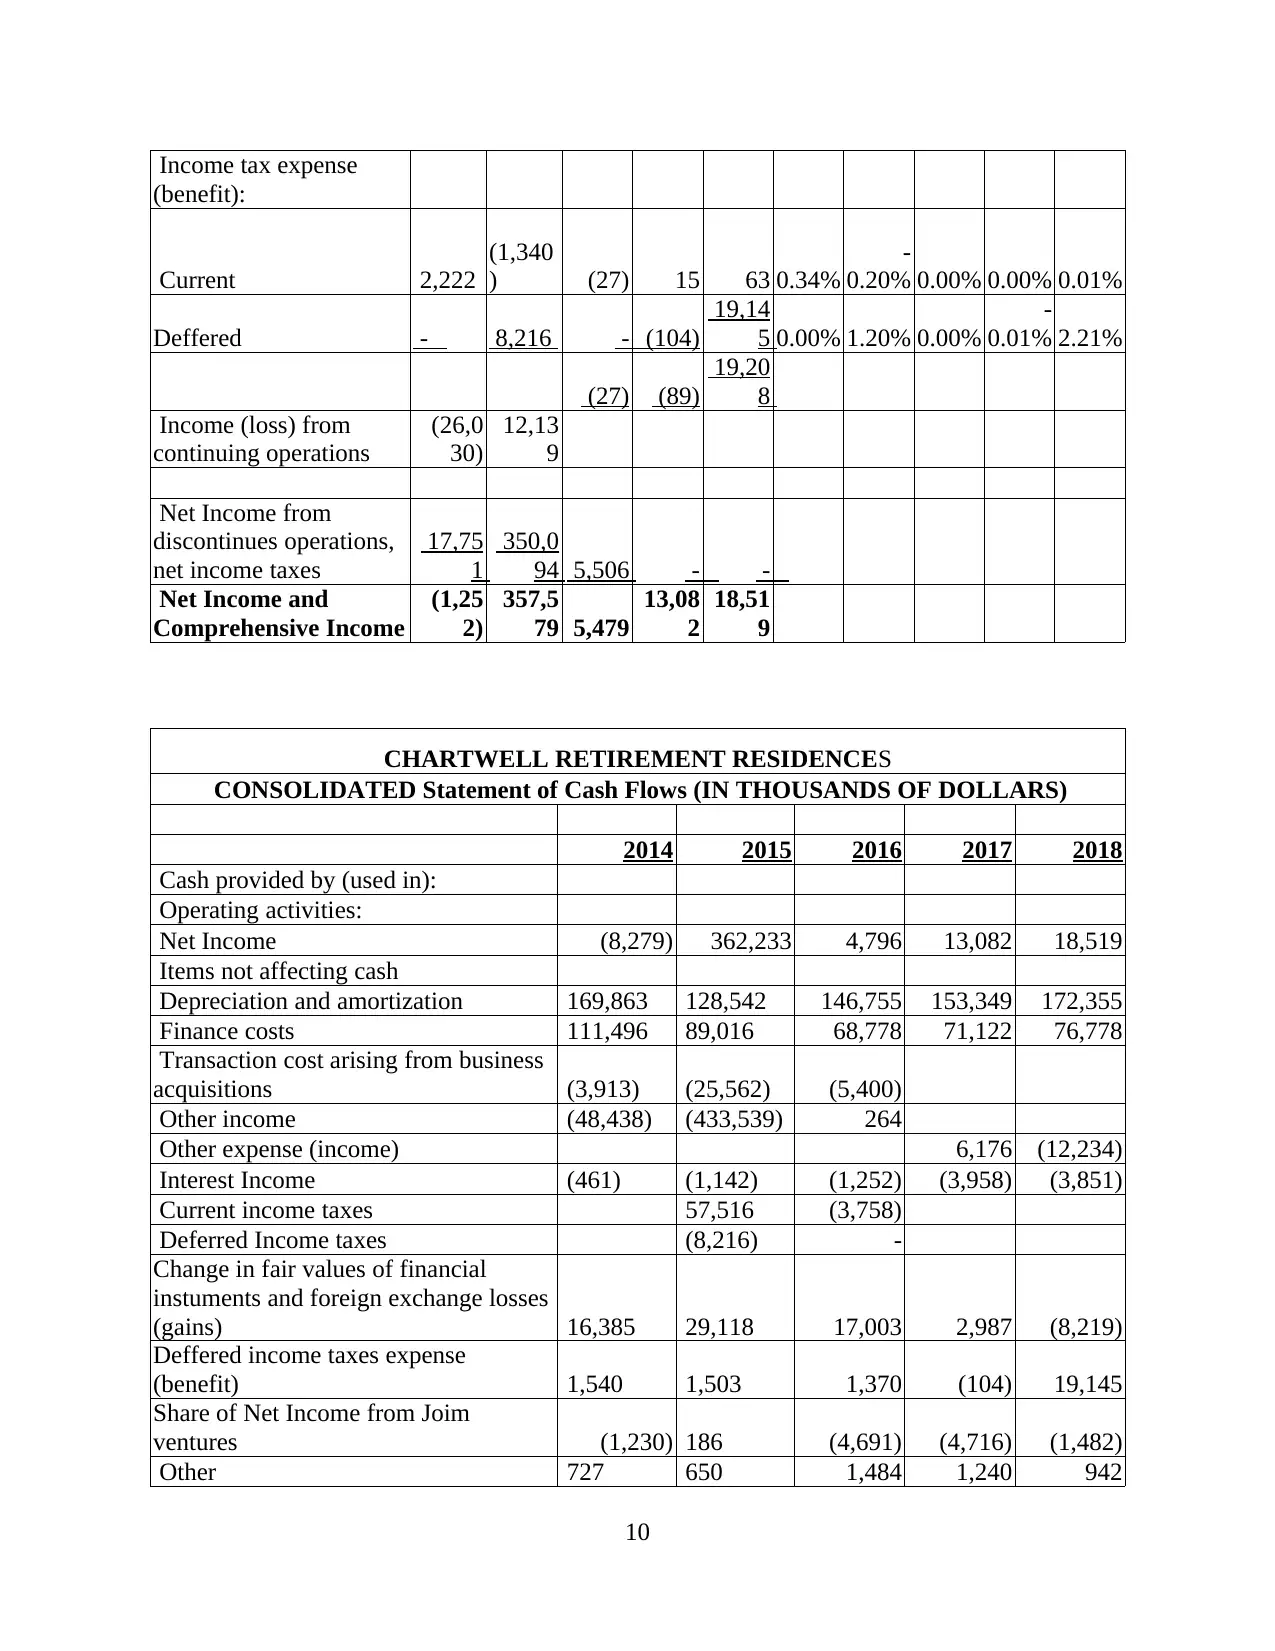
Income (loss) from
continuing operations
(26,0
30)
12,13
9
Net Income from
discontinues operations,
net income taxes
17,75
1
350,0
94 5,506 - -
Net Income and
Comprehensive Income
(1,25
2)
357,5
79 5,479
13,08
2
18,51
9
CHARTWELL RETIREMENT RESIDENCES
CONSOLIDATED Statement of Cash Flows (IN THOUSANDS OF DOLLARS)
2014 2015 2016 2017 2018
Cash provided by (used in):
Operating activities:
Net Income (8,279) 362,233 4,796 13,082 18,519
Items not affecting cash
Depreciation and amortization 169,863 128,542 146,755 153,349 172,355
Finance costs 111,496 89,016 68,778 71,122 76,778
Transaction cost arising from business
acquisitions (3,913) (25,562) (5,400)
Other income (48,438) (433,539) 264
Other expense (income) 6,176 (12,234)
Interest Income (461) (1,142) (1,252) (3,958) (3,851)
Current income taxes 57,516 (3,758)
Deferred Income taxes (8,216) -
Change in fair values of financial
instuments and foreign exchange losses
(gains) 16,385 29,118 17,003 2,987 (8,219)
Deffered income taxes expense
(benefit) 1,540 1,503 1,370 (104) 19,145
Share of Net Income from Joim
ventures (1,230) 186 (4,691) (4,716) (1,482)
Other 727 650 1,484 1,240 942
10
(benefit):
Current 2,222
(1,340
) (27) 15 63 0.34%
-
0.20% 0.00% 0.00% 0.01%
Deffered - 8,216 - (104)
19,14
5 0.00% 1.20% 0.00%
-
0.01% 2.21%
(27) (89)
19,20
8
Income (loss) from
continuing operations
(26,0
30)
12,13
9
Net Income from
discontinues operations,
net income taxes
17,75
1
350,0
94 5,506 - -
Net Income and
Comprehensive Income
(1,25
2)
357,5
79 5,479
13,08
2
18,51
9
CHARTWELL RETIREMENT RESIDENCES
CONSOLIDATED Statement of Cash Flows (IN THOUSANDS OF DOLLARS)
2014 2015 2016 2017 2018
Cash provided by (used in):
Operating activities:
Net Income (8,279) 362,233 4,796 13,082 18,519
Items not affecting cash
Depreciation and amortization 169,863 128,542 146,755 153,349 172,355
Finance costs 111,496 89,016 68,778 71,122 76,778
Transaction cost arising from business
acquisitions (3,913) (25,562) (5,400)
Other income (48,438) (433,539) 264
Other expense (income) 6,176 (12,234)
Interest Income (461) (1,142) (1,252) (3,958) (3,851)
Current income taxes 57,516 (3,758)
Deferred Income taxes (8,216) -
Change in fair values of financial
instuments and foreign exchange losses
(gains) 16,385 29,118 17,003 2,987 (8,219)
Deffered income taxes expense
(benefit) 1,540 1,503 1,370 (104) 19,145
Share of Net Income from Joim
ventures (1,230) 186 (4,691) (4,716) (1,482)
Other 727 650 1,484 1,240 942
10
⊘ This is a preview!⊘
Do you want full access?
Subscribe today to unlock all pages.
Trusted by 1+ million students worldwide
1 out of 14
Related Documents


Your All-in-One AI-Powered Toolkit for Academic Success.
+13062052269
info@desklib.com
Available 24*7 on WhatsApp / Email
![[object Object]](/_next/static/media/star-bottom.7253800d.svg)
Unlock your academic potential
Copyright © 2020–2026 A2Z Services. All Rights Reserved. Developed and managed by ZUCOL.