Comprehensive Ratio Analysis of Cary Company: System Implementation

Verified

Added on  2019/09/22

|11
|1552
|299
Report
AI Summary
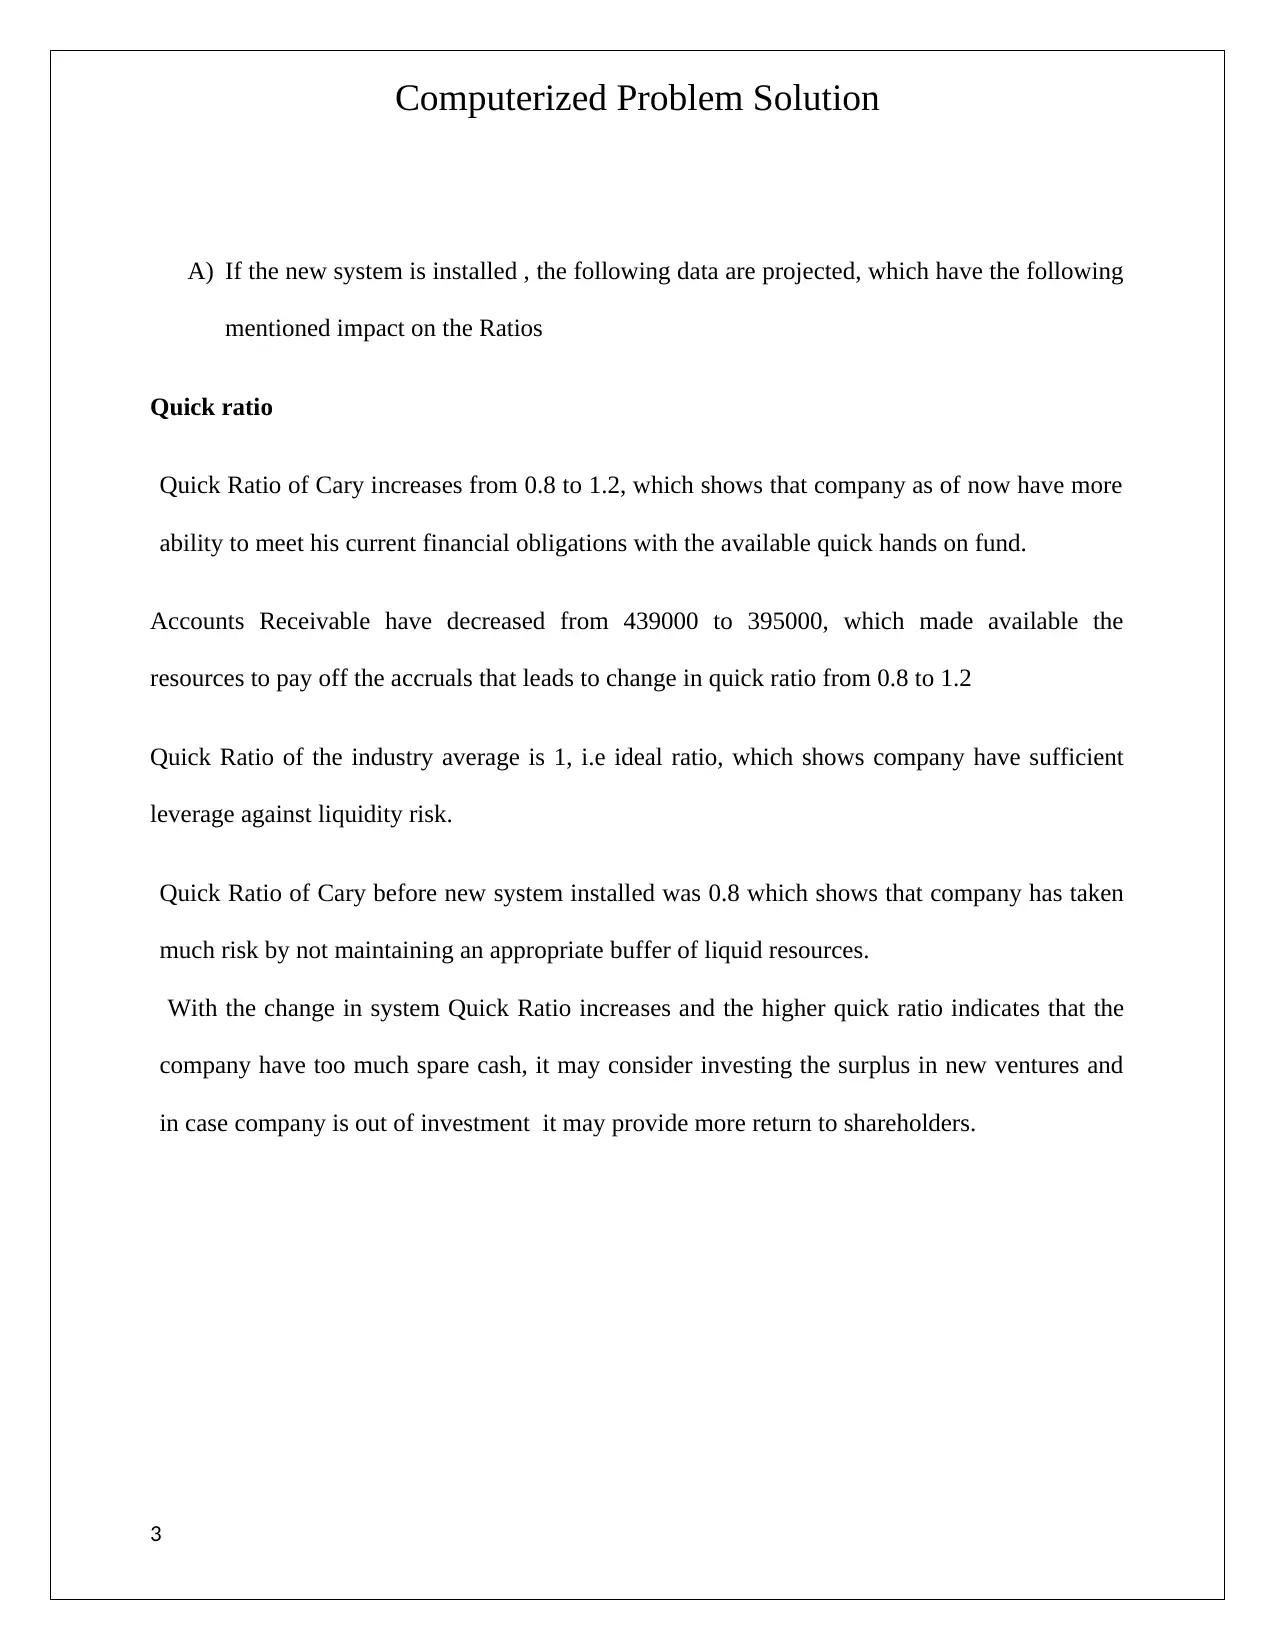
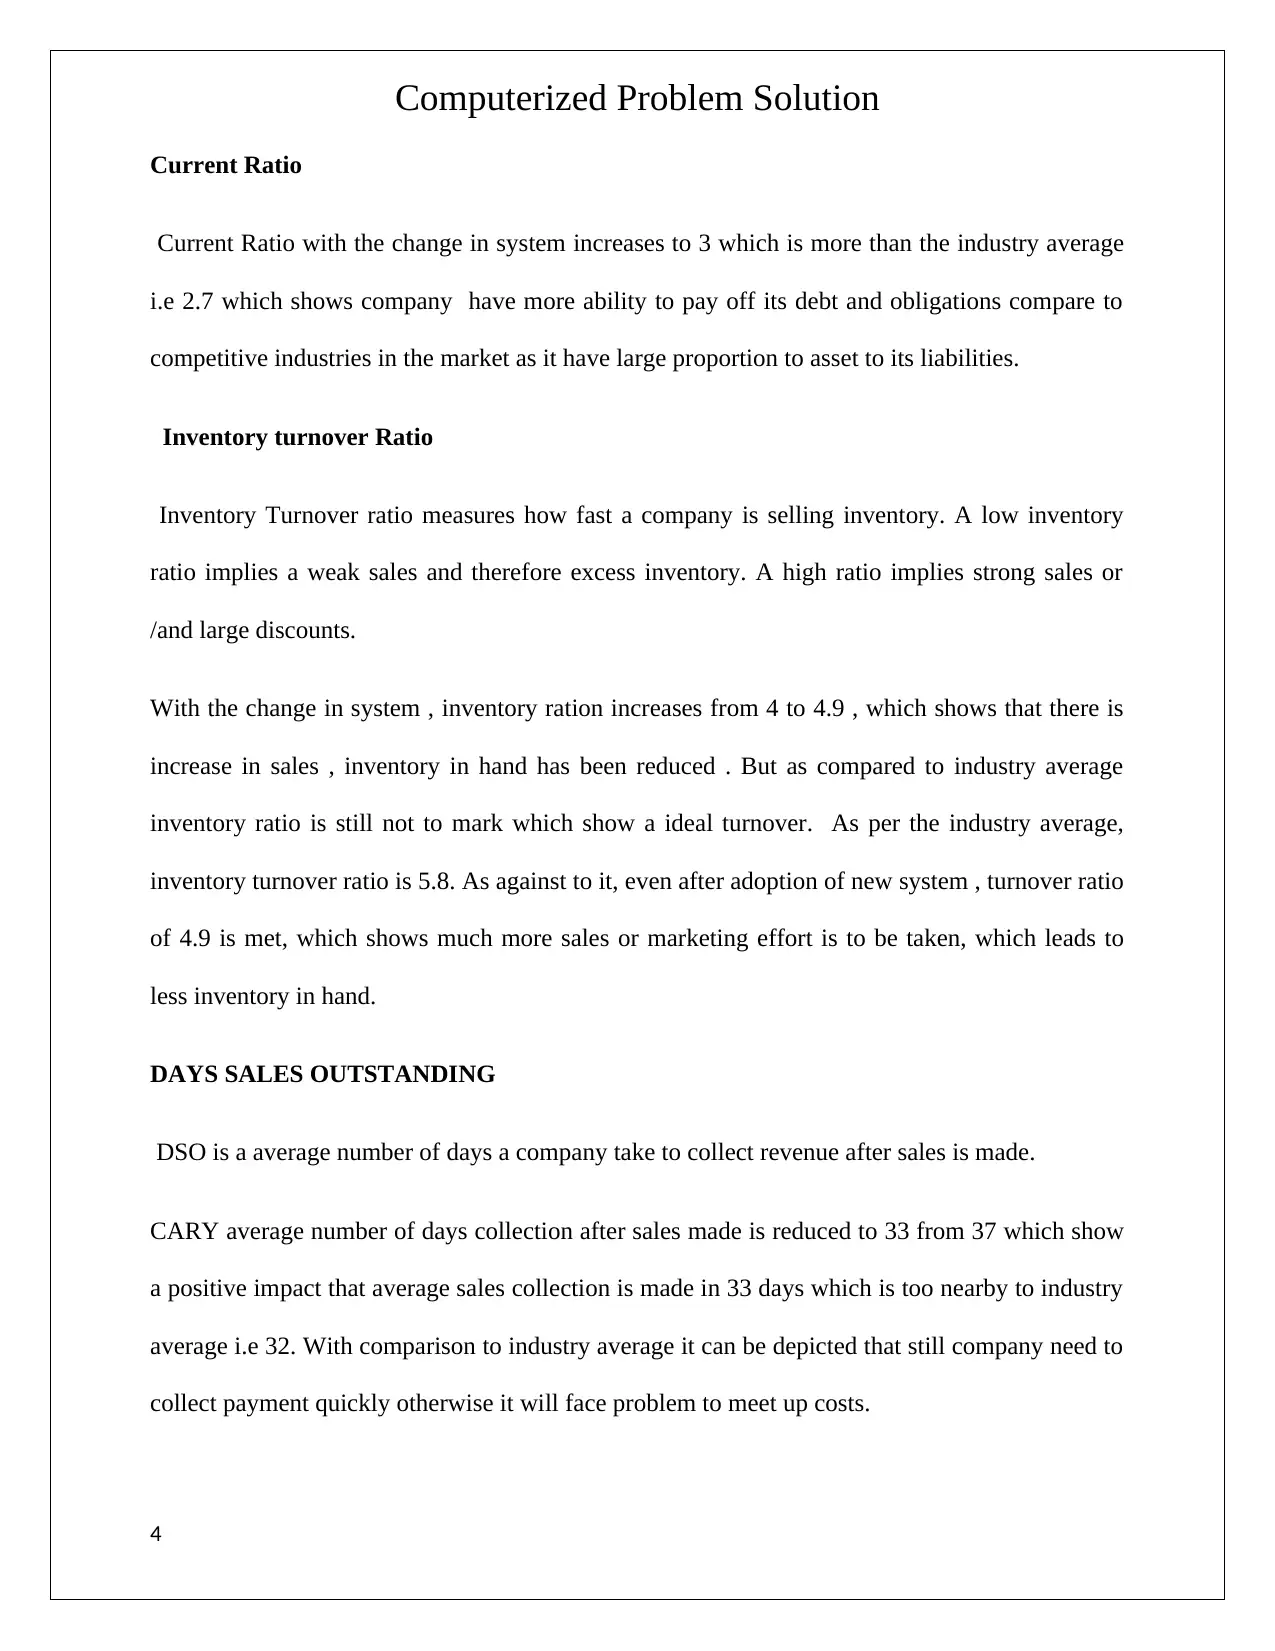
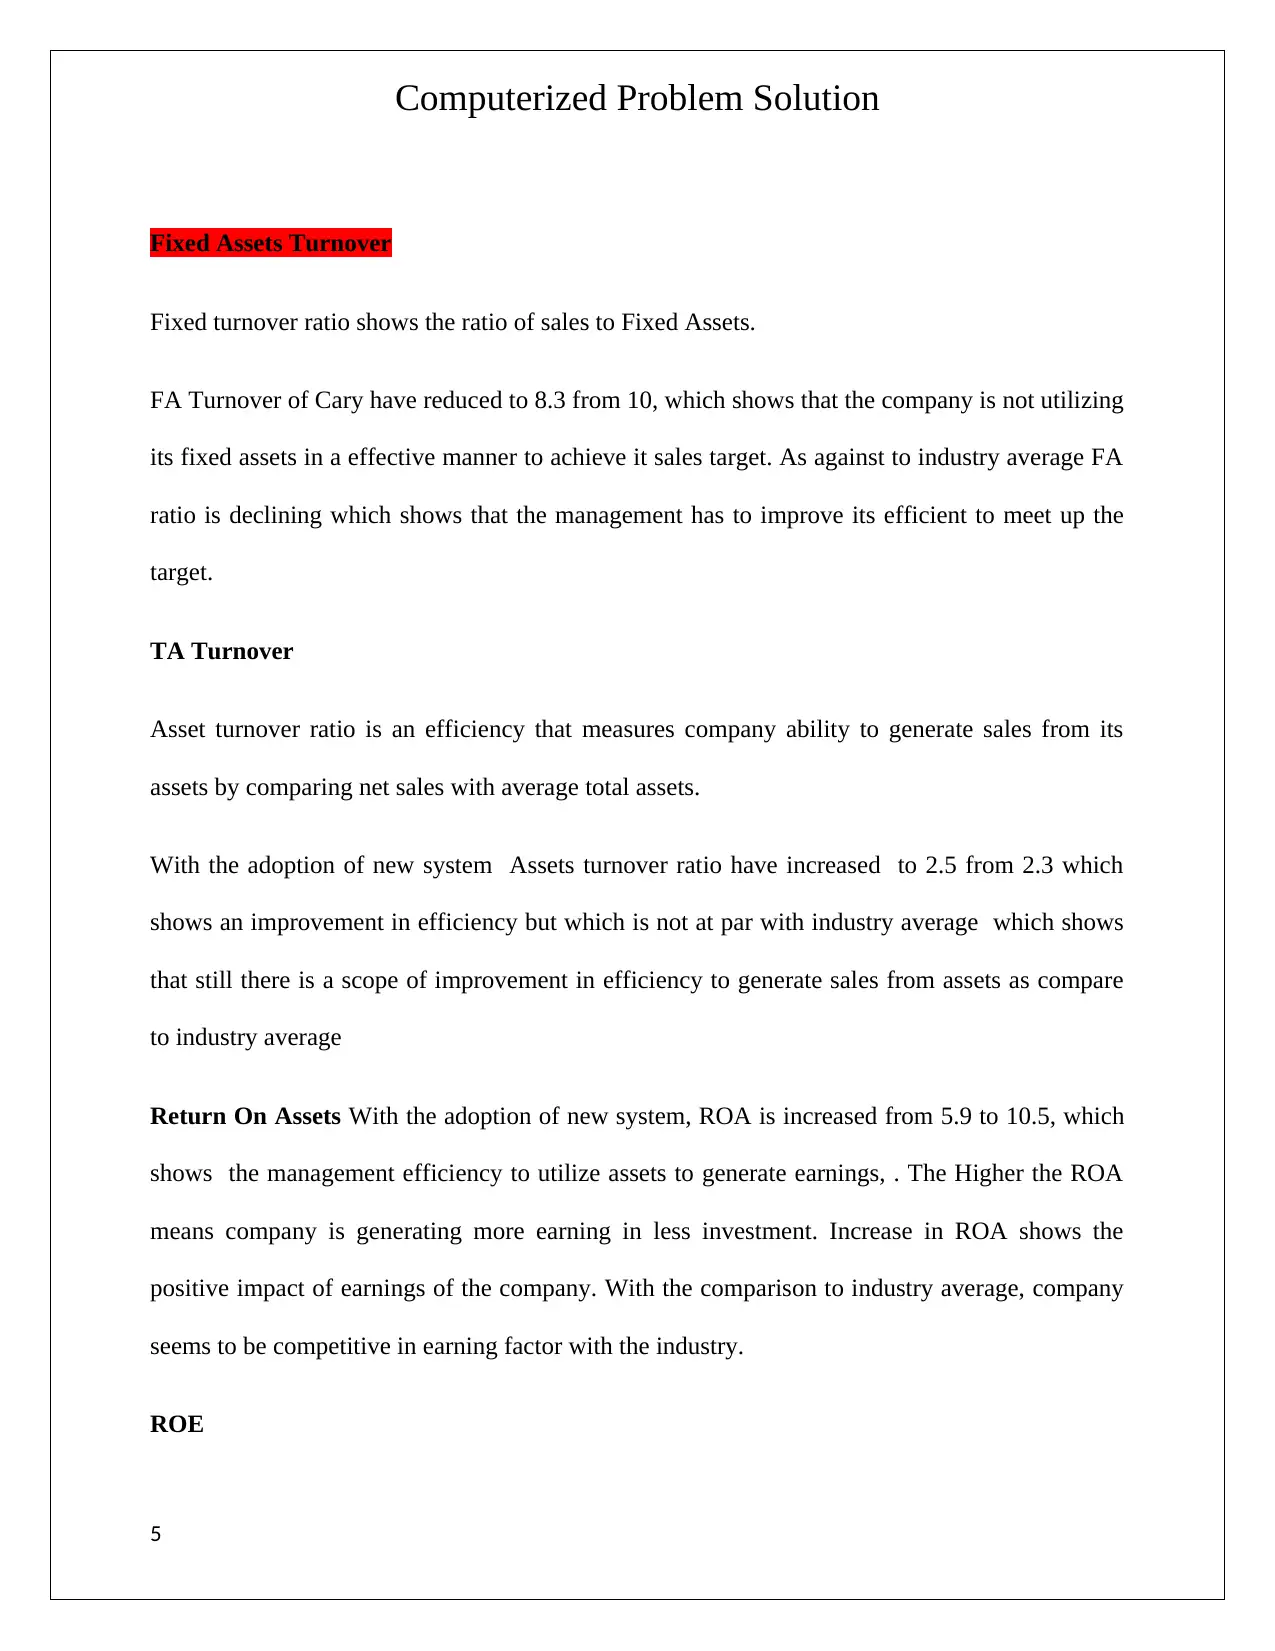
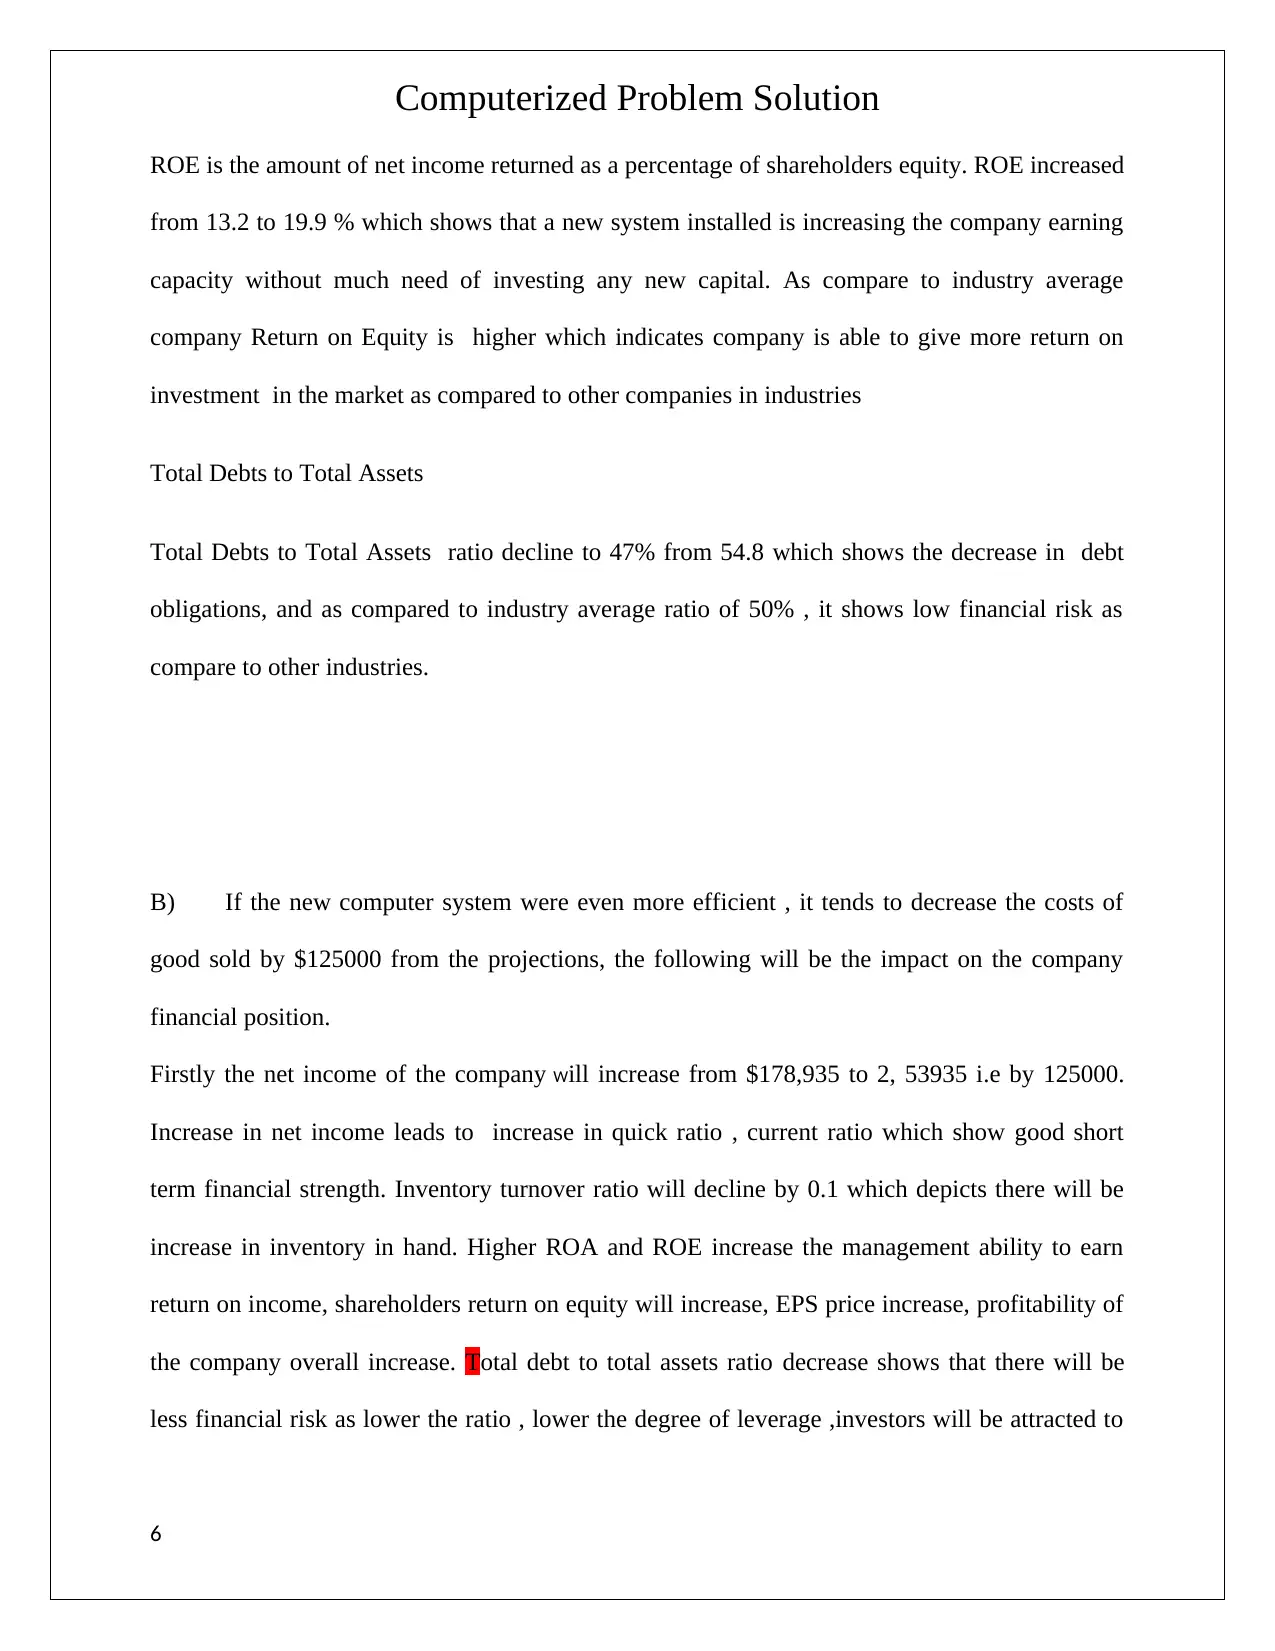
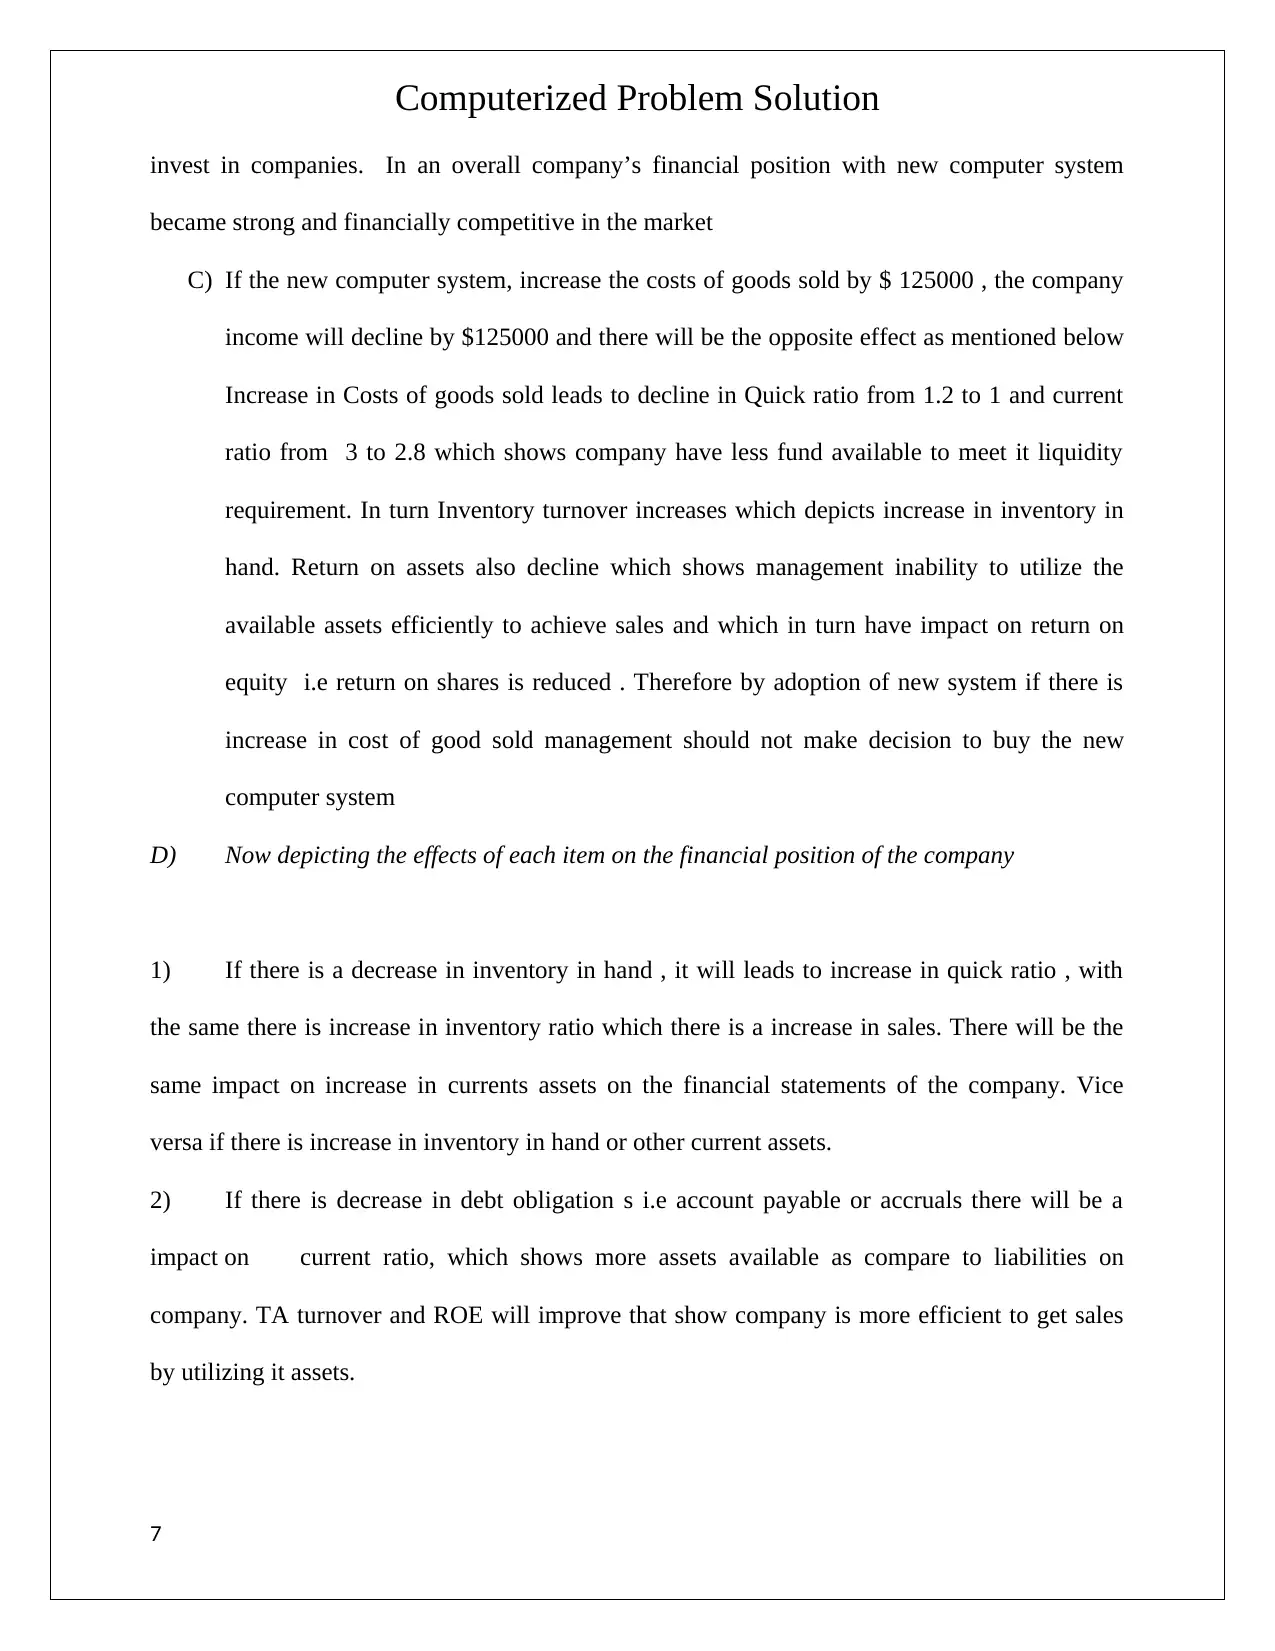
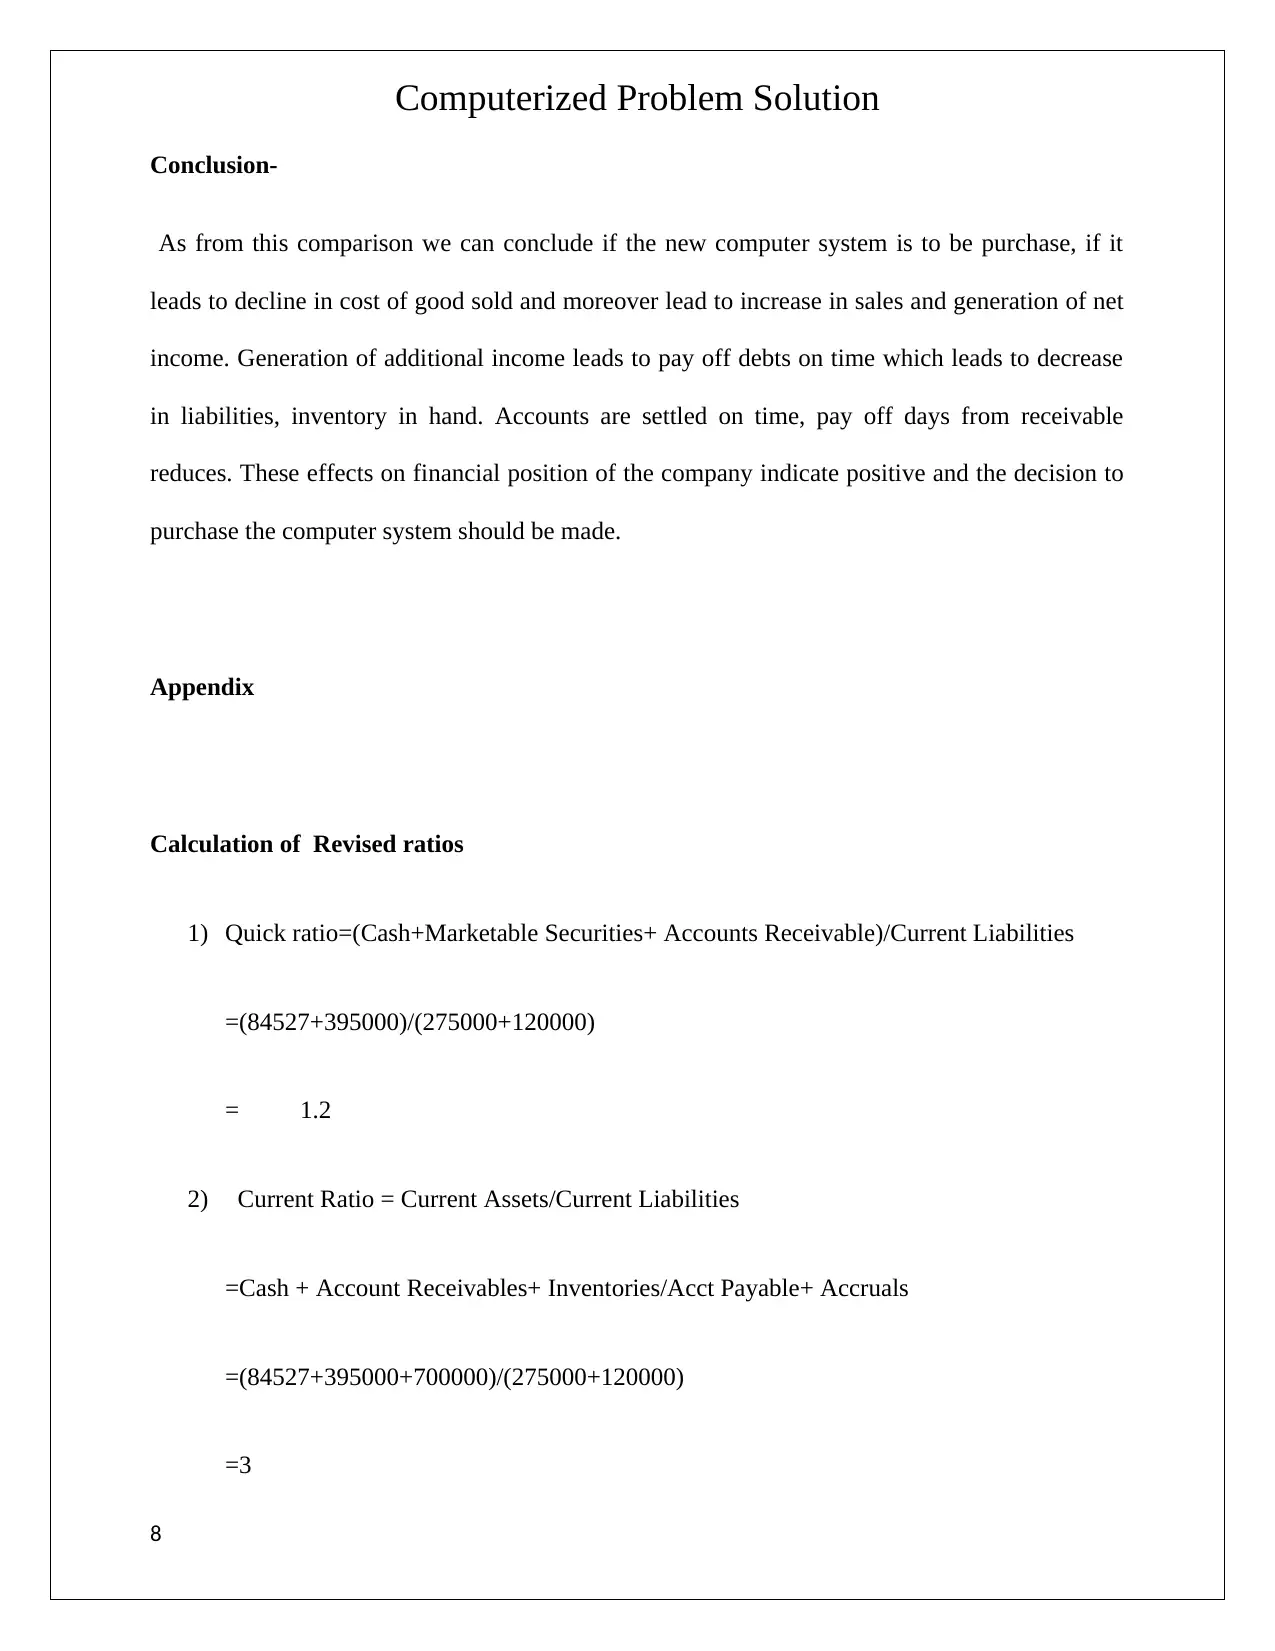
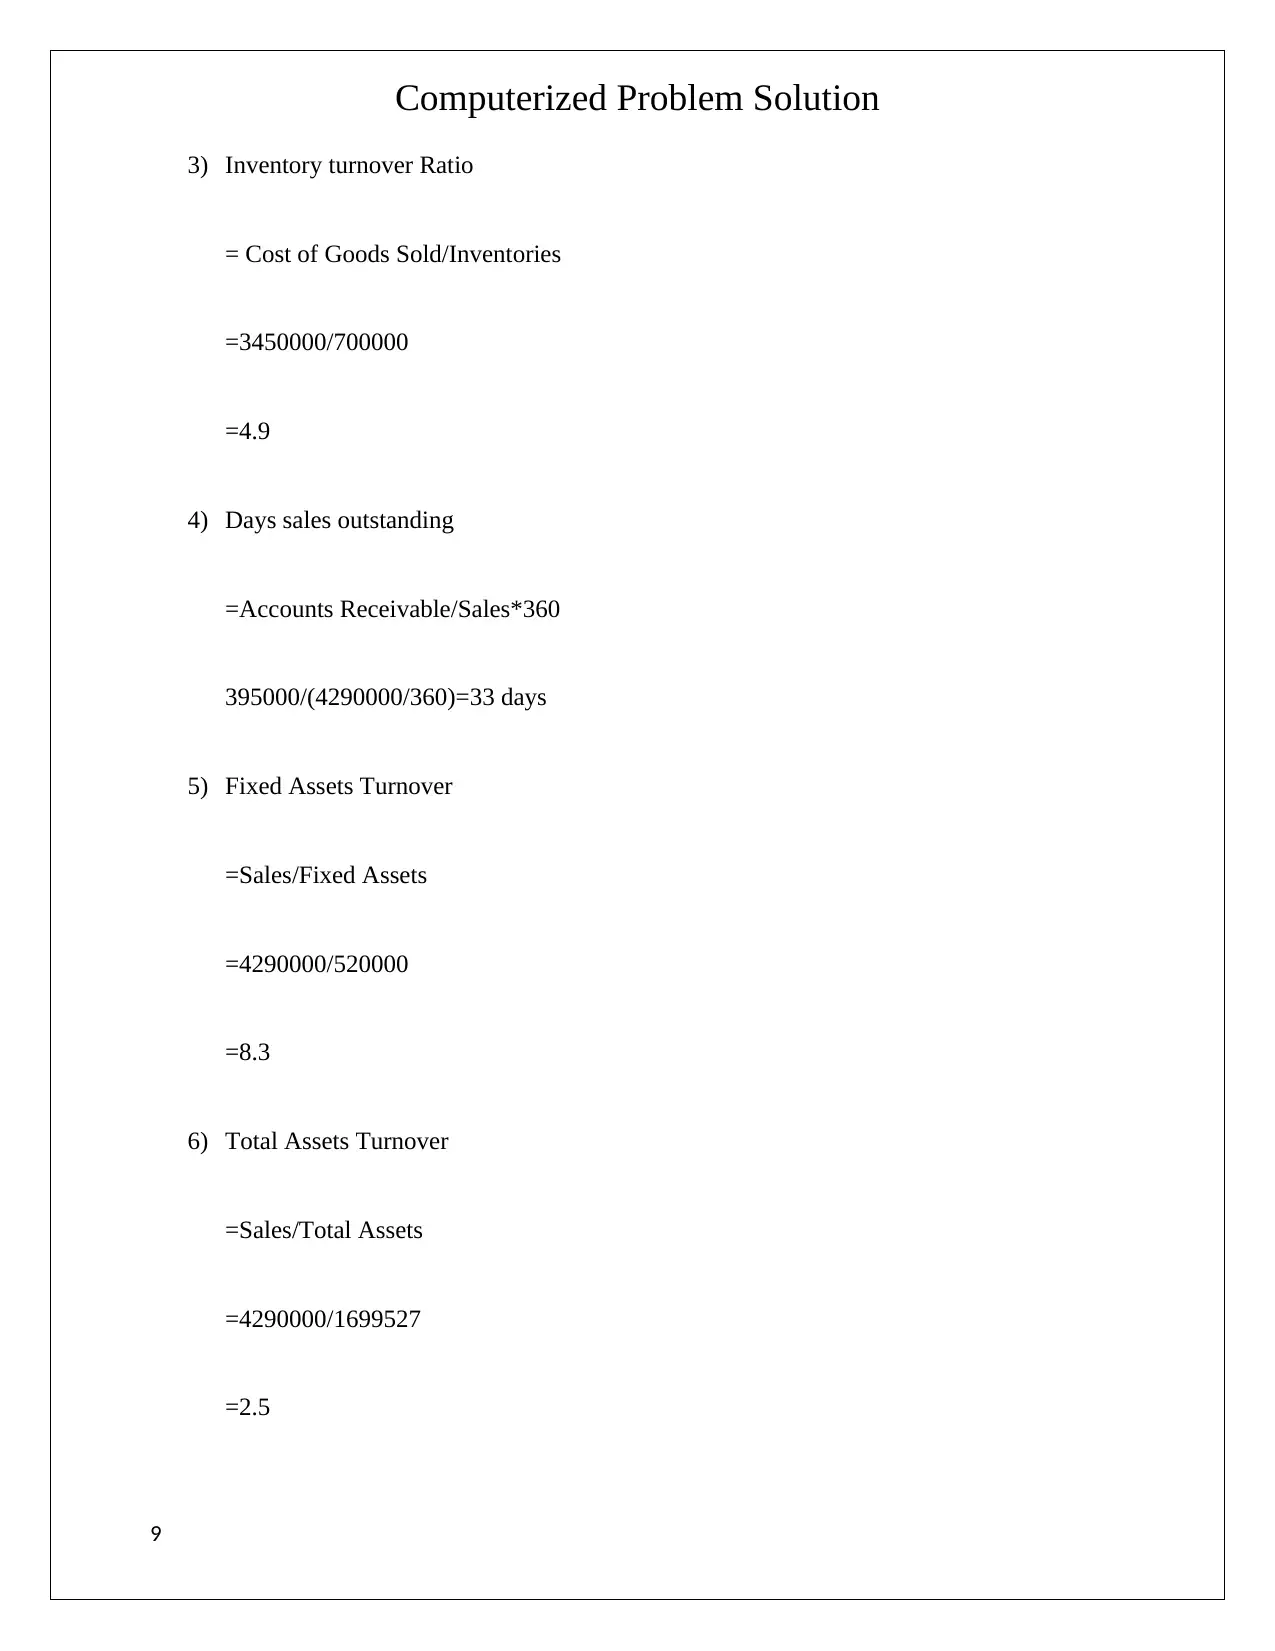
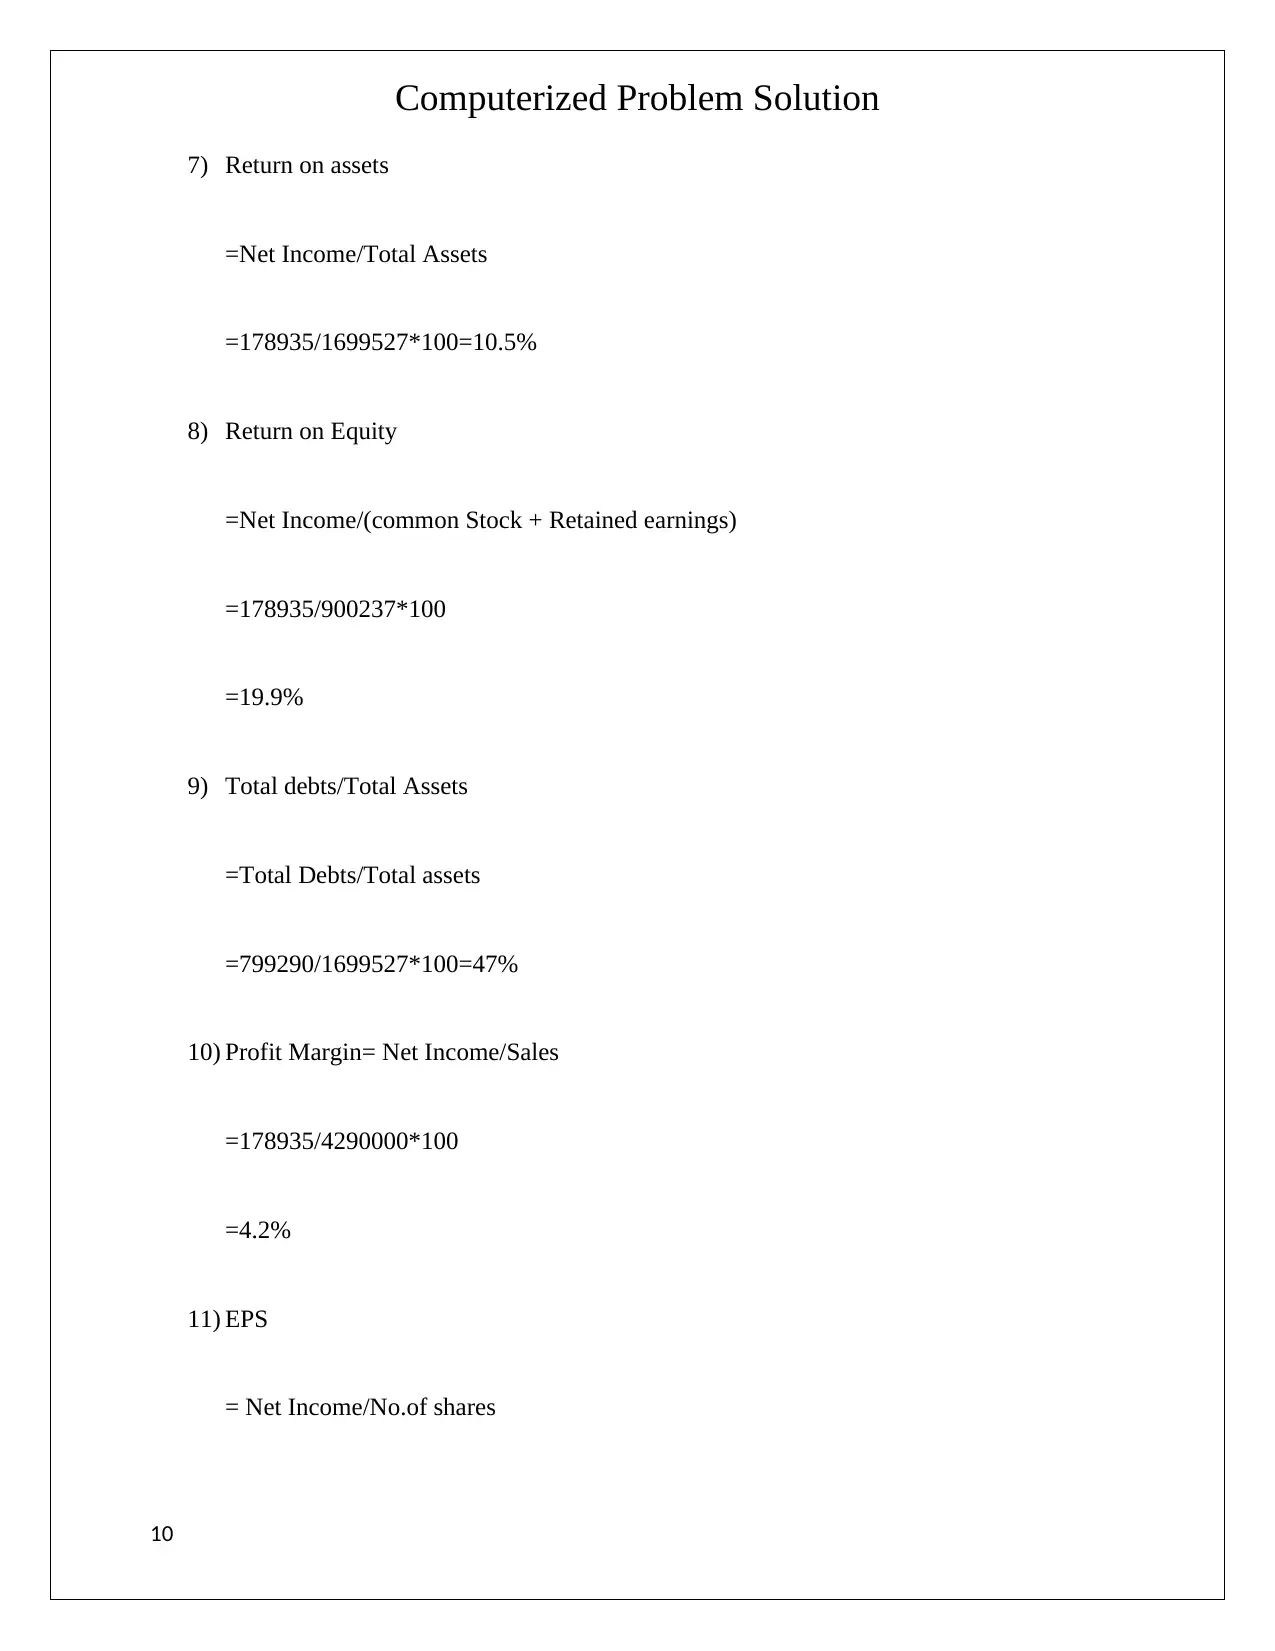
This report presents a detailed ratio analysis of Cary Company, evaluating the impact of a new computer system on its financial performance. The analysis covers various financial ratios, including quick ratio, current ratio, inventory turnover, days sales outstanding, fixed assets turnover, total assets turnover, return on assets (ROA), return on equity (ROE), and total debts to total assets. The report compares the company's financial position before and after the system implementation, highlighting changes in key metrics and their implications. It also considers scenarios where the system's efficiency is enhanced or diminished, and the corresponding effects on the company's income, liquidity, and profitability. Furthermore, the report provides the calculation of each ratio and concludes with recommendations regarding the system purchase. The report emphasizes the importance of financial ratios in assessing a company's financial health and making informed decisions. The report is submitted to Desklib, a platform providing AI-based study tools and past papers for students.
Document Page
[Type the company name]
Computerized Problem Solution
Ratio Analysis
tabler-icon-diamond-filled.svg

Paraphrase This Document

Need a fresh take? Get an instant paraphrase of this document with our AI Paraphraser
Document Page
Computerized Problem Solution
Tables of Content
Ratio Analysis
Comparison with industry averages
Impact on Financial Position of the company
Calculation of ratios
Impact on ratio of company
Conclusion
2
Document Page
Computerized Problem Solution
A) If the new system is installed , the following data are projected, which have the following
mentioned impact on the Ratios
Quick ratio
Quick Ratio of Cary increases from 0.8 to 1.2, which shows that company as of now have more
ability to meet his current financial obligations with the available quick hands on fund.
Accounts Receivable have decreased from 439000 to 395000, which made available the
resources to pay off the accruals that leads to change in quick ratio from 0.8 to 1.2
Quick Ratio of the industry average is 1, i.e ideal ratio, which shows company have sufficient
leverage against liquidity risk.
Quick Ratio of Cary before new system installed was 0.8 which shows that company has taken
much risk by not maintaining an appropriate buffer of liquid resources.
With the change in system Quick Ratio increases and the higher quick ratio indicates that the
company have too much spare cash, it may consider investing the surplus in new ventures and
in case company is out of investment it may provide more return to shareholders.
3
Document Page
Computerized Problem Solution
Current Ratio
Current Ratio with the change in system increases to 3 which is more than the industry average
i.e 2.7 which shows company have more ability to pay off its debt and obligations compare to
competitive industries in the market as it have large proportion to asset to its liabilities.
Inventory turnover Ratio
Inventory Turnover ratio measures how fast a company is selling inventory. A low inventory
ratio implies a weak sales and therefore excess inventory. A high ratio implies strong sales or
/and large discounts.
With the change in system , inventory ration increases from 4 to 4.9 , which shows that there is
increase in sales , inventory in hand has been reduced . But as compared to industry average
inventory ratio is still not to mark which show a ideal turnover. As per the industry average,
inventory turnover ratio is 5.8. As against to it, even after adoption of new system , turnover ratio
of 4.9 is met, which shows much more sales or marketing effort is to be taken, which leads to
less inventory in hand.
DAYS SALES OUTSTANDING
DSO is a average number of days a company take to collect revenue after sales is made.
CARY average number of days collection after sales made is reduced to 33 from 37 which show
a positive impact that average sales collection is made in 33 days which is too nearby to industry
average i.e 32. With comparison to industry average it can be depicted that still company need to
collect payment quickly otherwise it will face problem to meet up costs.
4
tabler-icon-diamond-filled.svg

Paraphrase This Document

Need a fresh take? Get an instant paraphrase of this document with our AI Paraphraser
Document Page
Computerized Problem Solution
Fixed Assets Turnover
Fixed turnover ratio shows the ratio of sales to Fixed Assets.
FA Turnover of Cary have reduced to 8.3 from 10, which shows that the company is not utilizing
its fixed assets in a effective manner to achieve it sales target. As against to industry average FA
ratio is declining which shows that the management has to improve its efficient to meet up the
target.
TA Turnover
Asset turnover ratio is an efficiency that measures company ability to generate sales from its
assets by comparing net sales with average total assets.
With the adoption of new system Assets turnover ratio have increased to 2.5 from 2.3 which
shows an improvement in efficiency but which is not at par with industry average which shows
that still there is a scope of improvement in efficiency to generate sales from assets as compare
to industry average
Return On Assets With the adoption of new system, ROA is increased from 5.9 to 10.5, which
shows the management efficiency to utilize assets to generate earnings, . The Higher the ROA
means company is generating more earning in less investment. Increase in ROA shows the
positive impact of earnings of the company. With the comparison to industry average, company
seems to be competitive in earning factor with the industry.
ROE
5
Document Page
Computerized Problem Solution
ROE is the amount of net income returned as a percentage of shareholders equity. ROE increased
from 13.2 to 19.9 % which shows that a new system installed is increasing the company earning
capacity without much need of investing any new capital. As compare to industry average
company Return on Equity is higher which indicates company is able to give more return on
investment in the market as compared to other companies in industries
Total Debts to Total Assets
Total Debts to Total Assets ratio decline to 47% from 54.8 which shows the decrease in debt
obligations, and as compared to industry average ratio of 50% , it shows low financial risk as
compare to other industries.
B) If the new computer system were even more efficient , it tends to decrease the costs of
good sold by $125000 from the projections, the following will be the impact on the company
financial position.
Firstly the net income of the company Will increase from $178,935 to 2, 53935 i.e by 125000.
Increase in net income leads to increase in quick ratio , current ratio which show good short
term financial strength. Inventory turnover ratio will decline by 0.1 which depicts there will be
increase in inventory in hand. Higher ROA and ROE increase the management ability to earn
return on income, shareholders return on equity will increase, EPS price increase, profitability of
the company overall increase. Total debt to total assets ratio decrease shows that there will be
less financial risk as lower the ratio , lower the degree of leverage ,investors will be attracted to
6
Document Page
Computerized Problem Solution
invest in companies. In an overall company’s financial position with new computer system
became strong and financially competitive in the market
C) If the new computer system, increase the costs of goods sold by $ 125000 , the company
income will decline by $125000 and there will be the opposite effect as mentioned below
Increase in Costs of goods sold leads to decline in Quick ratio from 1.2 to 1 and current
ratio from 3 to 2.8 which shows company have less fund available to meet it liquidity
requirement. In turn Inventory turnover increases which depicts increase in inventory in
hand. Return on assets also decline which shows management inability to utilize the
available assets efficiently to achieve sales and which in turn have impact on return on
equity i.e return on shares is reduced . Therefore by adoption of new system if there is
increase in cost of good sold management should not make decision to buy the new
computer system
D) Now depicting the effects of each item on the financial position of the company
1) If there is a decrease in inventory in hand , it will leads to increase in quick ratio , with
the same there is increase in inventory ratio which there is a increase in sales. There will be the
same impact on increase in currents assets on the financial statements of the company. Vice
versa if there is increase in inventory in hand or other current assets.
2) If there is decrease in debt obligation s i.e account payable or accruals there will be a
impact on current ratio, which shows more assets available as compare to liabilities on
company. TA turnover and ROE will improve that show company is more efficient to get sales
by utilizing it assets.
7
tabler-icon-diamond-filled.svg

Paraphrase This Document

Need a fresh take? Get an instant paraphrase of this document with our AI Paraphraser
Document Page
Computerized Problem Solution
Conclusion-
As from this comparison we can conclude if the new computer system is to be purchase, if it
leads to decline in cost of good sold and moreover lead to increase in sales and generation of net
income. Generation of additional income leads to pay off debts on time which leads to decrease
in liabilities, inventory in hand. Accounts are settled on time, pay off days from receivable
reduces. These effects on financial position of the company indicate positive and the decision to
purchase the computer system should be made.
Appendix
Calculation of Revised ratios
1) Quick ratio=(Cash+Marketable Securities+ Accounts Receivable)/Current Liabilities
=(84527+395000)/(275000+120000)
= 1.2
2) Current Ratio = Current Assets/Current Liabilities
=Cash + Account Receivables+ Inventories/Acct Payable+ Accruals
=(84527+395000+700000)/(275000+120000)
=3
8
Document Page
Computerized Problem Solution
3) Inventory turnover Ratio
= Cost of Goods Sold/Inventories
=3450000/700000
=4.9
4) Days sales outstanding
=Accounts Receivable/Sales*360
395000/(4290000/360)=33 days
5) Fixed Assets Turnover
=Sales/Fixed Assets
=4290000/520000
=8.3
6) Total Assets Turnover
=Sales/Total Assets
=4290000/1699527
=2.5
9
Document Page
Computerized Problem Solution
7) Return on assets
=Net Income/Total Assets
=178935/1699527*100=10.5%
8) Return on Equity
=Net Income/(common Stock + Retained earnings)
=178935/900237*100
=19.9%
9) Total debts/Total Assets
=Total Debts/Total assets
=799290/1699527*100=47%
10) Profit Margin= Net Income/Sales
=178935/4290000*100
=4.2%
11) EPS
= Net Income/No.of shares
10
tabler-icon-diamond-filled.svg

Paraphrase This Document

Need a fresh take? Get an instant paraphrase of this document with our AI Paraphraser
Document Page
Computerized Problem Solution
= 178935/23000
=$7.78
11
chevron_up_icon
1 out of 11
circle_padding
hide_on_mobile
zoom_out_icon
[object Object]