Individual Report: Casa Holdings Ltd Performance Analysis (Finance)
VerifiedAdded on 2020/01/28
|25
|4122
|50
Report
AI Summary
This individual report provides a comprehensive analysis of Casa Holdings Ltd's financial performance and operations over a five-year period (2012-2016). The report begins with an introduction to the company, which specializes in home and cooking appliances, followed by horizontal and vertical analyses of its financial statements. It examines key financial ratios, including profitability (gross margin, operating profit margin, net margin, ROA, and ROE), dividend ratios (DPS and EPS), stability and liquidity (current ratio, quick ratio, and debt-equity ratio), and efficiency (asset turnover, debtor turnover, creditor turnover, and inventory turnover). The analysis incorporates economic conditions in Singapore, business news, and the roles of the Board of Directors. The report concludes with an assessment of the company's financial health and recommendations for investors. The appendices contain horizontal and vertical analyses of the Profit & Loss and Balance Sheet statements.
Individual report analysing the performance and operations of
a public listed company
1
a public listed company
1
Paraphrase This Document
Need a fresh take? Get an instant paraphrase of this document with our AI Paraphraser
Table of Contents
INTRODUCTION................................................................................................................................5
SECTION A..........................................................................................................................................5
1. Company selection........................................................................................................................5
2. Introduction of company...............................................................................................................5
3. Horizontal & vertical analysis of Casa Holdings Ltd for five consecutive years.........................5
4. (A). Economic conditions.............................................................................................................6
(B) & (C) Profitability performance.................................................................................................6
5 Dividend ratios...............................................................................................................................7
6. Stability and Liquidity................................................................................................................10
7. Efficiency performance..............................................................................................................13
SECTION B........................................................................................................................................14
1 & 2. Business news and its impact on Casa Holdings Ltd..........................................................14
3. Board of Director’s team and their roles....................................................................................14
4. Comparison of Net asset value per share from current price level.............................................15
4. CONCLUSION..............................................................................................................................16
REFERENCES...................................................................................................................................18
APPendix............................................................................................................................................20
Appendix 2. Horizontal P&L..........................................................................................................23
Appendix: 3. Horizontal balance sheet...........................................................................................24
Appendix: 4. Vertical P&L.............................................................................................................25
2
Appendix: 5. Vertical balance sheet................................................................................................25
3
3
⊘ This is a preview!⊘
Do you want full access?
Subscribe today to unlock all pages.
Trusted by 1+ million students worldwide
Figure 1: DPS................................................................................................................................................................................................................8
Figure 2: EPS................................................................................................................................................................................................................9
Figure 3: Current ratio.................................................................................................................................................................................................10
Figure 4: Quick ratio...................................................................................................................................................................................................11
Figure 5: Debt-equity ratio..........................................................................................................................................................................................12
4
Paraphrase This Document
Need a fresh take? Get an instant paraphrase of this document with our AI Paraphraser
INTRODUCTION
With the changing era, companies are require to evaluate their performance on a consistent basis to determine that whether they have
brought any improvement in their performance or not. Casa Holdings Ltd is a public limited company of Singapore that delivers various home
and cooking equipments to global customers. The present project report aims at examining the performance of the business for recent five
financial years through ratio analysis, horizontal and vertical analysis as well. It will examine firm’s profitability performance and financial
health through comparing solvency, liquidity and efficiency ratios. On the basis of such analysis, investor will be advised that whether to invest
or not in Casa Holdings Ltd.
SECTION A
1. Company selection
Casa Holdings Ltd
2. Introduction of company
Casa Holdings Ltd specializes in manufacturing and distribution of different types of home and cooking appliances such as bathroom and
kitchen fixtures, ventilating system, drying machines, air-conditioning and many others. It is a public listed organization which was incorporated
in the year 1994 and begun operations in 1976. Its product portfolio consists of three major products that are consumer electronic goods, home
appliances and bathroom fixtures. EF, ELBA, CHATEAU, BLOMBERG, BEKO FERIOLI is the top-most brand of the company that is
preferable by the larger number of customers and meet their demand. It operates at different locations such as Singapore, China, Malaysia,
Morocco and other countries of the world. This project report will shed light on the stability, liquidity, profitability and financial status of the firm
for five years ranging from 2012 to 2015 through computing ratios.
3. Horizontal & vertical analysis of Casa Holdings Ltd for five consecutive years
Refer to Appendix 2, 3, 4 & 5.
5
Taking into account the results, it can be seen that during the period of 5 years, Casa’s revenues shows a negative trend as in 2014, 2015
and 2016, it came down by 3.23%, 40% and 5.56% respectively. It is the reason behind declined gross return of the firm. Change in society’s
preferences, taste and attitude, substitute project, inflated product prices, high level of competition, substitute product availability are the reason
behind decreased revenues. However, on the other side, SG&A expenditures got improved in 2014 by 20% however, in 2015, it dropped down to
25% is a sign of better control over cost. At the end of the year 2016, Casa holding’s net profitability just doubled and came to 8 SGD million.
While, on the other hand, if we look cost percentage of sales then it shows moderate fluctuations as in 2012, it was 61.29% resulted down to
58.82% in 2016.
While, on the other hand, looking at the balance sheet figures, it can be observed that total current assets shows rising trend as it got
increased from 41.94% to 56.30% in 2015 but in 2016, it resulted down to 52.55%. However, non-current assets also shows downward trend and
came down from 58.06% to 47.45%. Fluctations in accounts payable, tax payable & short-term capital lease shows a volatile trend in current
liabilities as in 2012, it was reported to 14.52% of total assets got improved to 23.56% in the end of the period whereas non-current liabilities got
improved from 28.47% to 32.59% in 2015 due to more borrowed funds but in 2016, it dropped down to 24.09%.
4. (A). Economic conditions
Singapore is considered as wealthiest nations from the perspective of taxation, GDP, per capita income, purchasing power parity, etc. Thus,
the economic condition of Singapore is highly stable, and living of standard of people resides there is also very high. With the rise in disposable
income people prefer to spend money on cooking and home appliances which offer a unique experience to them. Thus, the economic condition
of Singapore will aid in the profit margin of Casa Holdings Ltd to a large extent.
(B) & (C) Profitability performance
In the year 2012, CHL's GM was 38.71% got improved to 43.46% in 2014 and then fallen to 40.83% in 2016. Ineffective control over the cost of
goods sold, high production cost, excessive supplier charges and reduction in turnover were the reasons for the declined gross return indicates
that company's performance has value/number (Kogadeeva and Zamboni, 2016).
Till 2014, operating profit margin (OPM) was near to 6%, however, after this, it shows negative return to 9.44% and 13.02%. Lack of
6
⊘ This is a preview!⊘
Do you want full access?
Subscribe today to unlock all pages.
Trusted by 1+ million students worldwide
managerial control over sales, general and admin expense (SG&A) and less turnover to only 16,850 SGDm are the responsible reasons behind
negative operational income reflects poor business performance.
Net Margin (NM) shows the highly fluctuating trend as in 2012, it was reported to 29.03%, decreased to 15.61% in 2014 and got inclined to
43.33% while in 2016, again dropped down to 0.59%. Huge decrease in turnover due to lowering consumer demand, availability of substitute
products at cheaper rates, competitive pressure and poor control over spending resulted NM downward demonstrates that it is not performed well
in this year (Tsai and et.al., 2016).
Return on assets dropped down from 14.52% to 0.07% in the year 2016 indicates that yield percentage on total assets employed by CHL
has been reduced. Less net earnings because of overspending and poor revenues and rising corporate assets had decreased ROA shows that CHL
obtained less return on their total business assets.
ROE shows a consistent decline as it got declined from 16.98% to 0.13% exhibits that Casa Holdings Ltd acquired lower earnings on their
total shareholder’s equity capital invested in the firm. Fall in net corporate yield and higher collection of money from equity investors declined
the return on equity capital.
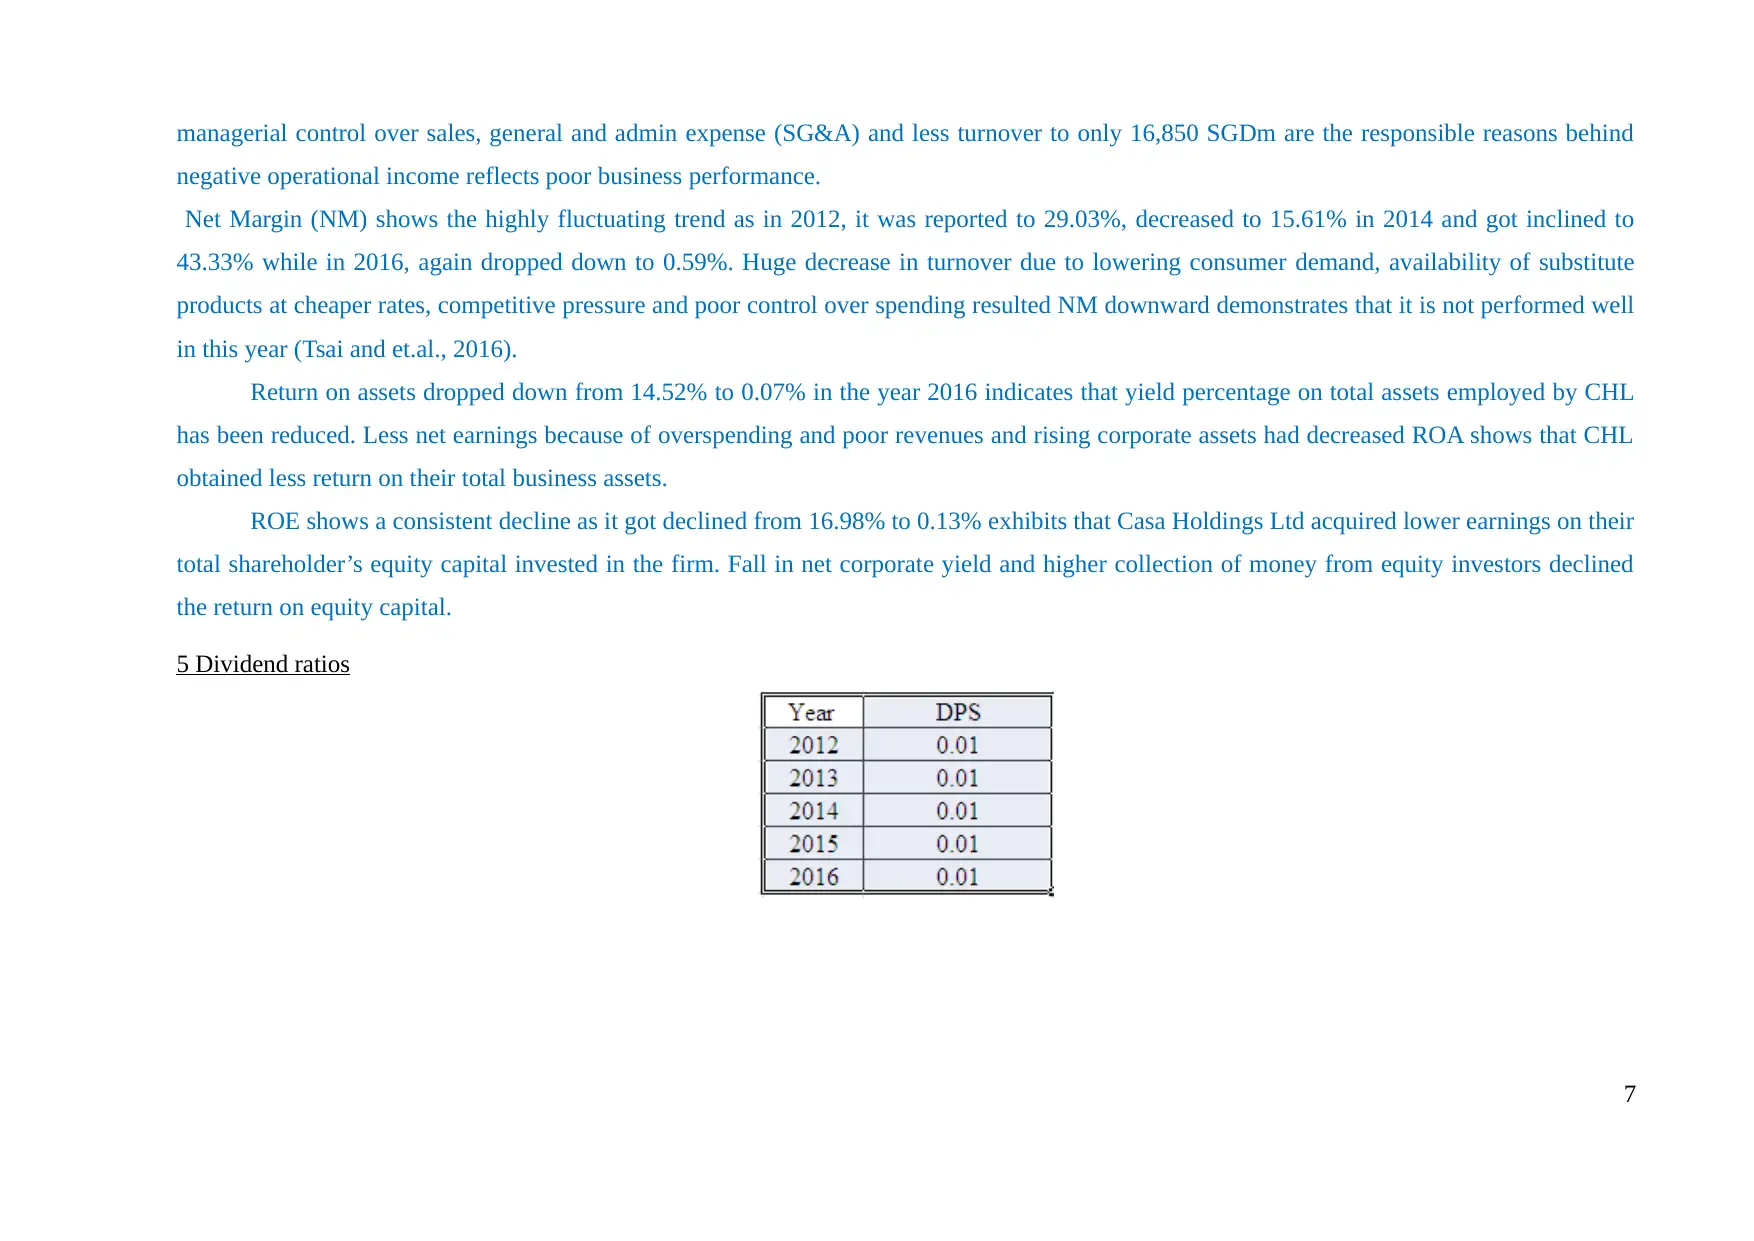
5 Dividend ratios
7
negative operational income reflects poor business performance.
Net Margin (NM) shows the highly fluctuating trend as in 2012, it was reported to 29.03%, decreased to 15.61% in 2014 and got inclined to
43.33% while in 2016, again dropped down to 0.59%. Huge decrease in turnover due to lowering consumer demand, availability of substitute
products at cheaper rates, competitive pressure and poor control over spending resulted NM downward demonstrates that it is not performed well
in this year (Tsai and et.al., 2016).
Return on assets dropped down from 14.52% to 0.07% in the year 2016 indicates that yield percentage on total assets employed by CHL
has been reduced. Less net earnings because of overspending and poor revenues and rising corporate assets had decreased ROA shows that CHL
obtained less return on their total business assets.
ROE shows a consistent decline as it got declined from 16.98% to 0.13% exhibits that Casa Holdings Ltd acquired lower earnings on their
total shareholder’s equity capital invested in the firm. Fall in net corporate yield and higher collection of money from equity investors declined
the return on equity capital.
5 Dividend ratios
7
Paraphrase This Document
Need a fresh take? Get an instant paraphrase of this document with our AI Paraphraser
2012 2013 2014 2015 2016
0
0.002
0.004
0.006
0.008
0.01
0.012
0.01 0.01 0.01 0.01 0.01
DPS
DPS
Figure 1: DPS
8
0
0.002
0.004
0.006
0.008
0.01
0.012
0.01 0.01 0.01 0.01 0.01
DPS
DPS
Figure 1: DPS
8
2012 2013 2014 2015 2016
0
0.01
0.02
0.03
0.04
0.05
0.06
0.04
0.05
0.02
0.04
0
EPS
EPS
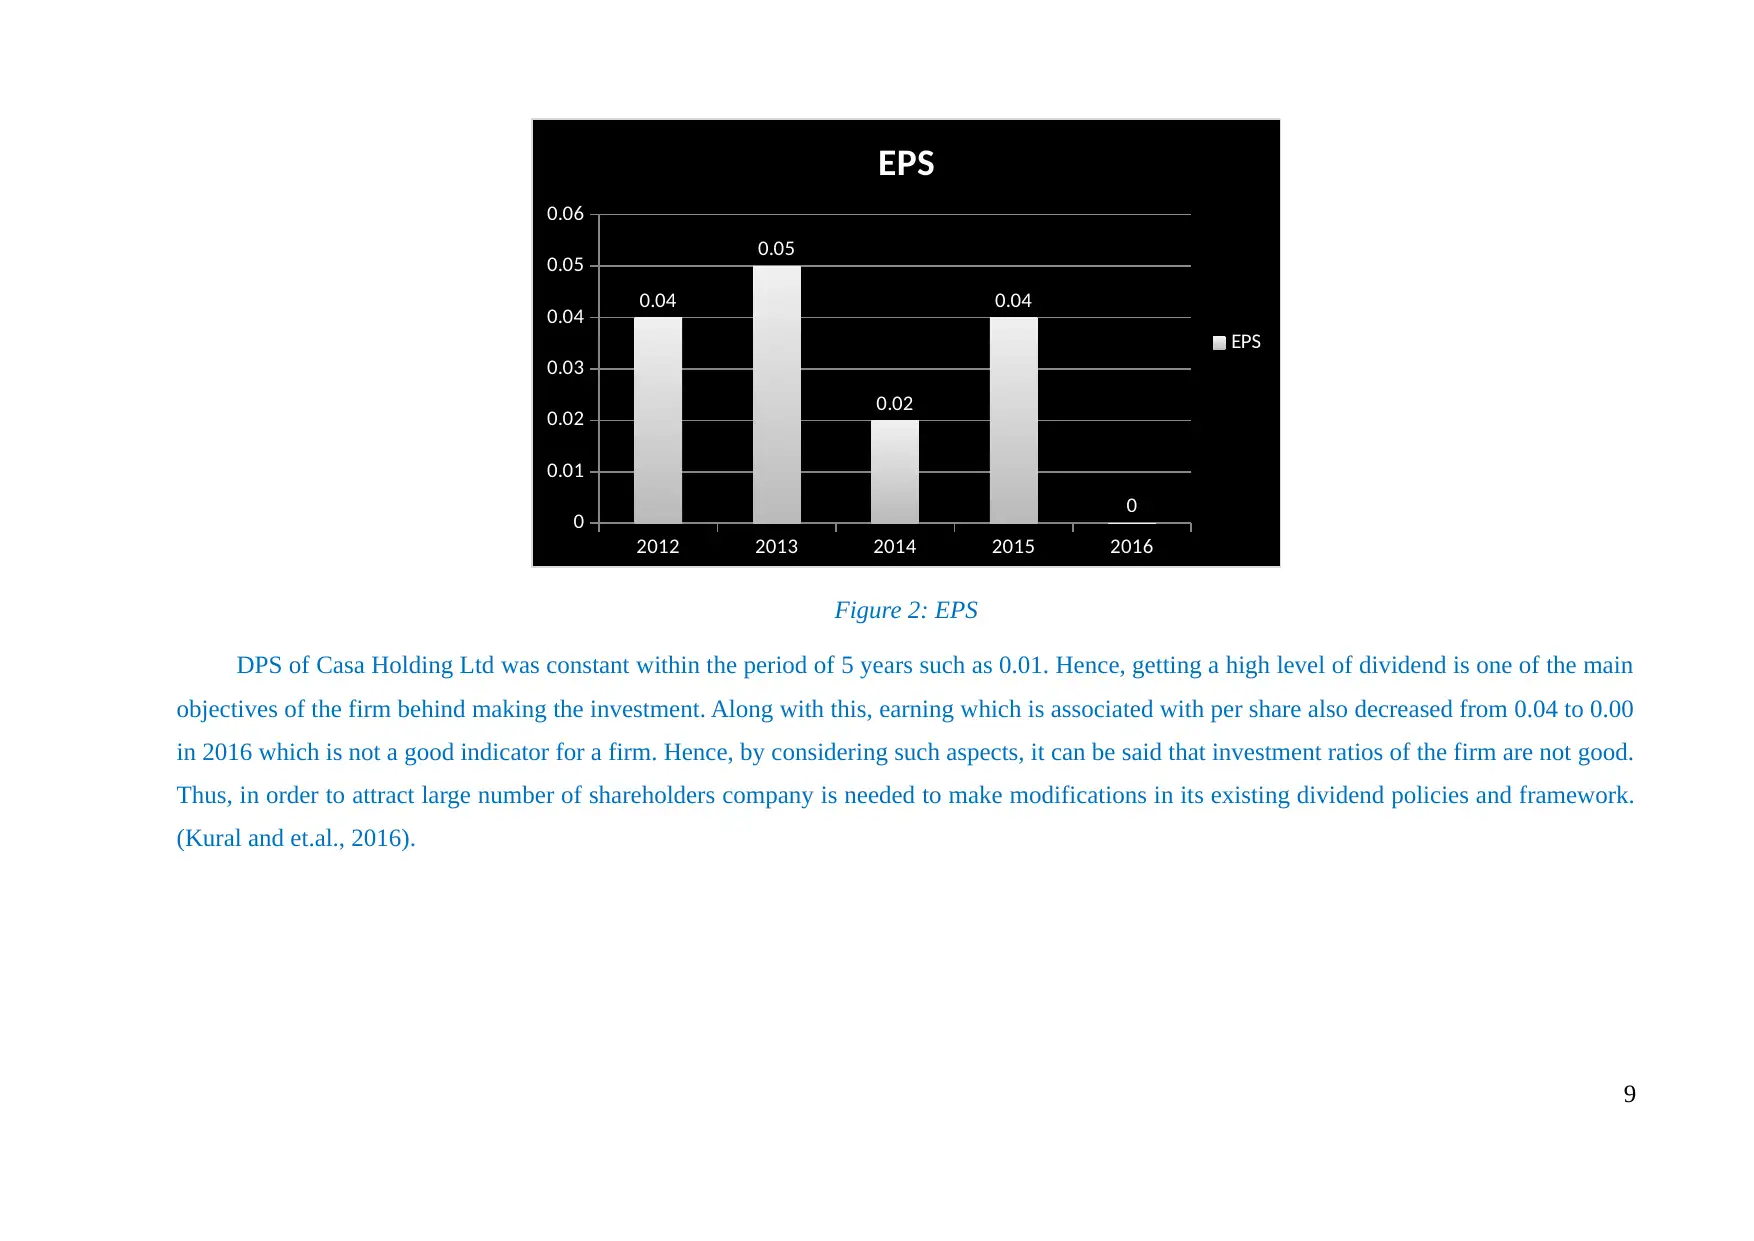
Figure 2: EPS
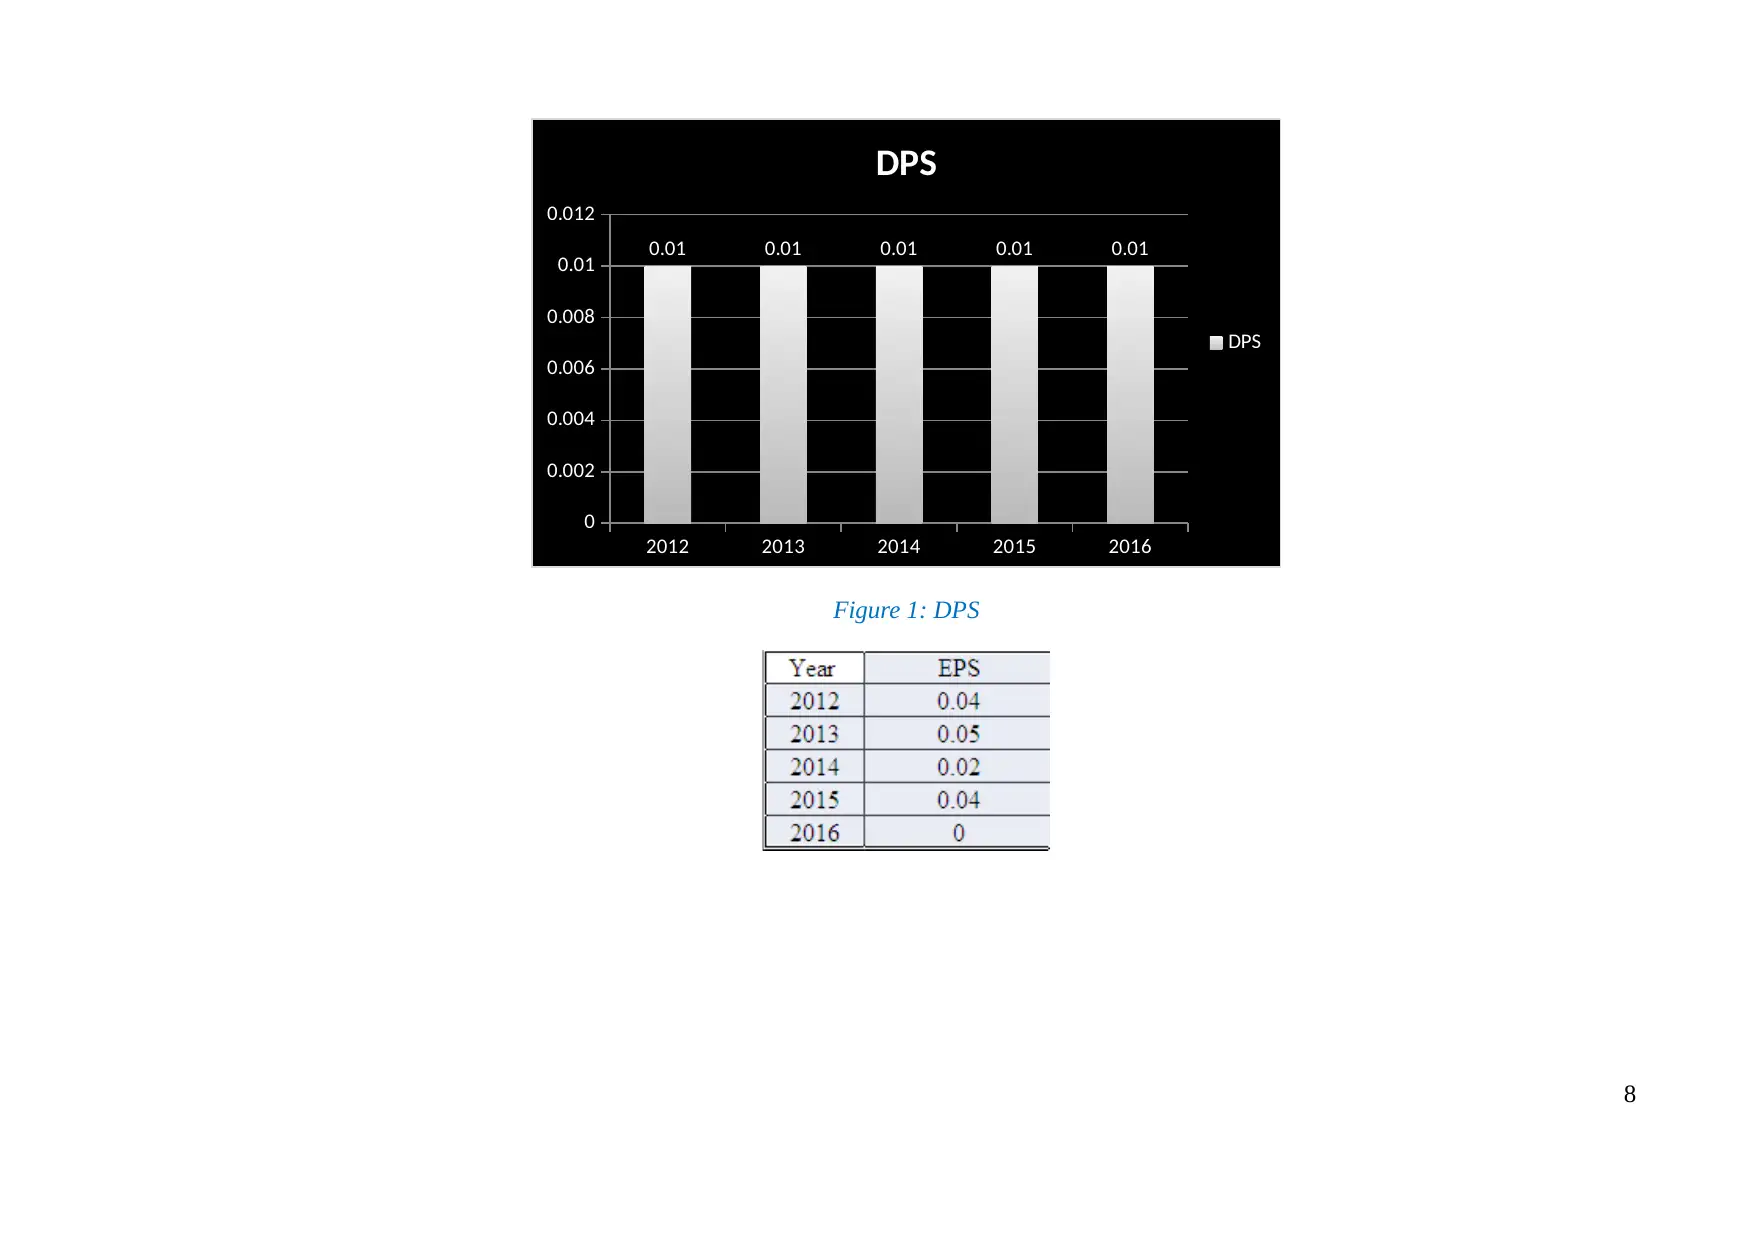
DPS of Casa Holding Ltd was constant within the period of 5 years such as 0.01. Hence, getting a high level of dividend is one of the main
objectives of the firm behind making the investment. Along with this, earning which is associated with per share also decreased from 0.04 to 0.00
in 2016 which is not a good indicator for a firm. Hence, by considering such aspects, it can be said that investment ratios of the firm are not good.
Thus, in order to attract large number of shareholders company is needed to make modifications in its existing dividend policies and framework.
(Kural and et.al., 2016).
9
0
0.01
0.02
0.03
0.04
0.05
0.06
0.04
0.05
0.02
0.04
0
EPS
EPS
Figure 2: EPS
DPS of Casa Holding Ltd was constant within the period of 5 years such as 0.01. Hence, getting a high level of dividend is one of the main
objectives of the firm behind making the investment. Along with this, earning which is associated with per share also decreased from 0.04 to 0.00
in 2016 which is not a good indicator for a firm. Hence, by considering such aspects, it can be said that investment ratios of the firm are not good.
Thus, in order to attract large number of shareholders company is needed to make modifications in its existing dividend policies and framework.
(Kural and et.al., 2016).
9
⊘ This is a preview!⊘
Do you want full access?
Subscribe today to unlock all pages.
Trusted by 1+ million students worldwide
6. Stability and Liquidity
2012 2013 2014 2015 2016
0
0.5
1
1.5
2
2.5
3
3.5
4
3
1.96
2.79
3.8
2.23
CR
CR
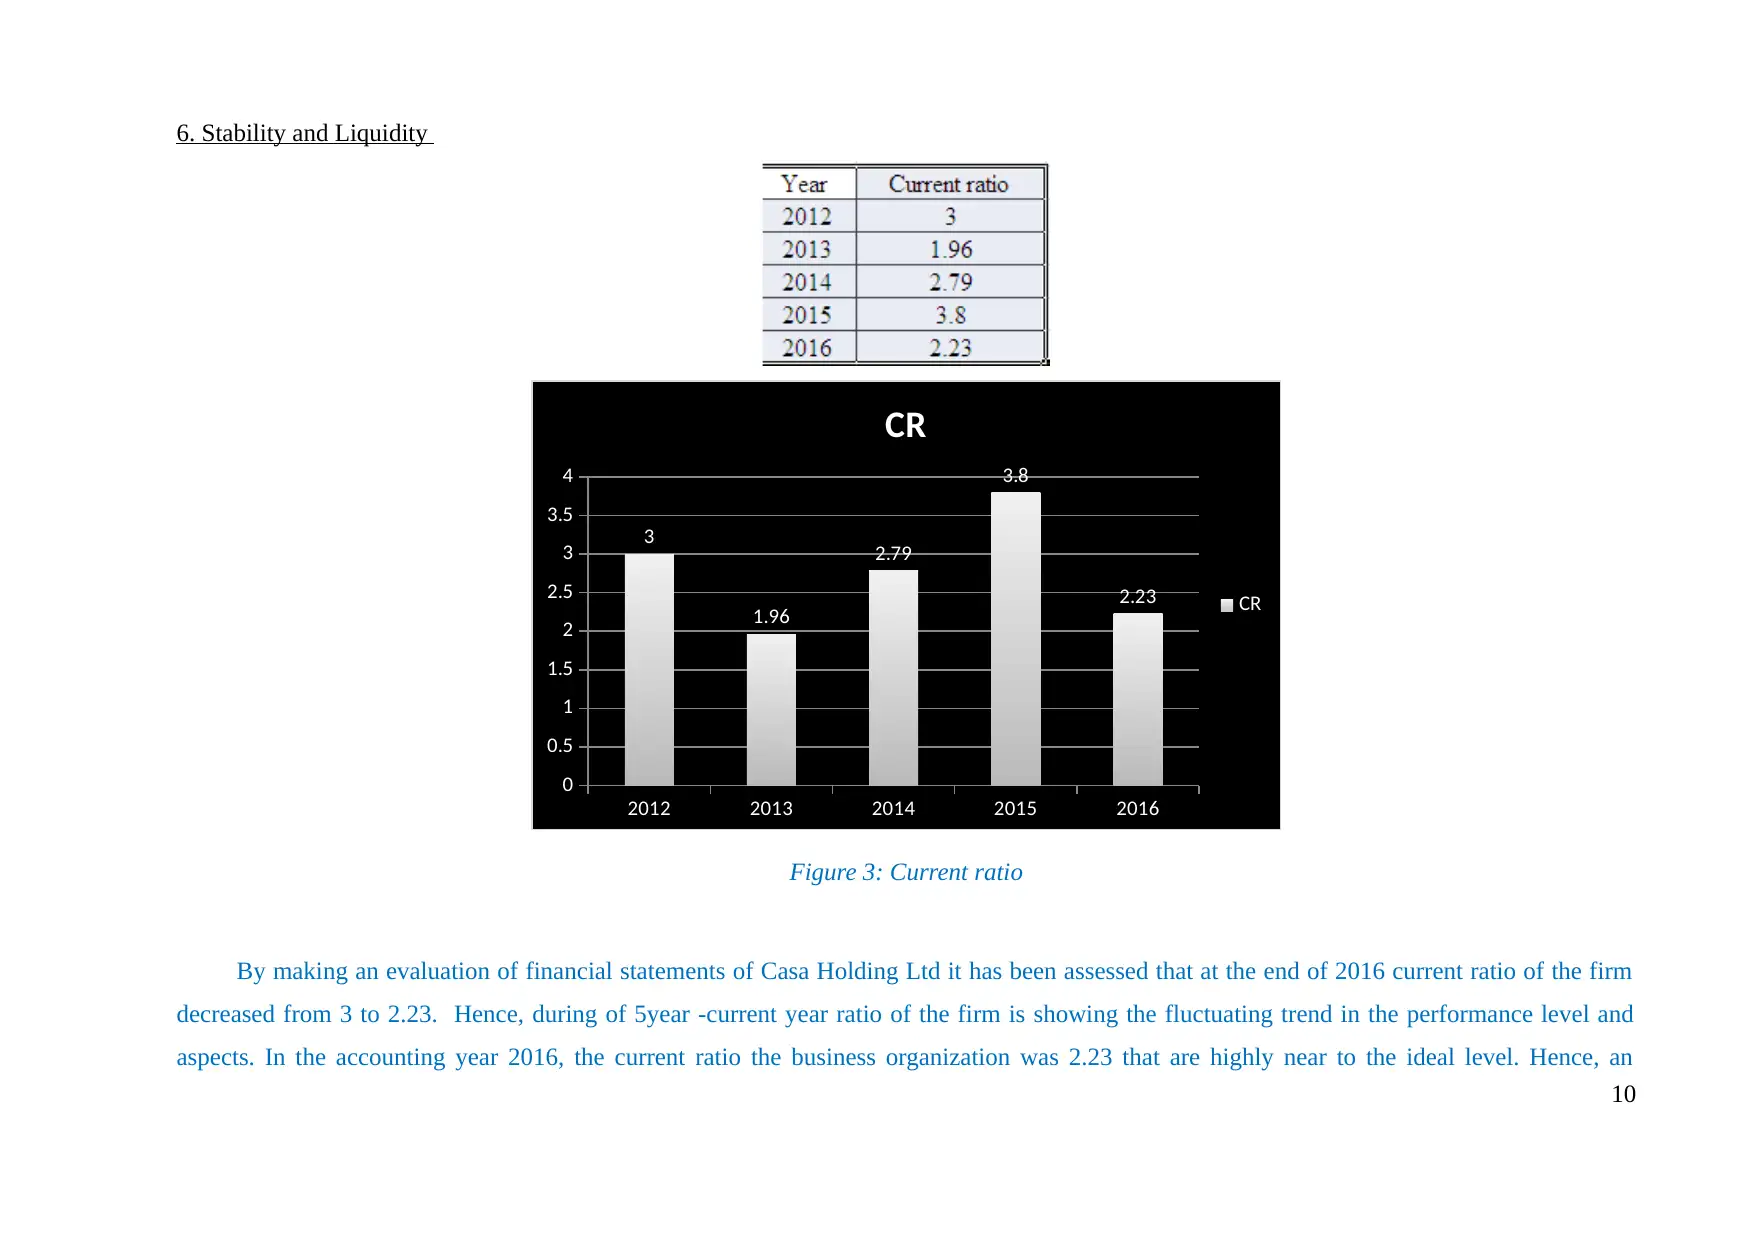
Figure 3: Current ratio
By making an evaluation of financial statements of Casa Holding Ltd it has been assessed that at the end of 2016 current ratio of the firm
decreased from 3 to 2.23. Hence, during of 5year -current year ratio of the firm is showing the fluctuating trend in the performance level and
aspects. In the accounting year 2016, the current ratio the business organization was 2.23 that are highly near to the ideal level. Hence, an
10
2012 2013 2014 2015 2016
0
0.5
1
1.5
2
2.5
3
3.5
4
3
1.96
2.79
3.8
2.23
CR
CR
Figure 3: Current ratio
By making an evaluation of financial statements of Casa Holding Ltd it has been assessed that at the end of 2016 current ratio of the firm
decreased from 3 to 2.23. Hence, during of 5year -current year ratio of the firm is showing the fluctuating trend in the performance level and
aspects. In the accounting year 2016, the current ratio the business organization was 2.23 that are highly near to the ideal level. Hence, an
10
Paraphrase This Document
Need a fresh take? Get an instant paraphrase of this document with our AI Paraphraser
outcome of such ratio clearly presents that business unit has enough current assets to meet the obligations. Casa Holding Ltd has two current
asserts to meet or fulfill one monetary obligation.
2012 2013 2014 2015 2016
0
0.5
1
1.5
2
2.5
3
2.22
1.48
2.55
2.15 2.1
QR
QR
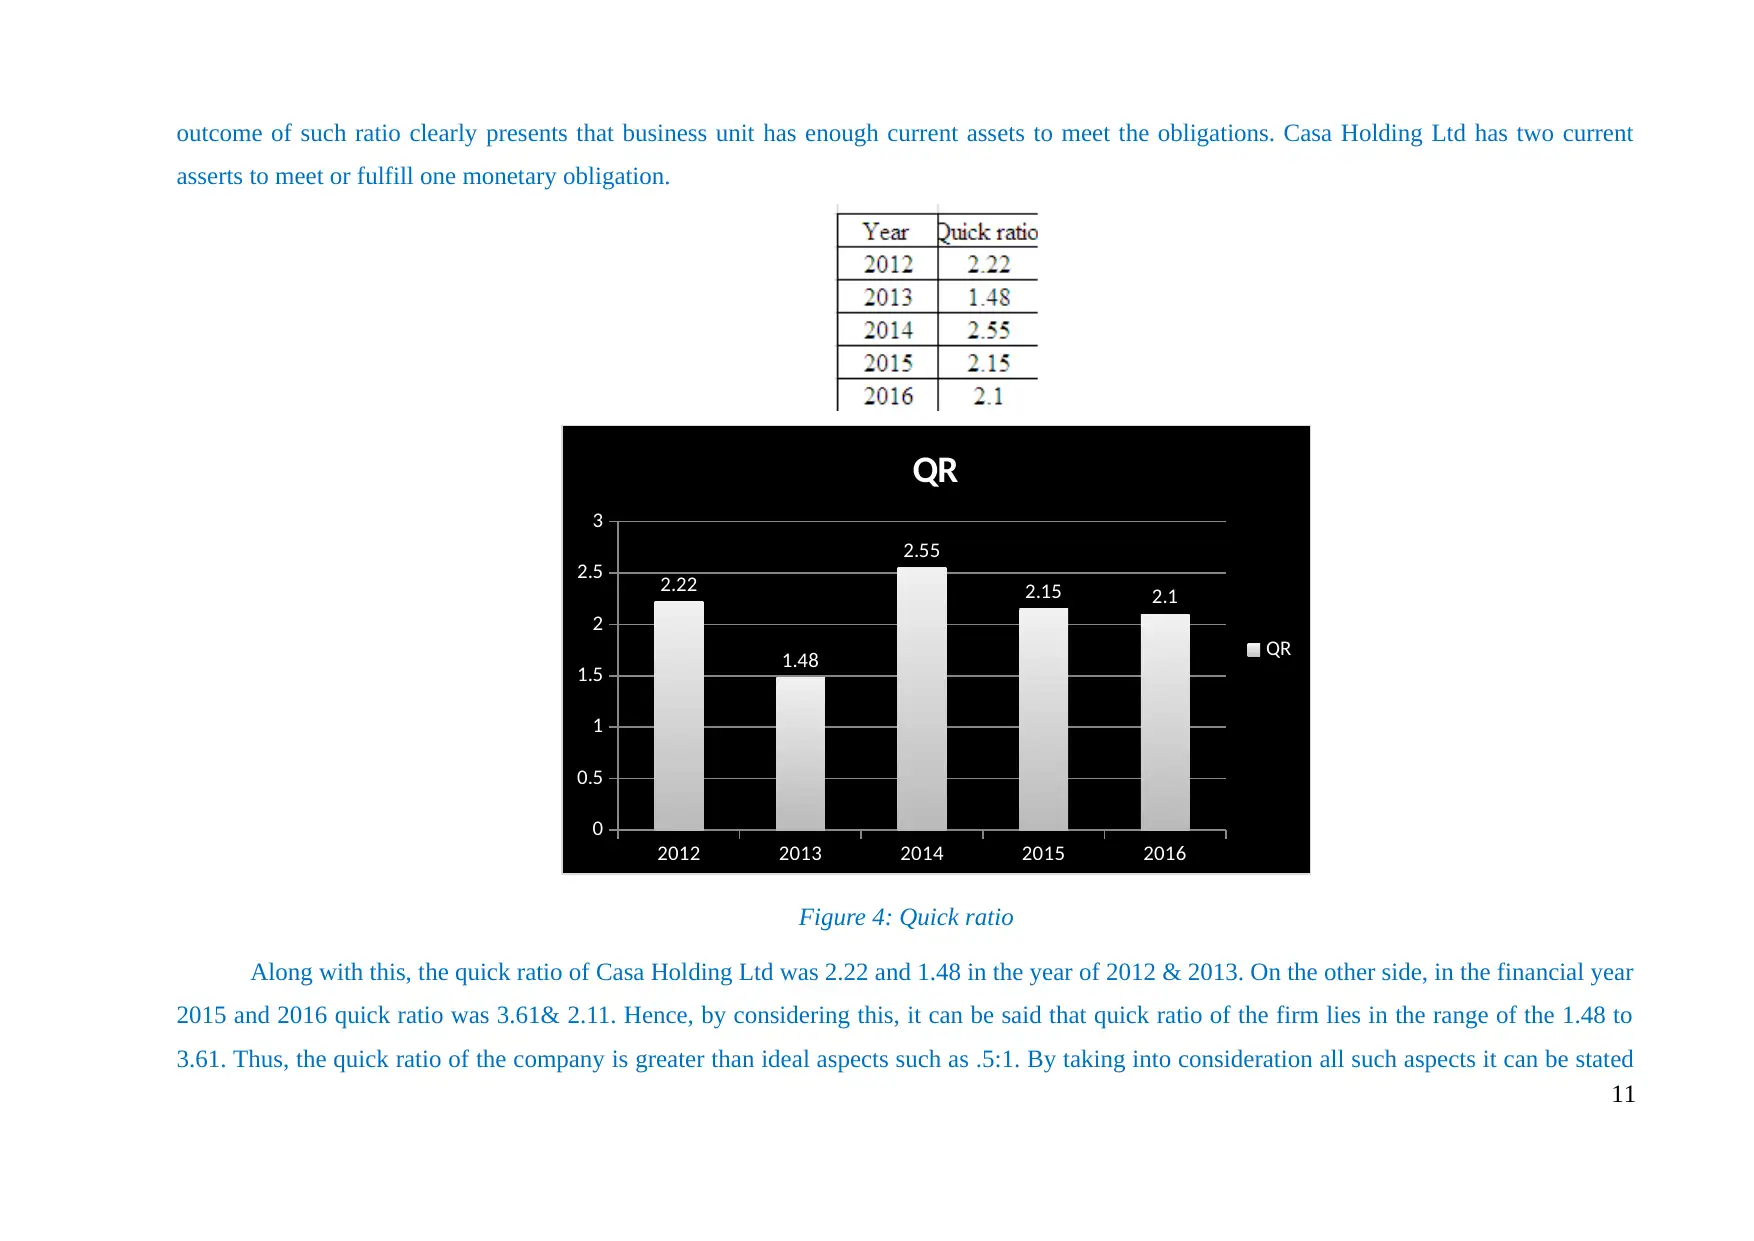
Figure 4: Quick ratio
Along with this, the quick ratio of Casa Holding Ltd was 2.22 and 1.48 in the year of 2012 & 2013. On the other side, in the financial year
2015 and 2016 quick ratio was 3.61& 2.11. Hence, by considering this, it can be said that quick ratio of the firm lies in the range of the 1.48 to
3.61. Thus, the quick ratio of the company is greater than ideal aspects such as .5:1. By taking into consideration all such aspects it can be stated
11
asserts to meet or fulfill one monetary obligation.
2012 2013 2014 2015 2016
0
0.5
1
1.5
2
2.5
3
2.22
1.48
2.55
2.15 2.1
QR
QR
Figure 4: Quick ratio
Along with this, the quick ratio of Casa Holding Ltd was 2.22 and 1.48 in the year of 2012 & 2013. On the other side, in the financial year
2015 and 2016 quick ratio was 3.61& 2.11. Hence, by considering this, it can be said that quick ratio of the firm lies in the range of the 1.48 to
3.61. Thus, the quick ratio of the company is greater than ideal aspects such as .5:1. By taking into consideration all such aspects it can be stated
11
that liquidity position and performance of Casa Holding Ltd is sound. Further, the company needs to make the focus on investing money in other
profitable investment options that make a contribution to the growth and profit margin of it.
2012 2013 2014 2015 2016
0
0.1
0.2
0.3
0.4
0.5
0.6
0.7
0.8
0.9
0.17
0.28
0.78 0.79 0.81
DER
DER
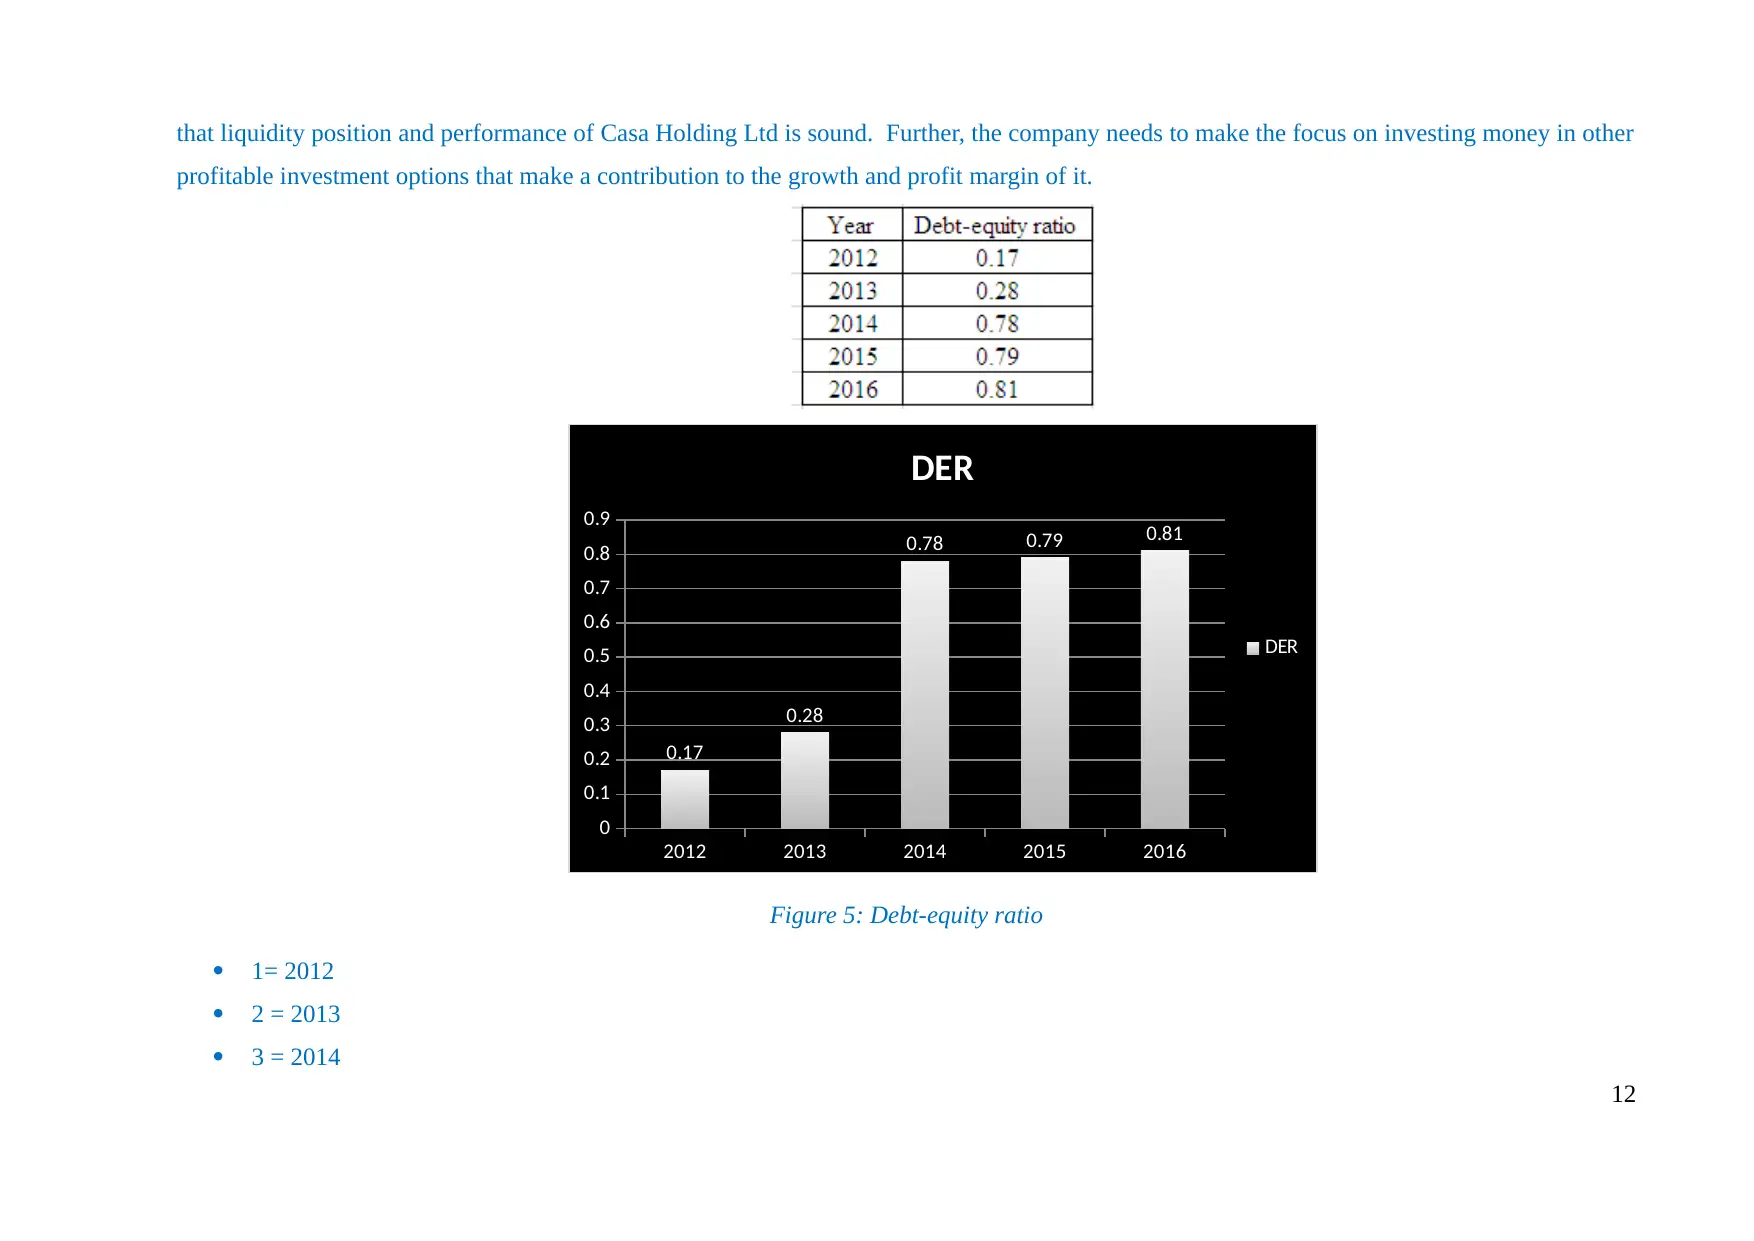
Figure 5: Debt-equity ratio
1= 2012
2 = 2013
3 = 2014
12
profitable investment options that make a contribution to the growth and profit margin of it.
2012 2013 2014 2015 2016
0
0.1
0.2
0.3
0.4
0.5
0.6
0.7
0.8
0.9
0.17
0.28
0.78 0.79 0.81
DER
DER
Figure 5: Debt-equity ratio
1= 2012
2 = 2013
3 = 2014
12
⊘ This is a preview!⊘
Do you want full access?
Subscribe today to unlock all pages.
Trusted by 1+ million students worldwide
1 out of 25
Related Documents


Your All-in-One AI-Powered Toolkit for Academic Success.
+13062052269
info@desklib.com
Available 24*7 on WhatsApp / Email
![[object Object]](/_next/static/media/star-bottom.7253800d.svg)
Unlock your academic potential
Copyright © 2020–2026 A2Z Services. All Rights Reserved. Developed and managed by ZUCOL.