ACCT2077 Cash Flow Analysis: JB Hi-Fi vs Harvey Norman

Verified

Added on  2019/11/19

|8
|1460
|147
Case Study
AI Summary
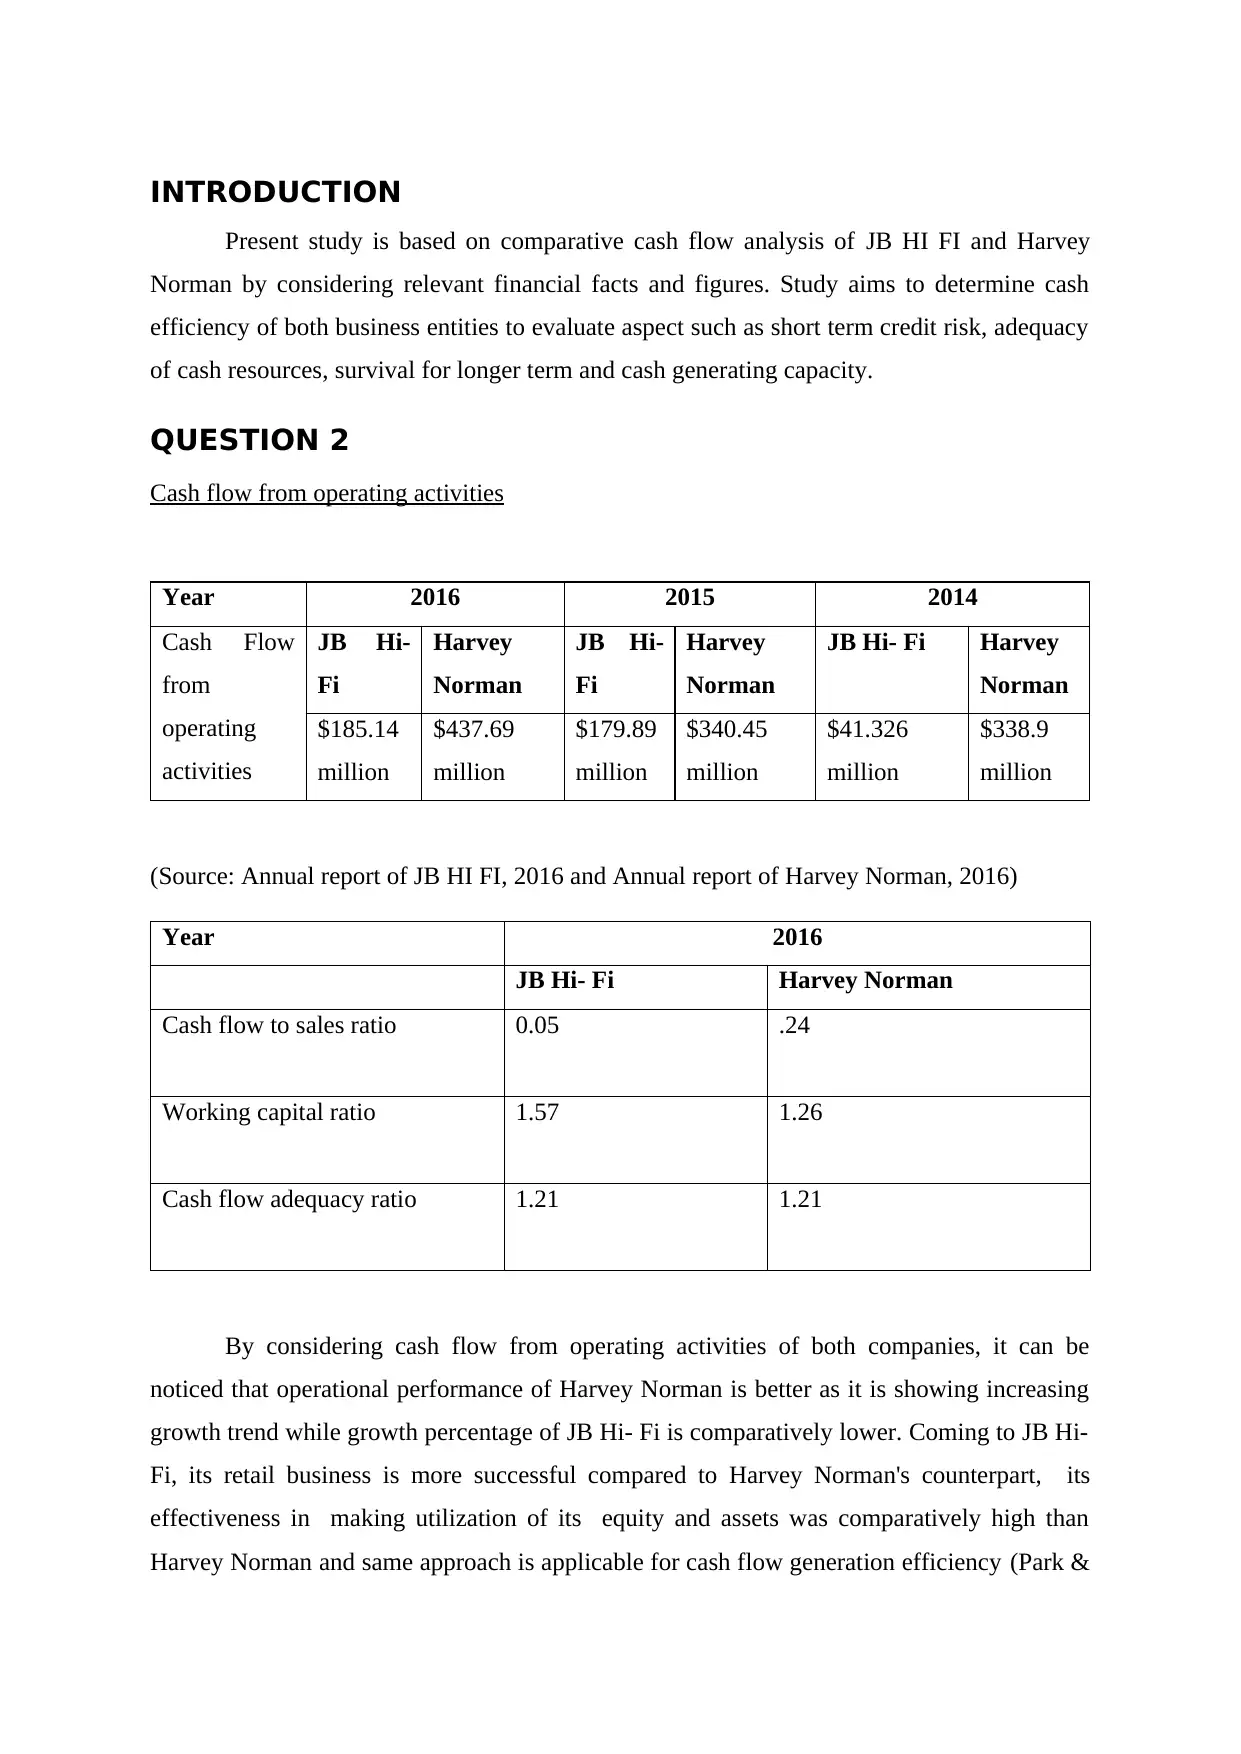
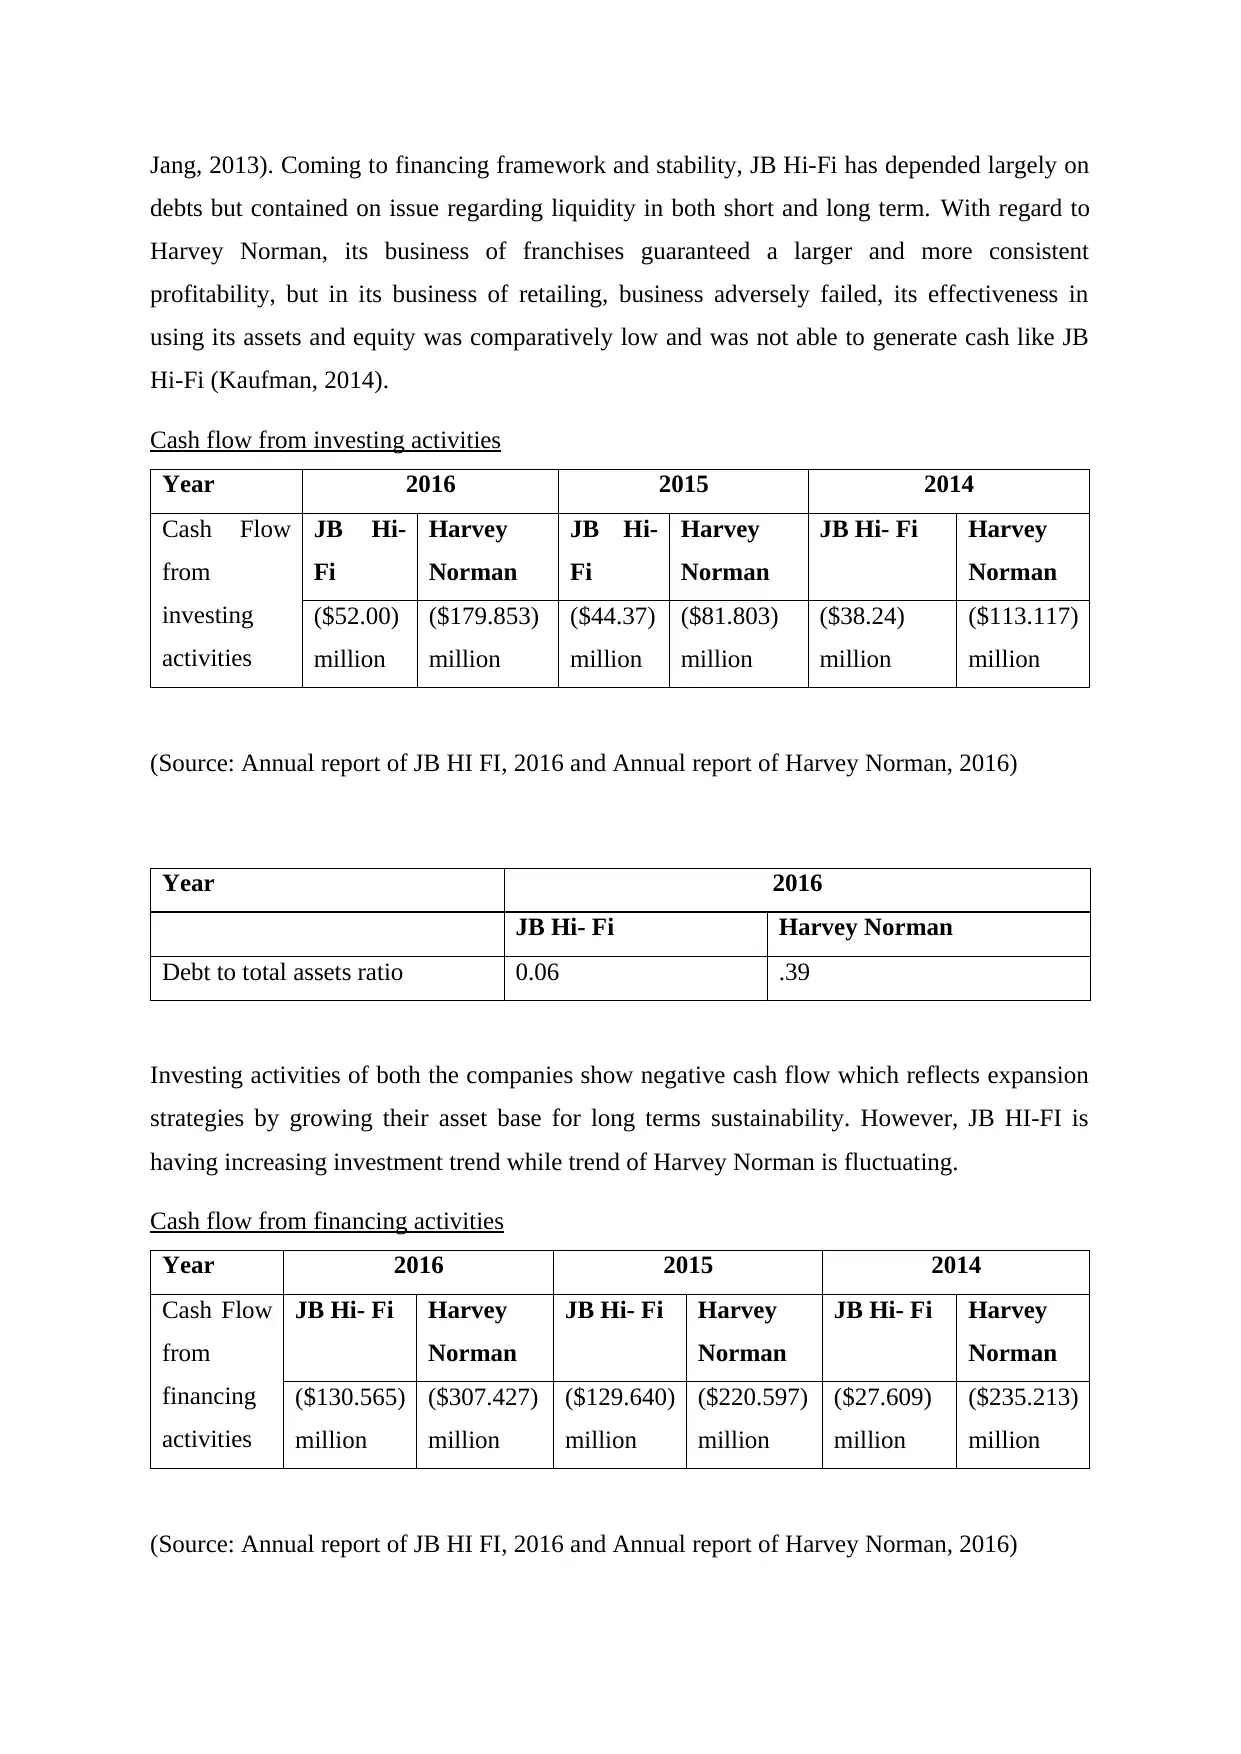
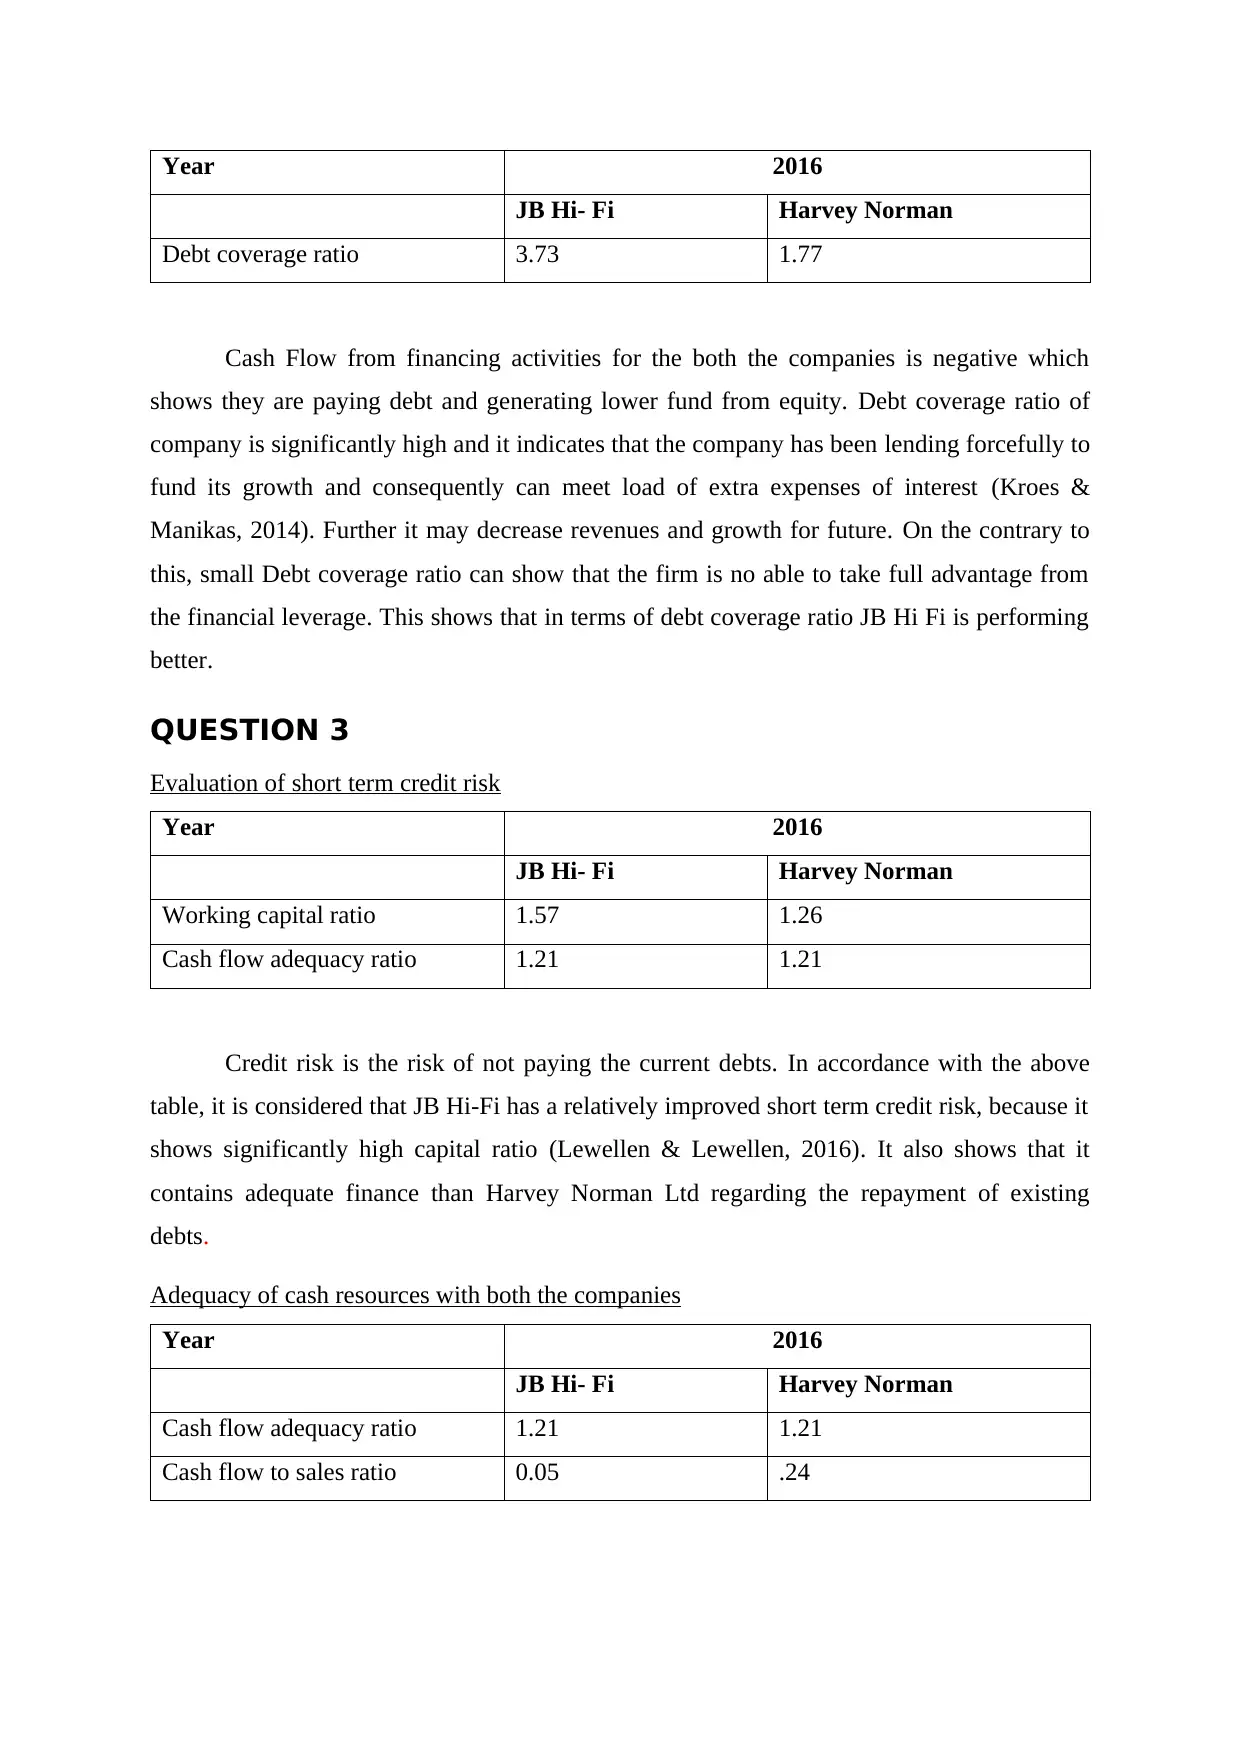
This case study provides a comparative cash flow analysis of JB Hi-Fi and Harvey Norman, examining their financial performance from 2014 to 2016. The analysis includes cash flow from operating, investing, and financing activities, along with key financial ratios such as working capital, cash flow adequacy, and debt coverage. The study evaluates short-term credit risk, adequacy of cash resources, long-term survival prospects, and cash-generating capacity for both companies. The conclusion suggests that JB Hi-Fi is more successful and strong, while Harvey Norman is steadier due to its franchising business. The study recommends investing in JB Hi-Fi during positive economic trends and in Harvey Norman during negative trends, based on their respective financial frameworks and business stability.
tabler-icon-diamond-filled.svg

Contribute Materials

Your contribution can guide someone’s learning journey. Share your documents today.
Document Page
T22017_ACCT2077
Accounting for managers
tabler-icon-diamond-filled.svg

Secure Best Marks with AI Grader

Need help grading? Try our AI Grader for instant feedback on your assignments.
Document Page
TABLE OF CONTENTS
Question 2..................................................................................................................................3
Cash flow from operating activities.......................................................................................3
Cash flow from investing activities........................................................................................3
Cash flow from financing activities.......................................................................................4
Question 3..................................................................................................................................4
Evaluation of short term credit risk........................................................................................4
Adequacy of cash resources with both the companies...........................................................4
Survival for longer term of both companies..........................................................................4
Comparison of cash generating capacity................................................................................4
References..................................................................................................................................5
Document Page
INTRODUCTION
Present study is based on comparative cash flow analysis of JB HI FI and Harvey
Norman by considering relevant financial facts and figures. Study aims to determine cash
efficiency of both business entities to evaluate aspect such as short term credit risk, adequacy
of cash resources, survival for longer term and cash generating capacity.
QUESTION 2
Cash flow from operating activities
Year 2016 2015 2014
Cash Flow
from
operating
activities
JB Hi-
Fi
Harvey
Norman
JB Hi-
Fi
Harvey
Norman
JB Hi- Fi Harvey
Norman
$185.14
million
$437.69
million
$179.89
million
$340.45
million
$41.326
million
$338.9
million
(Source: Annual report of JB HI FI, 2016 and Annual report of Harvey Norman, 2016)
Year 2016
JB Hi- Fi Harvey Norman
Cash flow to sales ratio 0.05 .24
Working capital ratio 1.57 1.26
Cash flow adequacy ratio 1.21 1.21
By considering cash flow from operating activities of both companies, it can be
noticed that operational performance of Harvey Norman is better as it is showing increasing
growth trend while growth percentage of JB Hi- Fi is comparatively lower. Coming to JB Hi-
Fi, its retail business is more successful compared to Harvey Norman's counterpart, its
effectiveness in making utilization of its equity and assets was comparatively high than
Harvey Norman and same approach is applicable for cash flow generation efficiency (Park &
Document Page
Jang, 2013). Coming to financing framework and stability, JB Hi-Fi has depended largely on
debts but contained on issue regarding liquidity in both short and long term. With regard to
Harvey Norman, its business of franchises guaranteed a larger and more consistent
profitability, but in its business of retailing, business adversely failed, its effectiveness in
using its assets and equity was comparatively low and was not able to generate cash like JB
Hi-Fi (Kaufman, 2014).
Cash flow from investing activities
Year 2016 2015 2014
Cash Flow
from
investing
activities
JB Hi-
Fi
Harvey
Norman
JB Hi-
Fi
Harvey
Norman
JB Hi- Fi Harvey
Norman
($52.00)
million
($179.853)
million
($44.37)
million
($81.803)
million
($38.24)
million
($113.117)
million
(Source: Annual report of JB HI FI, 2016 and Annual report of Harvey Norman, 2016)
Year 2016
JB Hi- Fi Harvey Norman
Debt to total assets ratio 0.06 .39
Investing activities of both the companies show negative cash flow which reflects expansion
strategies by growing their asset base for long terms sustainability. However, JB HI-FI is
having increasing investment trend while trend of Harvey Norman is fluctuating.
Cash flow from financing activities
Year 2016 2015 2014
Cash Flow
from
financing
activities
JB Hi- Fi Harvey
Norman
JB Hi- Fi Harvey
Norman
JB Hi- Fi Harvey
Norman
($130.565)
million
($307.427)
million
($129.640)
million
($220.597)
million
($27.609)
million
($235.213)
million
(Source: Annual report of JB HI FI, 2016 and Annual report of Harvey Norman, 2016)
tabler-icon-diamond-filled.svg

Secure Best Marks with AI Grader

Need help grading? Try our AI Grader for instant feedback on your assignments.
Document Page
Year 2016
JB Hi- Fi Harvey Norman
Debt coverage ratio 3.73 1.77
Cash Flow from financing activities for the both the companies is negative which
shows they are paying debt and generating lower fund from equity. Debt coverage ratio of
company is significantly high and it indicates that the company has been lending forcefully to
fund its growth and consequently can meet load of extra expenses of interest (Kroes &
Manikas, 2014). Further it may decrease revenues and growth for future. On the contrary to
this, small Debt coverage ratio can show that the firm is no able to take full advantage from
the financial leverage. This shows that in terms of debt coverage ratio JB Hi Fi is performing
better.
QUESTION 3
Evaluation of short term credit risk
Year 2016
JB Hi- Fi Harvey Norman
Working capital ratio 1.57 1.26
Cash flow adequacy ratio 1.21 1.21
Credit risk is the risk of not paying the current debts. In accordance with the above
table, it is considered that JB Hi-Fi has a relatively improved short term credit risk, because it
shows significantly high capital ratio (Lewellen & Lewellen, 2016). It also shows that it
contains adequate finance than Harvey Norman Ltd regarding the repayment of existing
debts.
Adequacy of cash resources with both the companies
Year 2016
JB Hi- Fi Harvey Norman
Cash flow adequacy ratio 1.21 1.21
Cash flow to sales ratio 0.05 .24
Document Page
Cash flow adequacy ratio Cash flow to sales ratio
0
0.2
0.4
0.6
0.8
1
1.2
1.4
Adequacy of cash resources
JB Hi- Fi Harvey Norman
Through assessing the above ratio analysis of both companies, it is observed that firm
contains adequate financial sources to direct business liquidity. Therefore, cash sufficiency
ratio of both firms is same and has immense increase in the cash flow trend from the working
activities (Bhandari & Iyer, 2013). This aspect represents improvement in the capability of
the firm in relation to the cost and cash effectiveness.
Survival for longer term of both companies
Present study clarifies that both the companies are financial stability as they are
investing for future expansion and growth of business (Gordon and et.al, 2017). Managerial
entities of both the companies are committed for sustainability and survival in market by
considering its stability in business as well as financial framework.
Comparison of cash generating capacity
2016
JB Hi- Fi Harvey Norman
Cash flow to sales ratio 0.05 .24
Document Page
Cash flow to sales ratio
0
0.05
0.1
0.15
0.2
0.25
0.3
Cash flow to sales ratio
JB Hi- Fi Harvey Norman
By observing the cash flow to sales ratio, it is alluded that Harvey Norman is running
its business relatively better than JB HI-FI.
CONCLUSION
Ultimately, it is concluded that JB Hi-Fi is comparatively more successful and strong,
whereas Harvey Norman was steadier all thanks to the business of franchising. Thus, the
recommendation provided for that investing must be done in JB Hi-Fi when there is positive
change in economy, as its requirements for the development of retailing relied on the entire
conditions of business, and the entire positive trend can expand retailing effectiveness and
competence ((Sauaia, 2014)). Further, investing must be done in Harvey Norman if there is
negative trend in economy by considering its stability in business as well as financial
framework.
tabler-icon-diamond-filled.svg

Paraphrase This Document

Need a fresh take? Get an instant paraphrase of this document with our AI Paraphraser
Document Page
REFERENCES
Annual report of Harvey Norman. (2016). [PDF]. Retrieved from <
http://www.harveynormanholdings.com.au/pdf_files/2012_Annual_Report_Final.pdf
>.
Annual report of JB HI FI. (2016). [PDF]. Retrieved from <
https://www.jbhifi.com.au/Documents/2016%20JB%20Hi-Fi%20Annual
%20Report_ASX.pdf >.
Bhandari, S. B., & Iyer, R. (2013). Predicting business failure using cash flow statement
based measures. Managerial Finance, 39(7), 667-676.
Gordon, E. A., Henry, E., Jorgensen, B. N., & Linthicum, C. L. (2017). Flexibility in cash-
flow classification under IFRS: determinants and consequences. Review of
Accounting Studies, 22(2), 839-872.
Kaufman, M. (2014). Weekly Cash-Flow Analysis: Why Isn't It a" Best Practice"?. American
Bankruptcy Institute Journal, 33(8), 32.
Kroes, J. R., & Manikas, A. S. (2014). Cash flow management and manufacturing firm
financial performance: A longitudinal perspective. International Journal of
Production Economics, 148, 37-50.
Lewellen, J., & Lewellen, K. (2016). Investment and cash flow: New evidence. Journal of
Financial and Quantitative Analysis, 51(4), 1135-1164.
Park, K., & Jang, S. S. (2013). Capital structure, free cash flow, diversification and firm
performance: A holistic analysis. International Journal of Hospitality
Management, 33, 51-63.
Sauaia, A. C. A. (2014). Evaluation of performance in business games: financial and non
financial approaches. Developments in Business Simulation and Experiential
Learning, 28.
chevron_up_icon
1 out of 8
circle_padding
hide_on_mobile
zoom_out_icon
logo.png

Your All-in-One AI-Powered Toolkit for Academic Success.

Available 24*7 on WhatsApp / Email

[object Object]