Cash Flow Analysis of JB Hi-Fi and Harvey Norman
VerifiedAdded on 2020/02/24
|14
|2408
|47
Report
AI Summary
This report presents a comprehensive analysis of the cash flow statements of JB Hi-Fi and Harvey Norman, utilizing the direct method for cash flow presentation. It includes detailed evaluations of liquidity, solvency, and profitability ratios, comparing the financial health of both companies. The report highlights key findings from the cash flow analysis, including trends in operating cash flows and recommendations for improving financial performance.

Management accounting
Paraphrase This Document
Need a fresh take? Get an instant paraphrase of this document with our AI Paraphraser
TABLE OF CONTENTS
Question 1..................................................................................................................................3
JB Hi- Fi.................................................................................................................................3
Harvey Norman......................................................................................................................4
Question 2..................................................................................................................................5
Harvey Norman......................................................................................................................5
Analysis of Cash Flow Statement......................................................................................5
JB Hi- Fi.................................................................................................................................7
Analysis of Cash Flow Statement......................................................................................7
Question 3..................................................................................................................................8
Part A.....................................................................................................................................8
References..................................................................................................................................9
Appendix..................................................................................................................................10
Calculation of Ratios............................................................................................................10
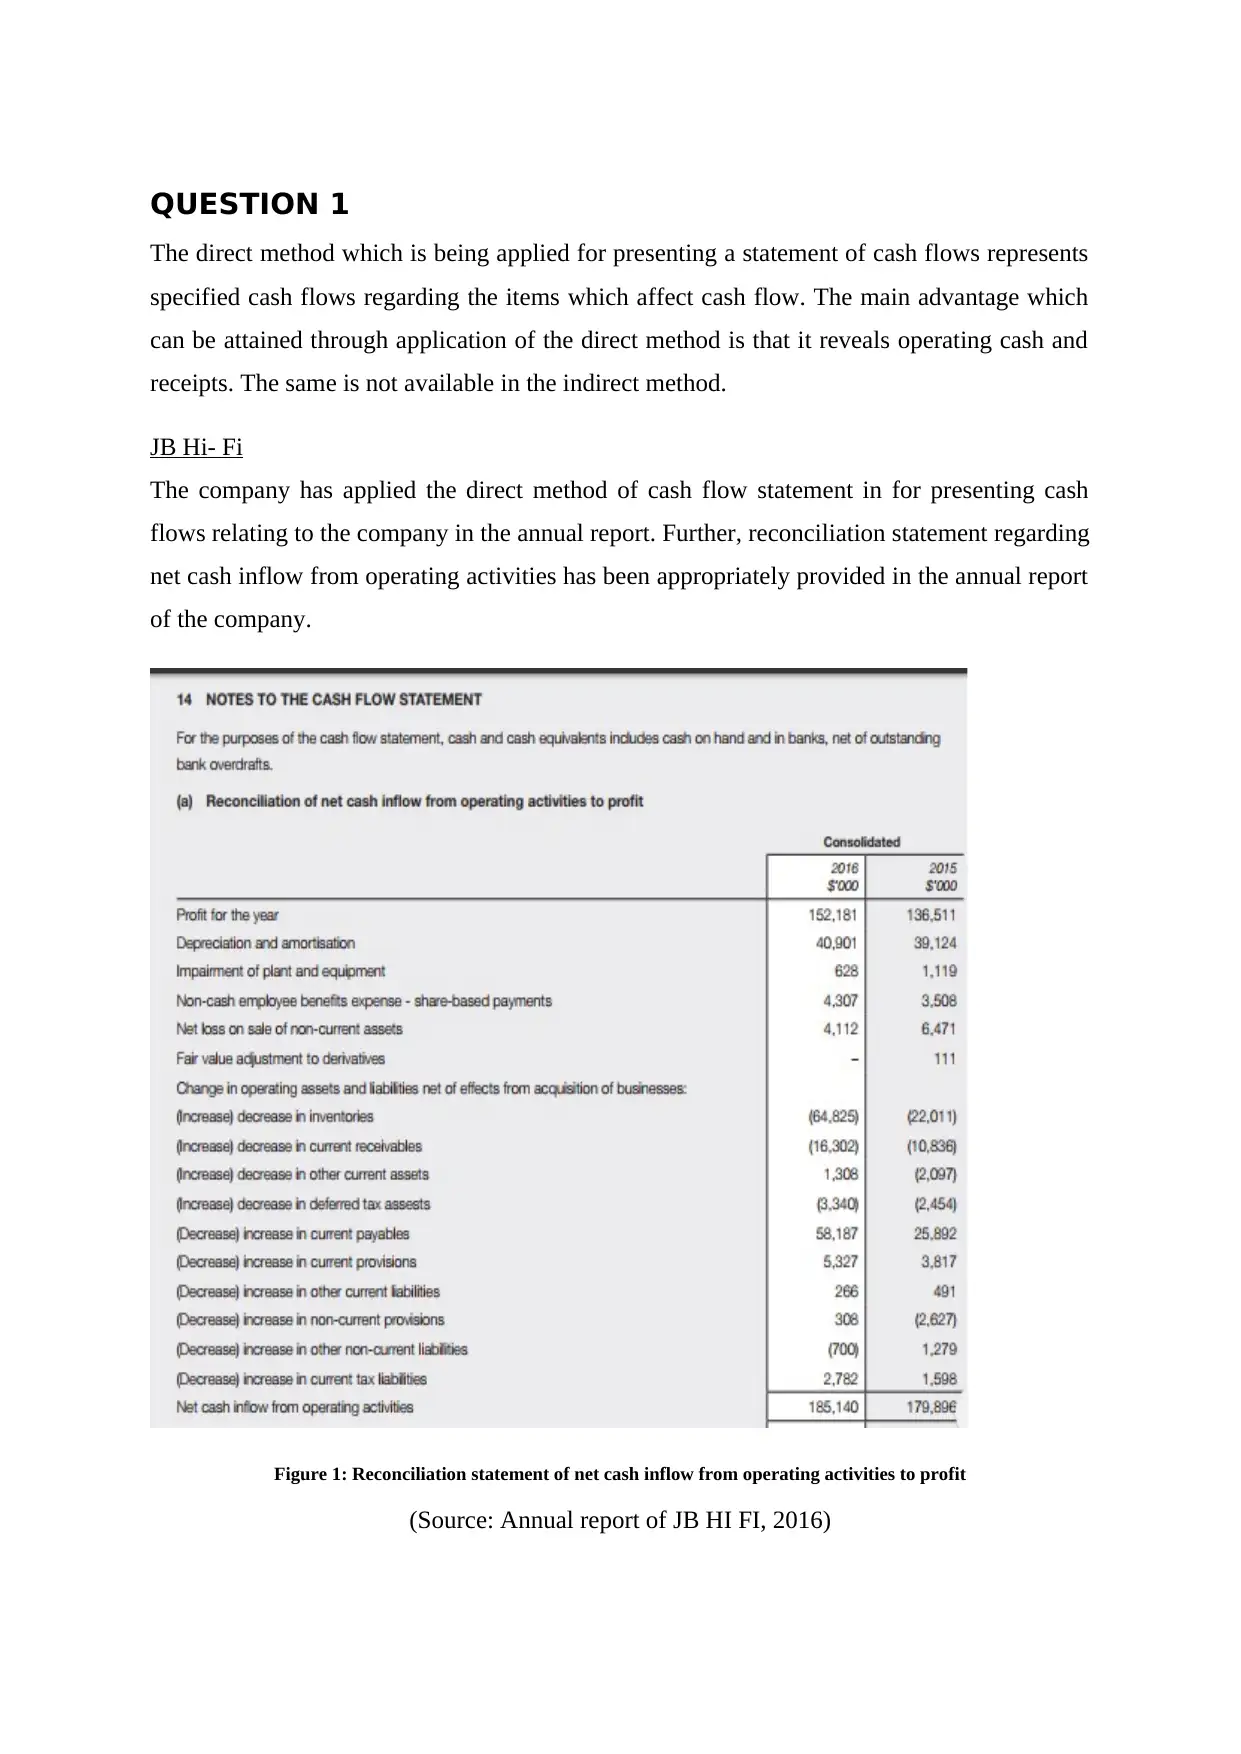
QUESTION 1
The direct method which is being applied for presenting a statement of cash flows represents
specified cash flows regarding the items which affect cash flow. The main advantage which
can be attained through application of the direct method is that it reveals operating cash and
receipts. The same is not available in the indirect method.
JB Hi- Fi
The company has applied the direct method of cash flow statement in for presenting cash
flows relating to the company in the annual report. Further, reconciliation statement regarding
net cash inflow from operating activities has been appropriately provided in the annual report
of the company.
Figure 1: Reconciliation statement of net cash inflow from operating activities to profit
(Source: Annual report of JB HI FI, 2016)
⊘ This is a preview!⊘
Do you want full access?
Subscribe today to unlock all pages.
Trusted by 1+ million students worldwide
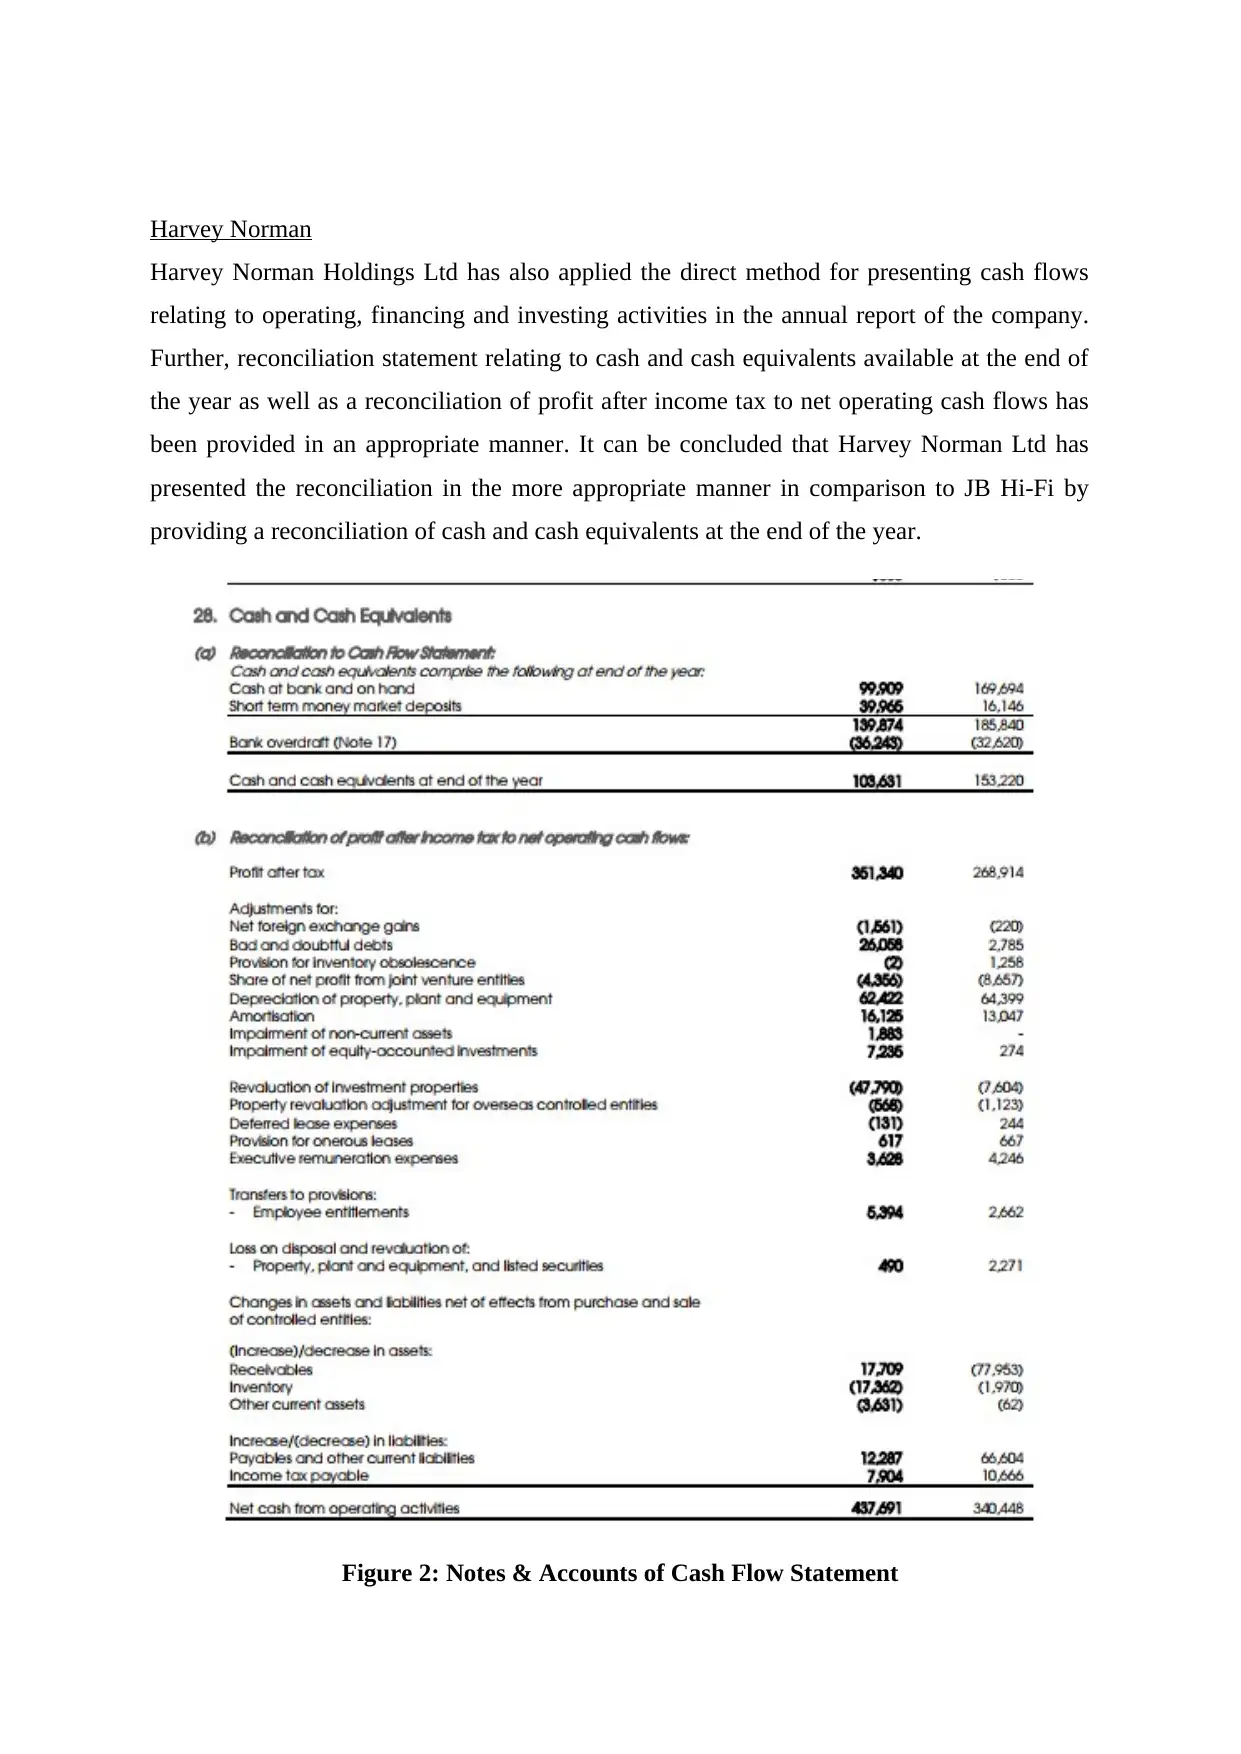
Harvey Norman
Harvey Norman Holdings Ltd has also applied the direct method for presenting cash flows
relating to operating, financing and investing activities in the annual report of the company.
Further, reconciliation statement relating to cash and cash equivalents available at the end of
the year as well as a reconciliation of profit after income tax to net operating cash flows has
been provided in an appropriate manner. It can be concluded that Harvey Norman Ltd has
presented the reconciliation in the more appropriate manner in comparison to JB Hi-Fi by
providing a reconciliation of cash and cash equivalents at the end of the year.
Figure 2: Notes & Accounts of Cash Flow Statement
Paraphrase This Document
Need a fresh take? Get an instant paraphrase of this document with our AI Paraphraser
(Source: Annual report of Harvey Norman, 2016)
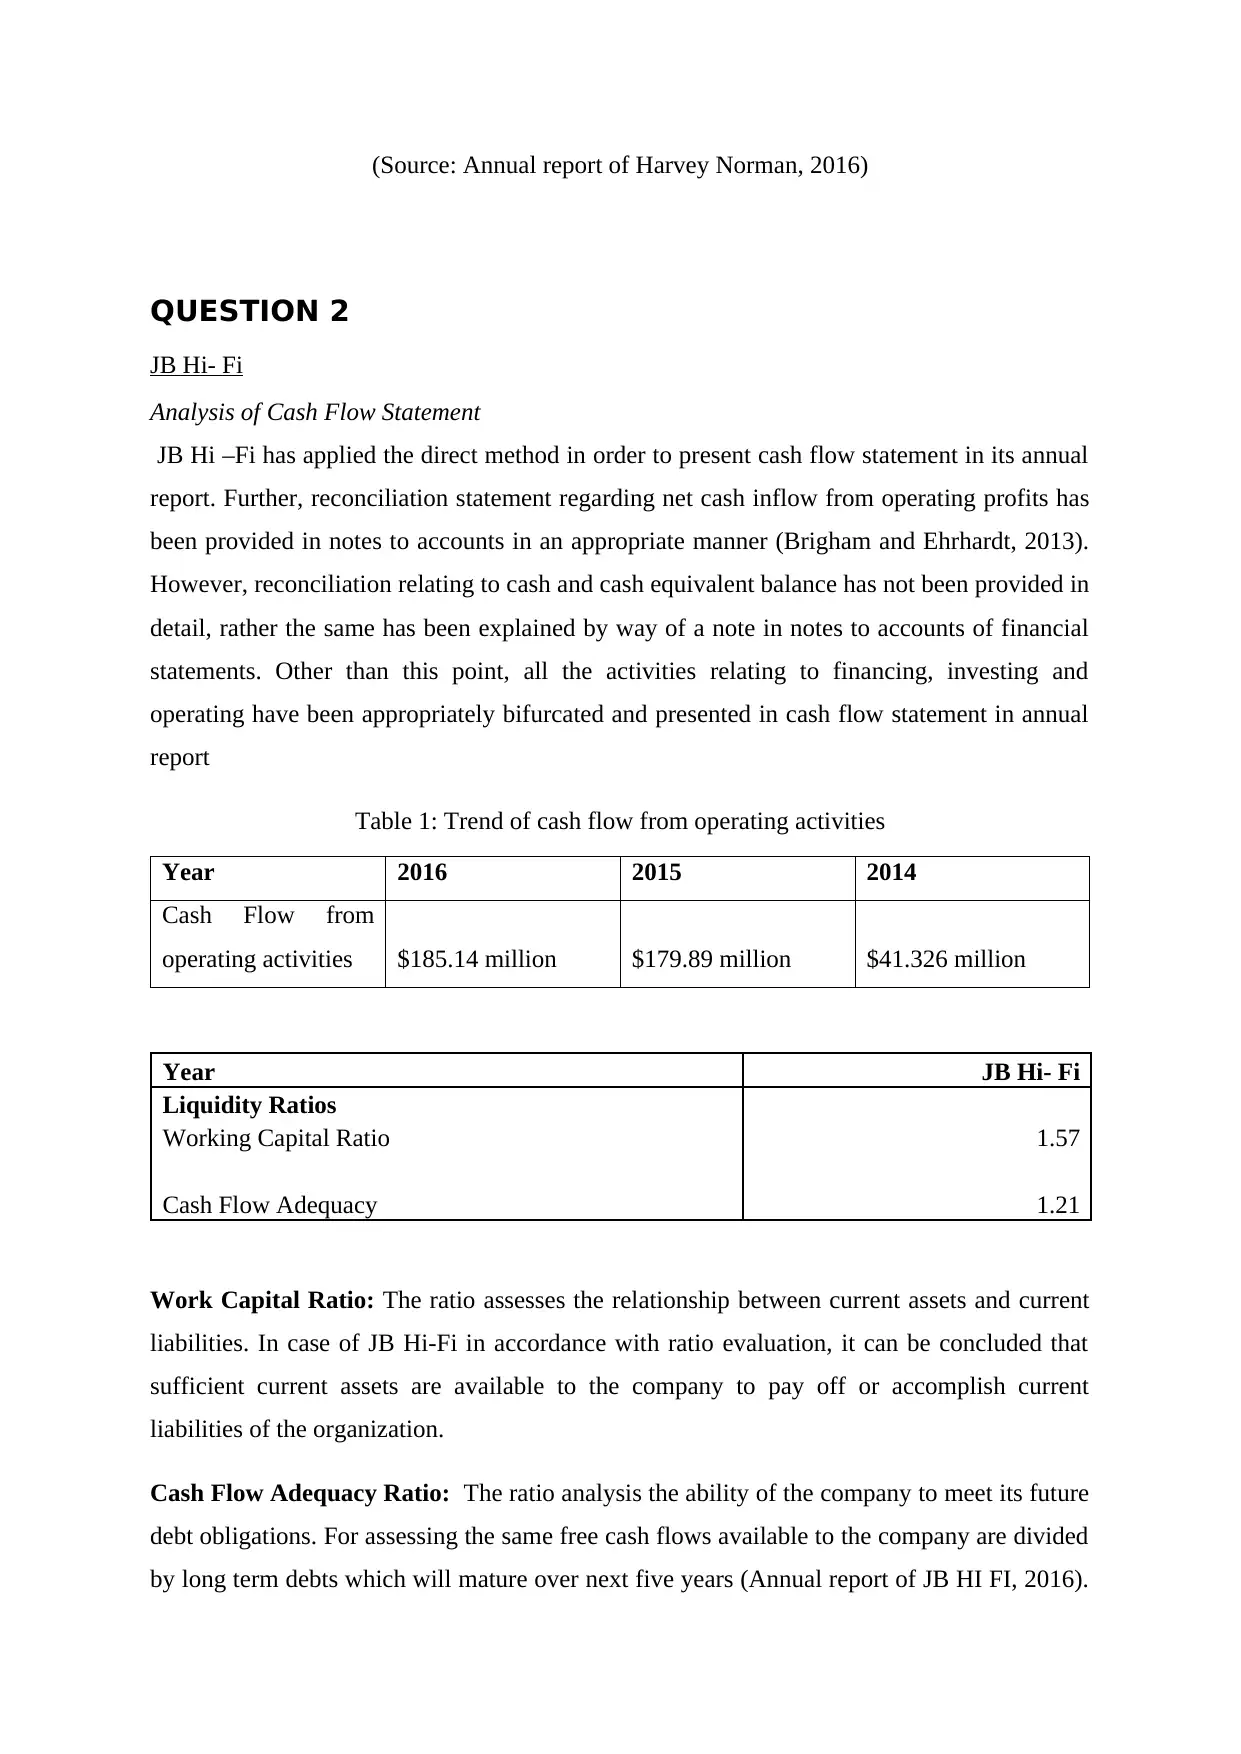
QUESTION 2
JB Hi- Fi
Analysis of Cash Flow Statement
JB Hi –Fi has applied the direct method in order to present cash flow statement in its annual
report. Further, reconciliation statement regarding net cash inflow from operating profits has
been provided in notes to accounts in an appropriate manner (Brigham and Ehrhardt, 2013).
However, reconciliation relating to cash and cash equivalent balance has not been provided in
detail, rather the same has been explained by way of a note in notes to accounts of financial
statements. Other than this point, all the activities relating to financing, investing and
operating have been appropriately bifurcated and presented in cash flow statement in annual
report
Table 1: Trend of cash flow from operating activities
Year 2016 2015 2014
Cash Flow from
operating activities $185.14 million $179.89 million $41.326 million
Year JB Hi- Fi
Liquidity Ratios
Working Capital Ratio 1.57
Cash Flow Adequacy 1.21
Work Capital Ratio: The ratio assesses the relationship between current assets and current
liabilities. In case of JB Hi-Fi in accordance with ratio evaluation, it can be concluded that
sufficient current assets are available to the company to pay off or accomplish current
liabilities of the organization.
Cash Flow Adequacy Ratio: The ratio analysis the ability of the company to meet its future
debt obligations. For assessing the same free cash flows available to the company are divided
by long term debts which will mature over next five years (Annual report of JB HI FI, 2016).
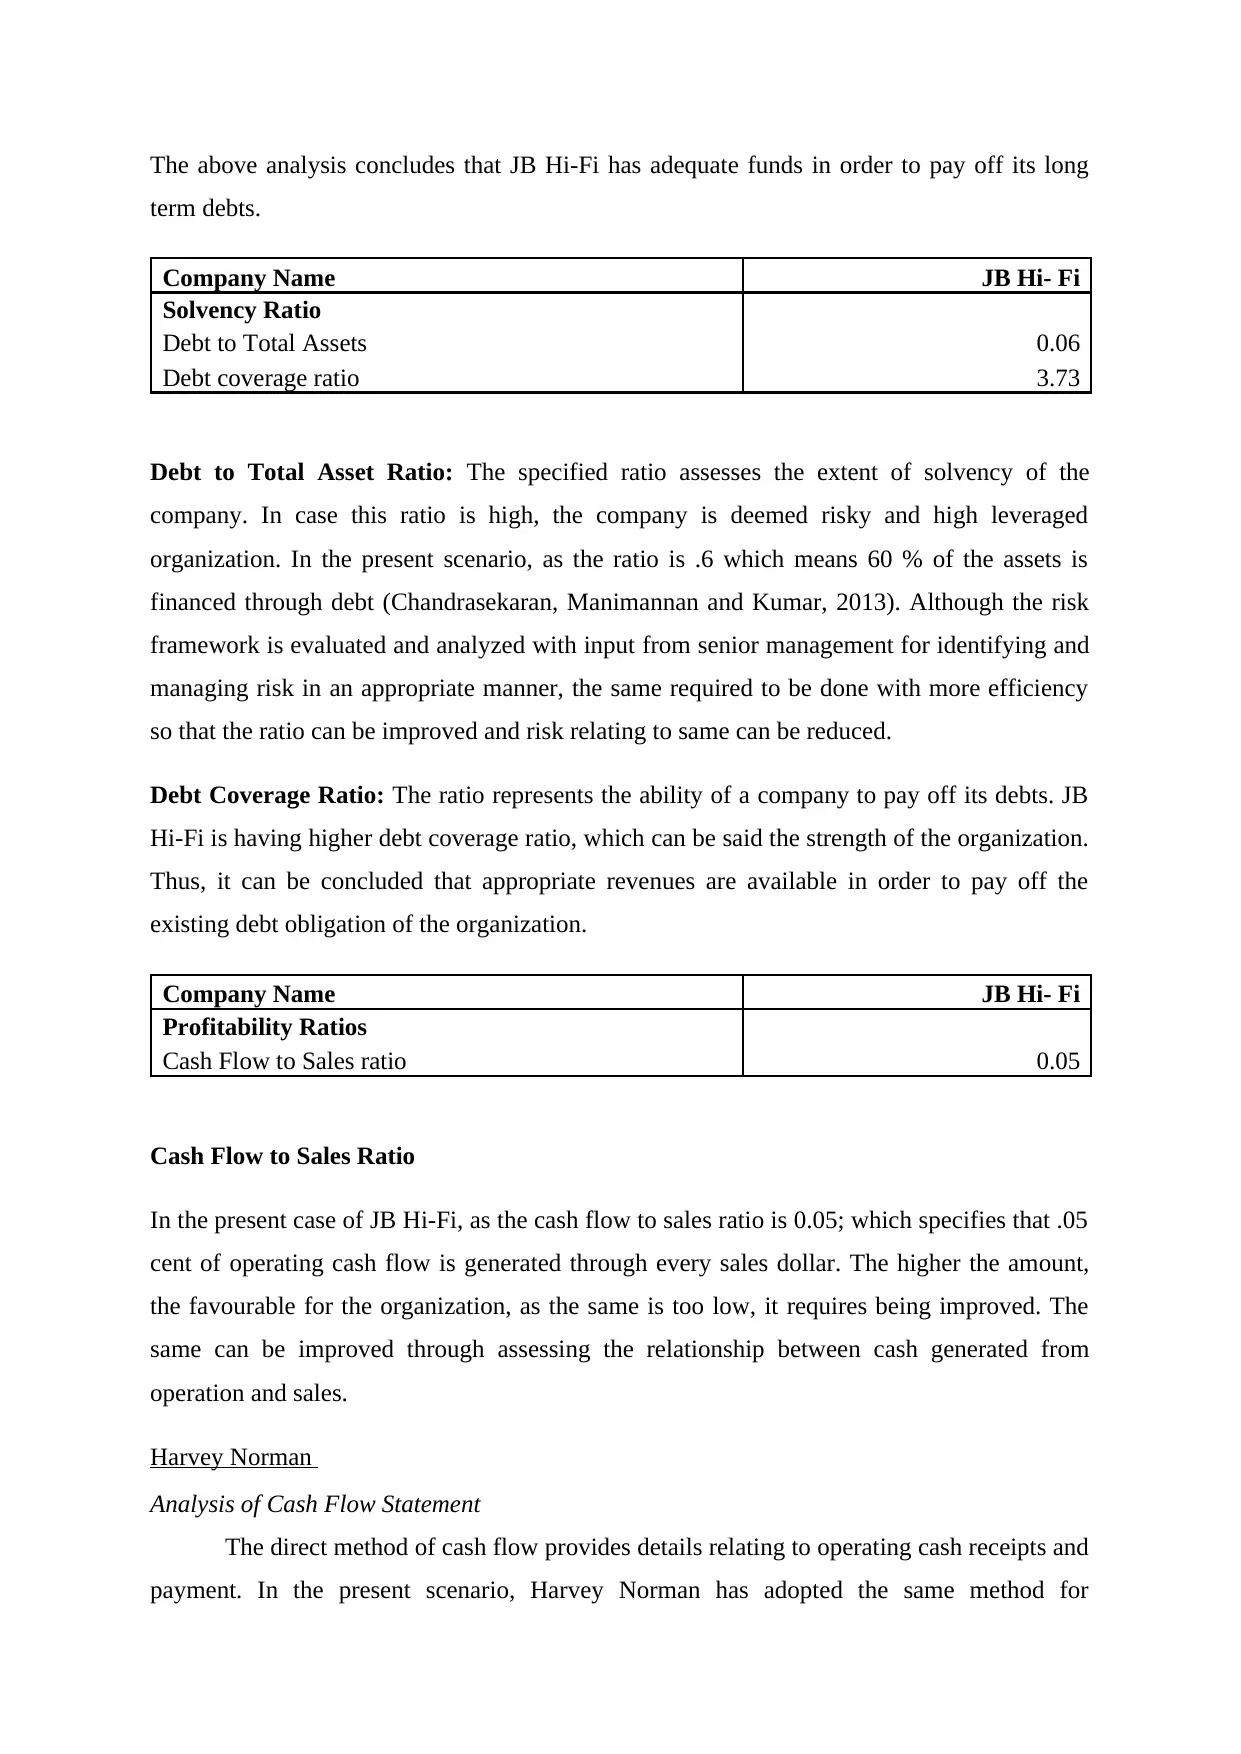
The above analysis concludes that JB Hi-Fi has adequate funds in order to pay off its long
term debts.
Company Name JB Hi- Fi
Solvency Ratio
Debt to Total Assets 0.06
Debt coverage ratio 3.73
Debt to Total Asset Ratio: The specified ratio assesses the extent of solvency of the
company. In case this ratio is high, the company is deemed risky and high leveraged
organization. In the present scenario, as the ratio is .6 which means 60 % of the assets is
financed through debt (Chandrasekaran, Manimannan and Kumar, 2013). Although the risk
framework is evaluated and analyzed with input from senior management for identifying and
managing risk in an appropriate manner, the same required to be done with more efficiency
so that the ratio can be improved and risk relating to same can be reduced.
Debt Coverage Ratio: The ratio represents the ability of a company to pay off its debts. JB
Hi-Fi is having higher debt coverage ratio, which can be said the strength of the organization.
Thus, it can be concluded that appropriate revenues are available in order to pay off the
existing debt obligation of the organization.
Company Name JB Hi- Fi
Profitability Ratios
Cash Flow to Sales ratio 0.05
Cash Flow to Sales Ratio
In the present case of JB Hi-Fi, as the cash flow to sales ratio is 0.05; which specifies that .05
cent of operating cash flow is generated through every sales dollar. The higher the amount,
the favourable for the organization, as the same is too low, it requires being improved. The
same can be improved through assessing the relationship between cash generated from
operation and sales.
Harvey Norman
Analysis of Cash Flow Statement
The direct method of cash flow provides details relating to operating cash receipts and
payment. In the present scenario, Harvey Norman has adopted the same method for
⊘ This is a preview!⊘
Do you want full access?
Subscribe today to unlock all pages.
Trusted by 1+ million students worldwide
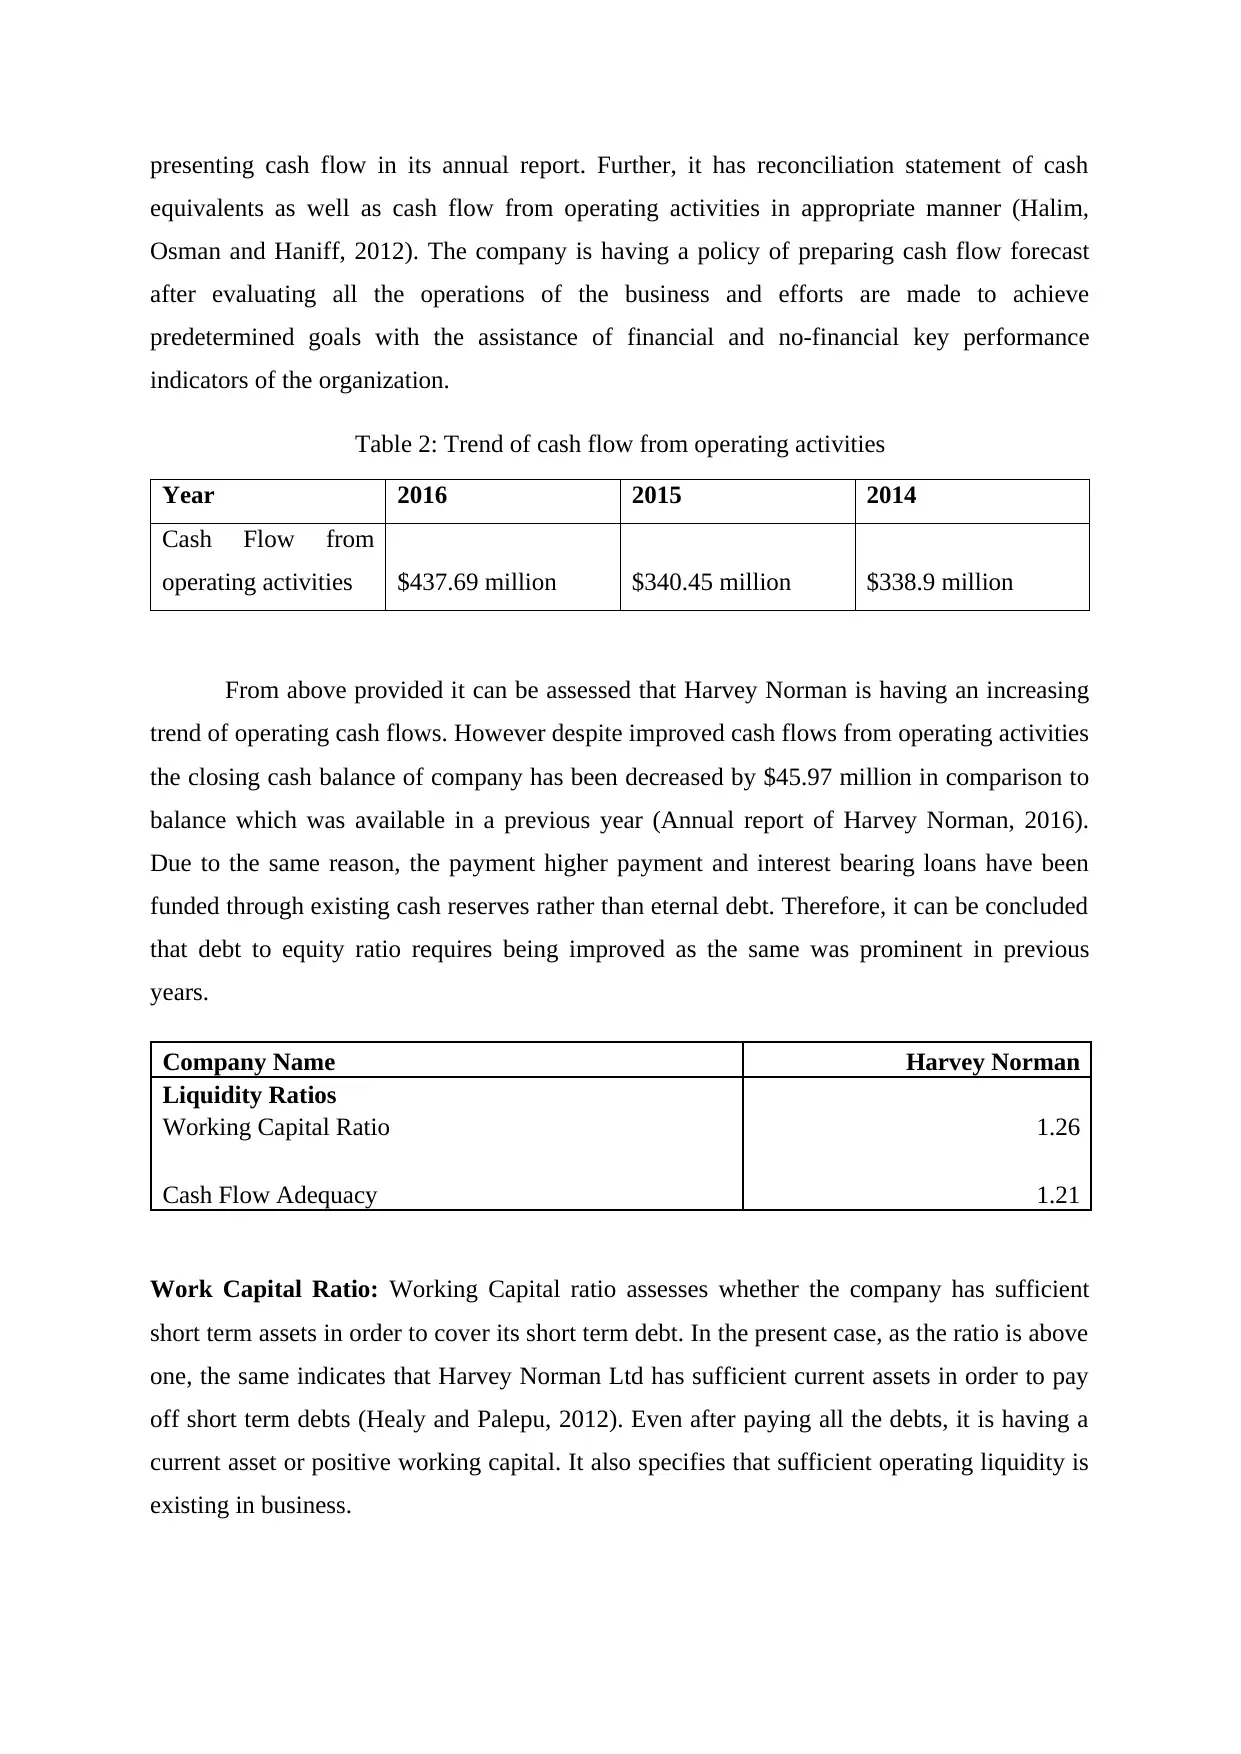
presenting cash flow in its annual report. Further, it has reconciliation statement of cash
equivalents as well as cash flow from operating activities in appropriate manner (Halim,
Osman and Haniff, 2012). The company is having a policy of preparing cash flow forecast
after evaluating all the operations of the business and efforts are made to achieve
predetermined goals with the assistance of financial and no-financial key performance
indicators of the organization.
Table 2: Trend of cash flow from operating activities
Year 2016 2015 2014
Cash Flow from
operating activities $437.69 million $340.45 million $338.9 million
From above provided it can be assessed that Harvey Norman is having an increasing
trend of operating cash flows. However despite improved cash flows from operating activities
the closing cash balance of company has been decreased by $45.97 million in comparison to
balance which was available in a previous year (Annual report of Harvey Norman, 2016).
Due to the same reason, the payment higher payment and interest bearing loans have been
funded through existing cash reserves rather than eternal debt. Therefore, it can be concluded
that debt to equity ratio requires being improved as the same was prominent in previous
years.
Company Name Harvey Norman
Liquidity Ratios
Working Capital Ratio 1.26
Cash Flow Adequacy 1.21
Work Capital Ratio: Working Capital ratio assesses whether the company has sufficient
short term assets in order to cover its short term debt. In the present case, as the ratio is above
one, the same indicates that Harvey Norman Ltd has sufficient current assets in order to pay
off short term debts (Healy and Palepu, 2012). Even after paying all the debts, it is having a
current asset or positive working capital. It also specifies that sufficient operating liquidity is
existing in business.
Paraphrase This Document
Need a fresh take? Get an instant paraphrase of this document with our AI Paraphraser
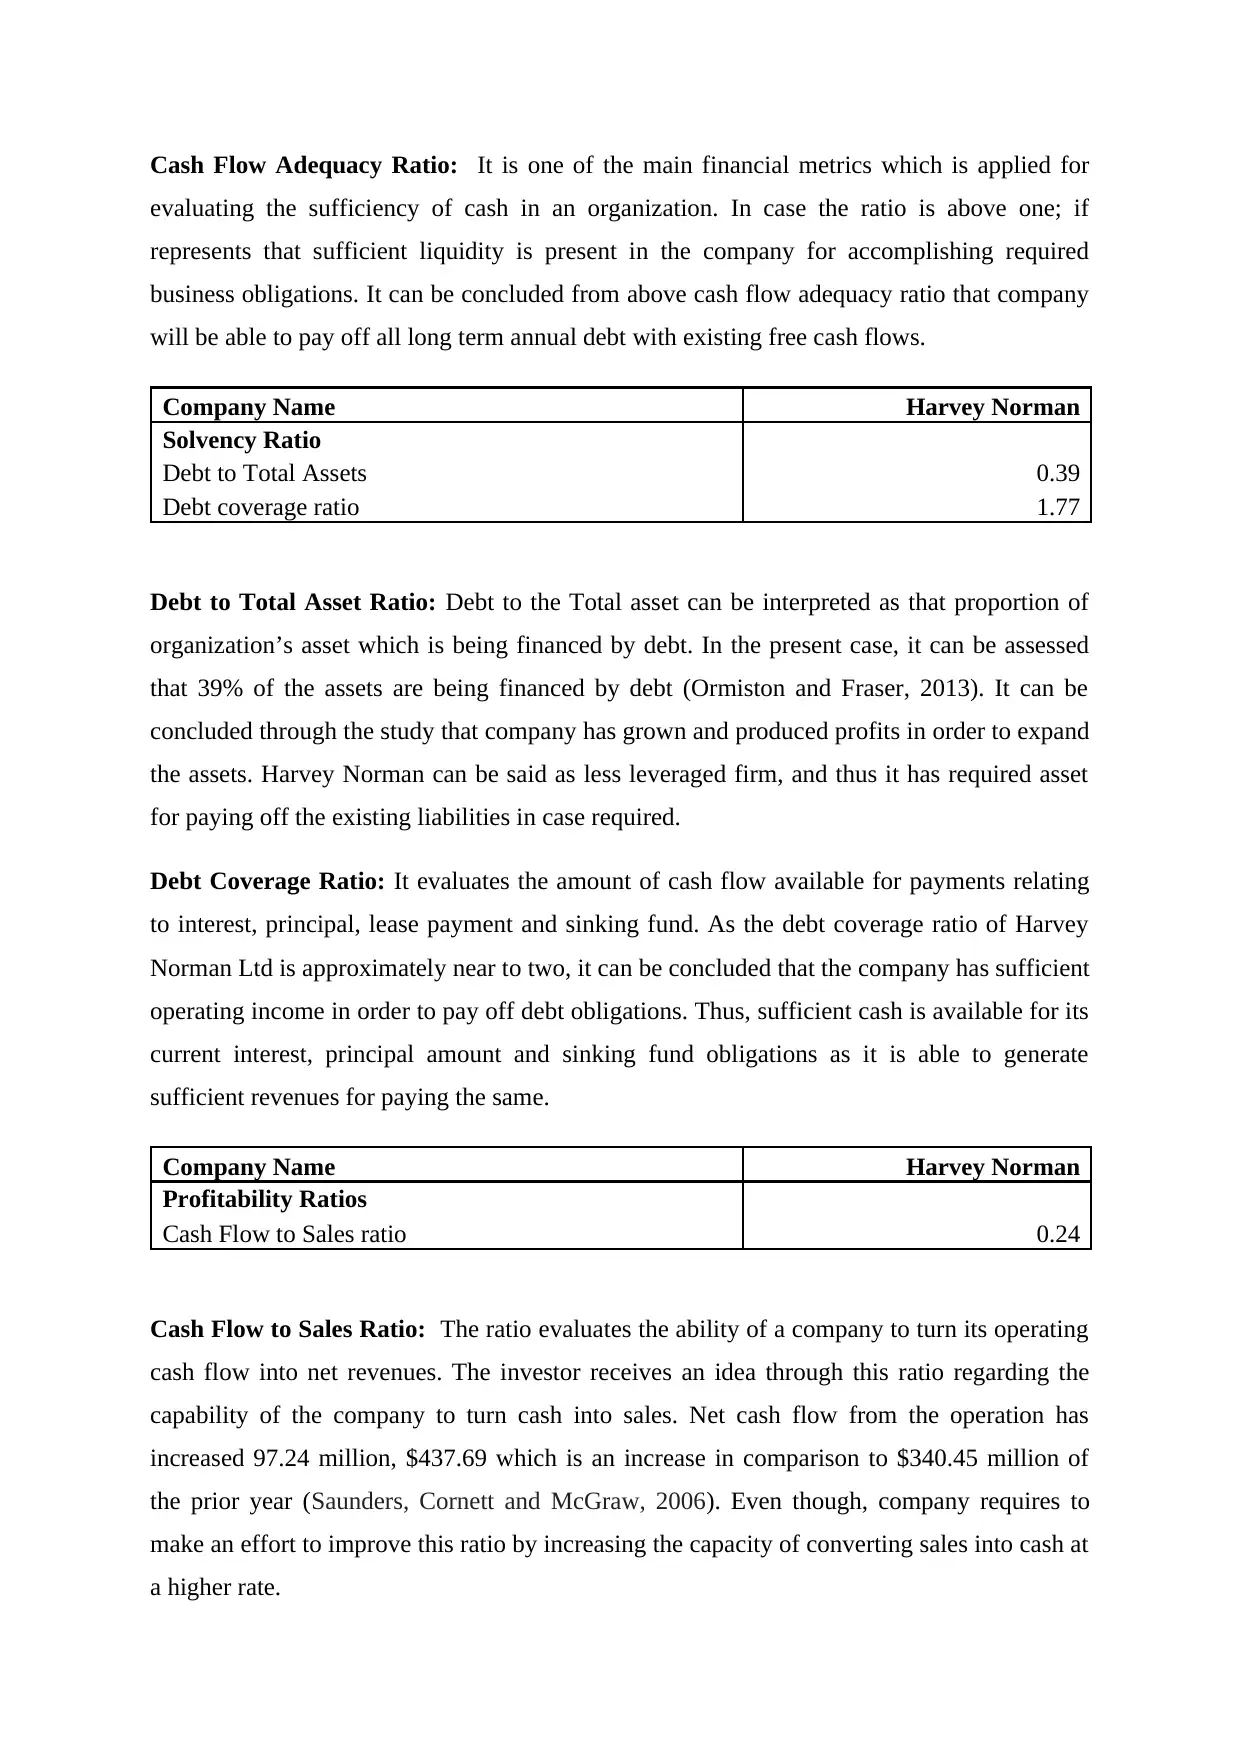
Cash Flow Adequacy Ratio: It is one of the main financial metrics which is applied for
evaluating the sufficiency of cash in an organization. In case the ratio is above one; if
represents that sufficient liquidity is present in the company for accomplishing required
business obligations. It can be concluded from above cash flow adequacy ratio that company
will be able to pay off all long term annual debt with existing free cash flows.
Company Name Harvey Norman
Solvency Ratio
Debt to Total Assets 0.39
Debt coverage ratio 1.77
Debt to Total Asset Ratio: Debt to the Total asset can be interpreted as that proportion of
organization’s asset which is being financed by debt. In the present case, it can be assessed
that 39% of the assets are being financed by debt (Ormiston and Fraser, 2013). It can be
concluded through the study that company has grown and produced profits in order to expand
the assets. Harvey Norman can be said as less leveraged firm, and thus it has required asset
for paying off the existing liabilities in case required.
Debt Coverage Ratio: It evaluates the amount of cash flow available for payments relating
to interest, principal, lease payment and sinking fund. As the debt coverage ratio of Harvey
Norman Ltd is approximately near to two, it can be concluded that the company has sufficient
operating income in order to pay off debt obligations. Thus, sufficient cash is available for its
current interest, principal amount and sinking fund obligations as it is able to generate
sufficient revenues for paying the same.
Company Name Harvey Norman
Profitability Ratios
Cash Flow to Sales ratio 0.24
Cash Flow to Sales Ratio: The ratio evaluates the ability of a company to turn its operating
cash flow into net revenues. The investor receives an idea through this ratio regarding the
capability of the company to turn cash into sales. Net cash flow from the operation has
increased 97.24 million, $437.69 which is an increase in comparison to $340.45 million of
the prior year (Saunders, Cornett and McGraw, 2006). Even though, company requires to
make an effort to improve this ratio by increasing the capacity of converting sales into cash at
a higher rate.
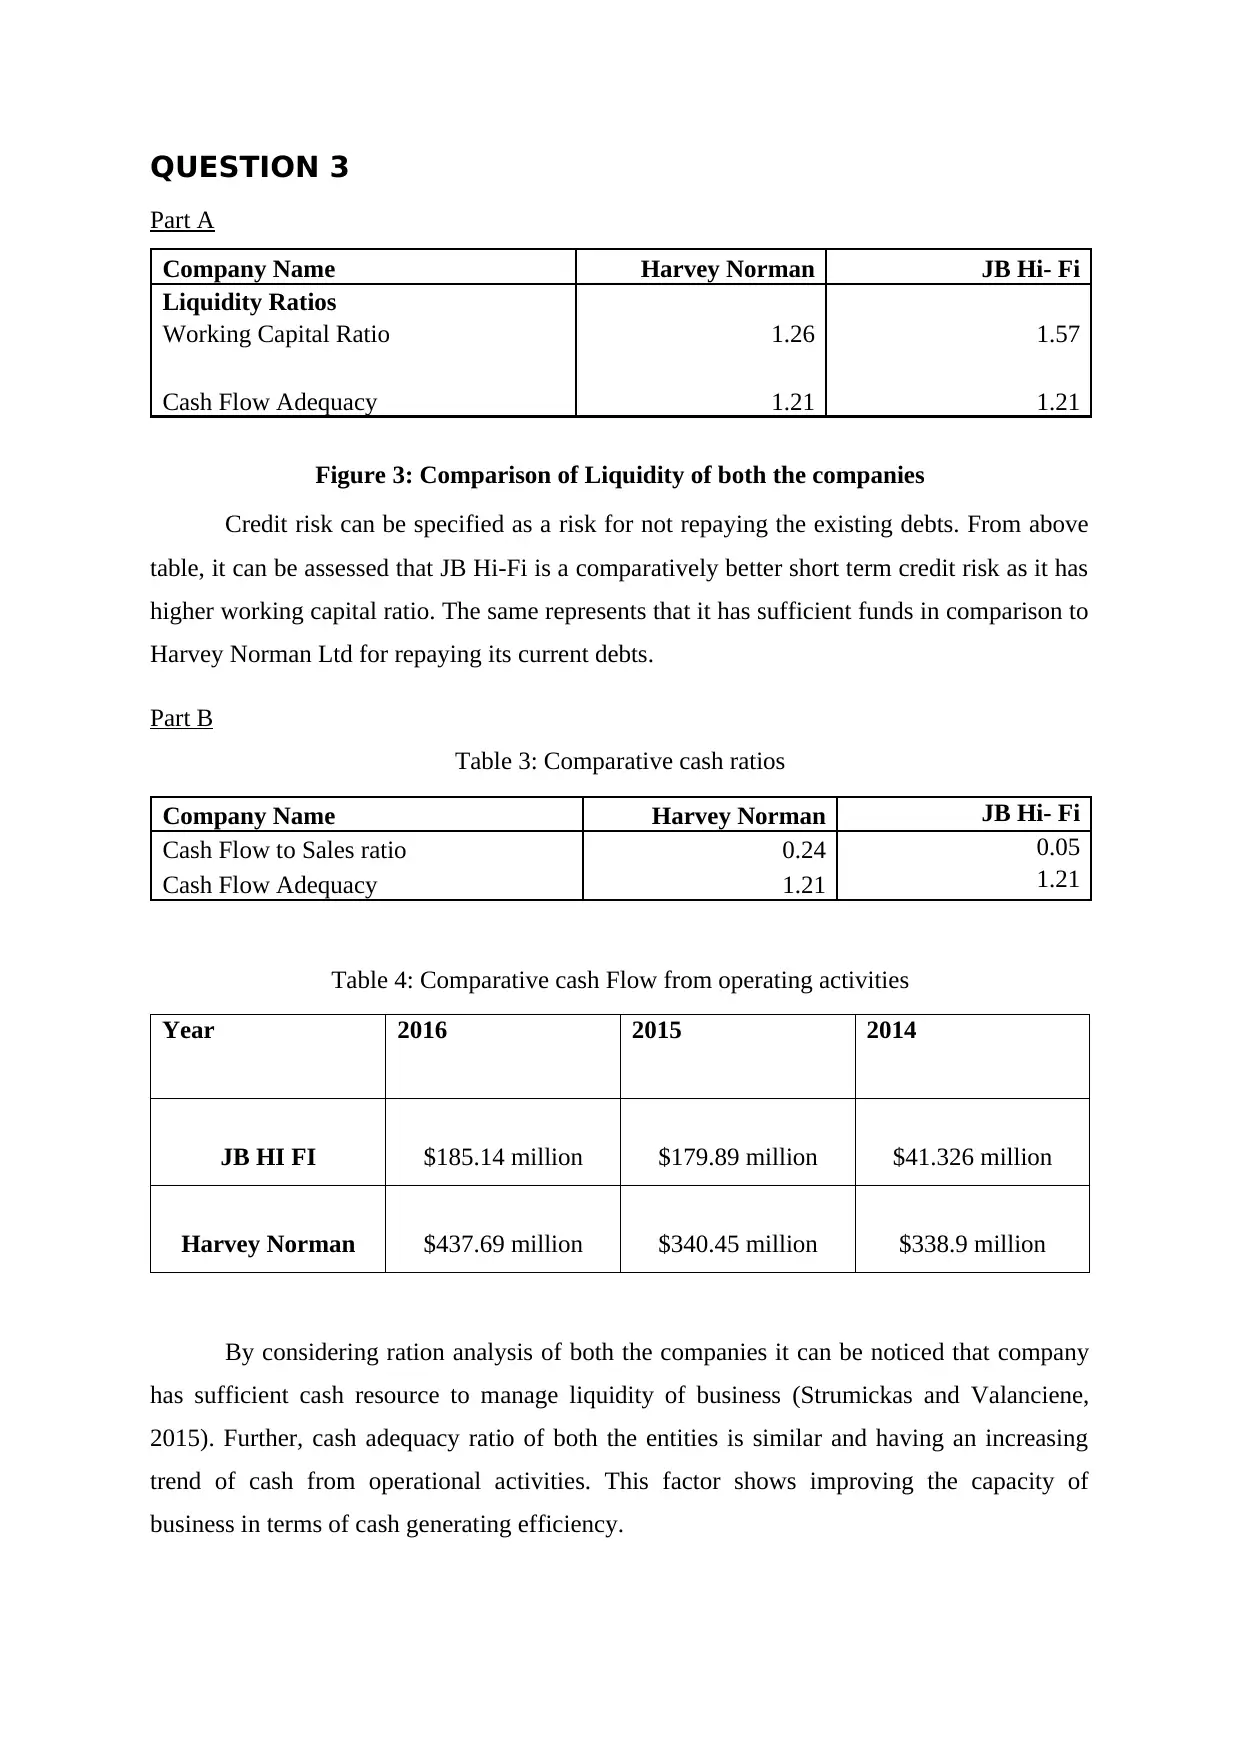
QUESTION 3
Part A
Company Name Harvey Norman JB Hi- Fi
Liquidity Ratios
Working Capital Ratio 1.26 1.57
Cash Flow Adequacy 1.21 1.21
Figure 3: Comparison of Liquidity of both the companies
Credit risk can be specified as a risk for not repaying the existing debts. From above
table, it can be assessed that JB Hi-Fi is a comparatively better short term credit risk as it has
higher working capital ratio. The same represents that it has sufficient funds in comparison to
Harvey Norman Ltd for repaying its current debts.
Part B
Table 3: Comparative cash ratios
Company Name Harvey Norman JB Hi- Fi
Cash Flow to Sales ratio 0.24 0.05
Cash Flow Adequacy 1.21 1.21
Table 4: Comparative cash Flow from operating activities
Year 2016 2015 2014
JB HI FI $185.14 million $179.89 million $41.326 million
Harvey Norman $437.69 million $340.45 million $338.9 million
By considering ration analysis of both the companies it can be noticed that company
has sufficient cash resource to manage liquidity of business (Strumickas and Valanciene,
2015). Further, cash adequacy ratio of both the entities is similar and having an increasing
trend of cash from operational activities. This factor shows improving the capacity of
business in terms of cash generating efficiency.
⊘ This is a preview!⊘
Do you want full access?
Subscribe today to unlock all pages.
Trusted by 1+ million students worldwide
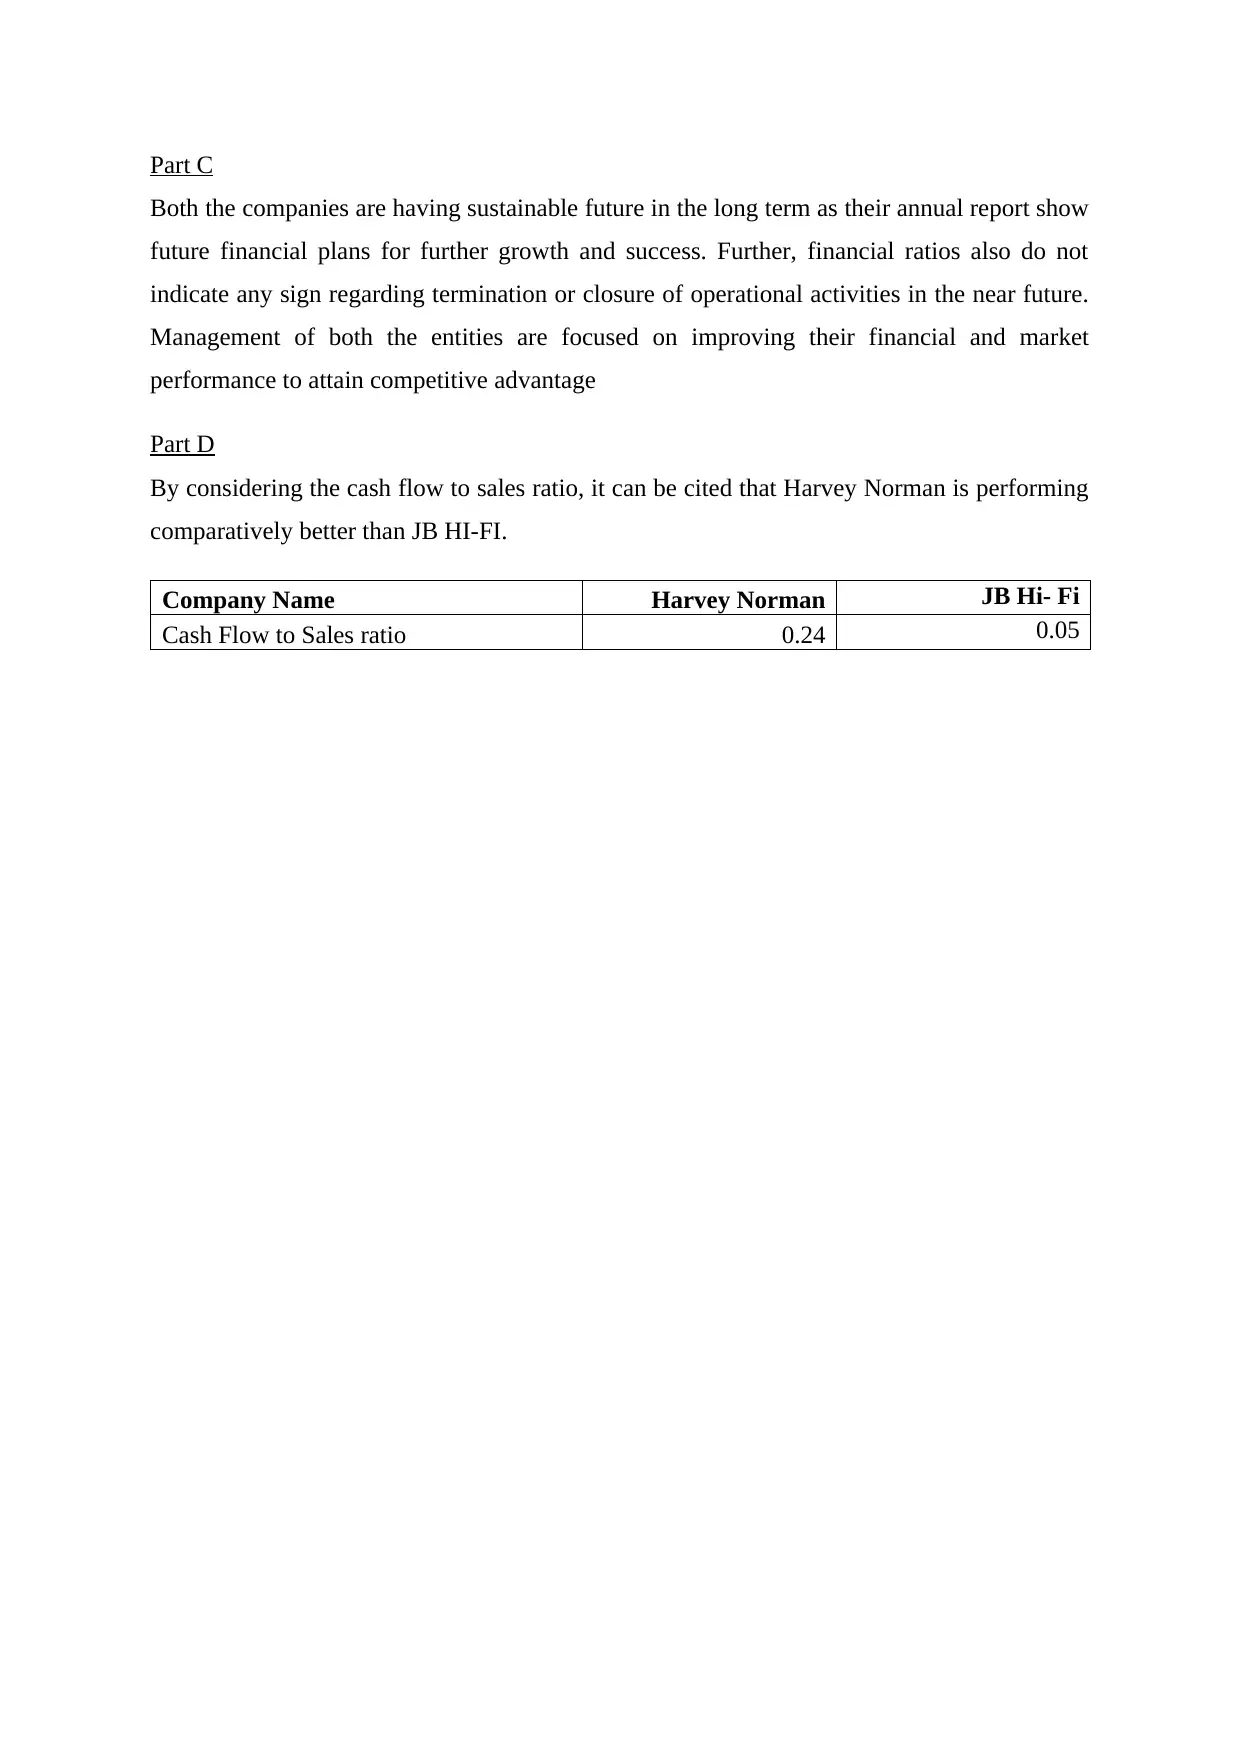
Part C
Both the companies are having sustainable future in the long term as their annual report show
future financial plans for further growth and success. Further, financial ratios also do not
indicate any sign regarding termination or closure of operational activities in the near future.
Management of both the entities are focused on improving their financial and market
performance to attain competitive advantage
Part D
By considering the cash flow to sales ratio, it can be cited that Harvey Norman is performing
comparatively better than JB HI-FI.
Company Name Harvey Norman JB Hi- Fi
Cash Flow to Sales ratio 0.24 0.05
Paraphrase This Document
Need a fresh take? Get an instant paraphrase of this document with our AI Paraphraser
REFERENCES
Books and Journals
Brigham, E. and Ehrhardt, M., (2013). Financial management: Theory & practice. Cengage
Learning
Chandrasekaran, R., Manimannan, G. and Kumar, C.A., (2013). Assessment of Top Ranking
Companions Using Financial Ratios. In International Journal of Engineering
Research and Technology. ESRSA Publications.
Halim, M.S.A., Osman, O. and Haniff, M.S., (2012). Financial Ratio Analysis: An
Assessment of Malaysian
Healy, P. and Palepu, K., (2012). Business Analysis Valuation: Using Financial Statements.
Cengage Learning.
Ormiston, A. and Fraser, L.M., (2013). Understanding financial statements. Pearson
Education.
Saunders, A., Cornett, M. M., and McGraw, P. A. (2006). Financial institutions
management: A risk management approach. McGraw-Hill/Irwin.
Strumickas, M. and Valanciene, L., (2015). Development of Modern Management
Accounting System. Engineering Economics. 21(4).
Online
Annual report of JB HI FI. (2016). [PDF]. Available through <
https://www.jbhifi.com.au/Documents/2016%20JB%20Hi-Fi%20Annual
%20Report_ASX.pdf >. [Accessed on 1st September 2017].
Annual report of Harvey Norman. (2016). [PDF]. Available through <
http://www.harveynormanholdings.com.au/pdf_files/2012_Annual_Report_Final.pdf
>. [Accessed on 1st September 2017].

⊘ This is a preview!⊘
Do you want full access?
Subscribe today to unlock all pages.
Trusted by 1+ million students worldwide
1 out of 14
Related Documents


Your All-in-One AI-Powered Toolkit for Academic Success.
+13062052269
info@desklib.com
Available 24*7 on WhatsApp / Email
![[object Object]](/_next/static/media/star-bottom.7253800d.svg)
Unlock your academic potential
Copyright © 2020–2026 A2Z Services. All Rights Reserved. Developed and managed by ZUCOL.