MOD003319: Cash Management and Financial Ratio Analysis Report
VerifiedAdded on 2021/11/15
|12
|3401
|61
Report
AI Summary
This report is divided into two parts, analyzing cash management and financial ratio analysis for two companies, MGD and GlowSheet. Part 1 focuses on MGD, examining the importance of cash flow versus profit, working capital components (receivables, inventory, payables), and the impact of working capital changes. It identifies MGD's poor inventory management, issues with accounts receivables, and recommends strategies to improve cash flow, including better inventory management, improved accounts receivable practices, utilizing updated financial information, and reducing expenses. Part 2 evaluates the financial performance of GlowSheet Limited for the National Interest Bank (NIB) using financial ratio analysis. It calculates and analyzes sales growth, gross profit margin, and operating profit margin over three years, providing insights into the company's financial health and making recommendations to the bank. The report provides a comprehensive analysis of financial performance and offers recommendations for improved financial management.
Business Finance
MOD003319
1
MOD003319
1
Paraphrase This Document
Need a fresh take? Get an instant paraphrase of this document with our AI Paraphraser
Contents
Part 1: Management of cash............................................................................................................3
Executive Summary.....................................................................................................................3
Section (i).........................................................................................................................................3
A: Meaning of Profit and Cash Flow and their Difference..........................................................3
B: Meaning of Working Capital and, Receivables, Inventory and Payables...............................3
C: Impact of Changes in Working Capital on the Cash flow.......................................................4
Section (ii).......................................................................................................................................4
Section (iii)......................................................................................................................................5
Part 2: Financial Ratio Analysis......................................................................................................7
Executive Summary.........................................................................................................................7
(i): Analysis and Calculation of Financial Ratios............................................................................7
(ii): Analysis and recommendation through which bank can assess the financial performance of
the business....................................................................................................................................11
References......................................................................................................................................12
2
Part 1: Management of cash
Executive Summary
This report is developed for the shareholders of the MGD Company, involved in
production of luxury garden furniture for the clients that are larger retailers in the UK and EU. In
this context, this report aims to analyze and examine the working capital issue that is faced by
the company at present as depicted in the case study.
Section (i)
A: Meaning of Profit and Cash Flow and their Difference
Profit and cash flow are regarded to be very important parameters for running a business
and thus it is very essential for them to be regularly viewed and monitored. Cash flow can be
regarded as the money that flows in and out of the business resulting from its operational,
financial and investing activities. The businesses need to maintain an adequate flow of cash for
meeting its financial obligations that can become due within a short period of time. The profit of
a business refers to the difference present between the gross incomes by deduction of business
expenses for a specified period of time. Thus, there exists a significant difference between the
profits and cash flows as the concept of profit can be regarded as limited as it helps in
determination of any income and expenses realized by a business at a certain point of time. On
the other hand, cash flow concept is more dynamic as it is more helpful in depicting the business
reality. This is because a company can have positive cash flow despite having no profits if the
cash realized comes from other source of income. Similarly, it can negative cash flows despite
having larger profits if the cash is invested in other business activities such as meeting expenses.
The businesses in order to promote its growth over long-term aims to achieve sustained
profitability while the presence of sufficient cash balance is required for carrying out daily
operational activities of a firm (Watson (2), 2016).
B: Meaning of Working Capital and, Receivables, Inventory and Payables
Working capital is regarded as a major indicator of the overall liquidity, efficiency and
overall financial health of a company. This is because it reflects accurately the difference
3
⊘ This is a preview!⊘
Do you want full access?
Subscribe today to unlock all pages.
Trusted by 1+ million students worldwide
between the current assets such as cash, accounts receivables and inventories and the current
liabilities such as accounts payable of a company. As such, it can be regarded as a major
indicator of the operational efficiency and short-term financial health of a company. It is required
that businesses need to have an adequate working capital as low level can results in negatively
impacting the growth potential of the company. However, the overinvestment in working capital
can also result in destruction of value for shareholders as it required additional funds that can
lead to rise within the financing and opportunity costs. Accounts receivables can be regarded as
the amount to be collected by a company on the goods and services sold on credit to the
customer. On the other hand, accounts payable is the amount that is owned by a company on the
purchase of goods or services on credit from supplier. Inventory can be regarded as the term that
is used for the goods that are in various stages of production or are ready to be sold that includes
finished goods, work-in-progress and raw materials (Atrill (1), 2014).
C: Impact of Changes in Working Capital on the Cash flow
The impact of working capital changes are adequately reflected within the cash flow
statement of a firm. The positive working capital depicts the inflow of cash for a specific period
of time under the measurement. However, on the other hand, a negative working capital reflects
the outflow of cash which means that there are more outflows of cash in comparison to the cash
inflow that can occur due to purchase of products and services from the suppliers. The changes
occurring within the working capital are depicted within its cash flow statement. The cash
transaction that leads to an increase within the current assets and liabilities by the same amount
would result in having no change within the working capital. For example, if a firm realizes cash
from short-term debt that is to be repaid within a period of 60 days then it would result in
increasing the amount of cash inflows but will not have any impact on the working capital as it
will also have an increase in the current liability. However, if it acquires fixed assets such as
building then it would result in decreasing in the cash flow as well as working capital.
Section (ii)
After applying the concepts of working capital management in case of Modern Garden
Designs Ltd (“MGD”) it can be said that company has failed to manage its working capital
practices effectively. The two major issues that were noticed in case of MGD was poor inventory
4
Paraphrase This Document
Need a fresh take? Get an instant paraphrase of this document with our AI Paraphraser
management. It has been found that company has failed to deliver the order that was placed by
D&R last year, despite of recognition of full amount from the customer. It will increase chances
of dispute and customers can start claiming back the advance with interest on it. Last year, MGD
had invested huge amount of money in Eastern Fires that has raised the debt of company from
pound 120 million pounds to 157 pounds. This is a serious problem as in future year MGD might
had to struggle with requirement of working capital. MGD has also paid the advance fee of 8
million pound without proper evaluation of project.
The second major issue that has been found was a problem that has risen due to disputes
and there was no counter liabilities have been made in balance sheet. So it was highly important
that company should make proper contingent liabilities and save the retained earnings in case of
need for the emergency working capital but MGD had failed to do so.
Section (iii)
The company is recommended to adopt the following measures for improving the
working capital management:
Improving Accounts Receivables: The Company is required to continually review the
collection of its outstanding invoices so that they do not become due for a long period of
time that can result in causing insufficient working capital. For example, it is depicted in
the case study of MGD that it is having an outstanding debt of about £20 million for
BricoFrance whose order is complete in the year 2017. Thus, it is required that the
company should adopt better system of managing its accounts receivables.
Managing Inventory: It is required on the part of the company that it should not overstock
the inventory and make sure that the finished goods are sold to the customers after
receiving the order from them. This will help in promoting the goodwill of the company
among its customers such as D&R. The company is required to better manage its
inventory level and should not invest the amount incurred from its customers for other
activities such as that carried out by MGD. MGD has paid advance fees of about £8
million and also invested £ 10 million in Eastern Fires, a designing company. It also owes
£12 million for a large order placed by one of its customer D&R and is using the funds
5
for other business activities rather than managing its inventory level to manufacture the
finished goods (Atrill (1), 2014).
Using updated financial information: The Company should adopt the use of latest
financial statements for gaining an analysis of the clear picture of its financial position for
identifying effective ways of better management of cash flow. This requires on the part of
the company to regularly assess the ratios on a periodic basis for identifying the areas of
improvement.
Reduction in Expenses: It has been depicted from the case study given that the company
is incurring larger operating expenses that are also a major source of problem faced by it
in relation to the working capital management. Therefore, it is essential on the part of
business managers of MGD that it should continually review the fixed and variable costs
for identifying the areas of improving the cash flows and leading to better management of
working capital (Aktas, Croci and Petmeza, 2015).
6
⊘ This is a preview!⊘
Do you want full access?
Subscribe today to unlock all pages.
Trusted by 1+ million students worldwide
Part 2: Financial Ratio Analysis
Executive Summary
The purpose of this part of the assignment is to prepare the report for National Interest
Bank (NIB) to provide information on the financial health of GlowSheet Limited. To evaluate
the financial health of the company, it has been decided make use of financial ratios as it is most
effective financial tool. Various ratios are calculated through use of given financial data for last
three years and trend is evaluated to assess the financial performance of the company and make
recommendation to the bank.
(i): Analysis and Calculation of Financial Ratios
This section of the assignment will define and calculate various financial ratios to
evaluate the financial performance of GlowSheet Limited and to provide information on how
ratios have changed during the last three years of analysis.
Sales Growth: Sales growth refers to change in current year sales values in respect to previous
year value. Increase in value of sales figure represents increased sales growth and decrease in
sales value figures represents sales decline in respective year. This ratio helps to evaluate the
management capability to use resources to earn the maximum sales (Brigham and Michael,
2013).
Formula: Sales Y2 - sales Y1)/sales Y1
Particulars 2009 2010 2011
All Figure in '000
Sales £ 250.00 £ 275.00 £ 319.00
Sales Growth in % 10.00% 16.00%
Above table represents sales growth (in percentage) values of GlowSheet Limited in year
2010 and 2011 with respect to year 2009 and 2010 respectively. There has been increasing trend
in sales growth as in year 2010, sales has been increased by 10% and in year 2011 it got
7
Paraphrase This Document
Need a fresh take? Get an instant paraphrase of this document with our AI Paraphraser
increased by 16%. The demand in year 2010 has increased sharply and in year 2011 it increases
even more as expected by the owner of the company. Sales have increased due to high demand in
market (Atrill (2), 2014).
Gross Profit Margin: Gross profit Margin refers to profitability ratios as it measures the gross
profit earned as the percentage of sales value. This ratio helps to evaluate the sales as well as cost
of sales figure of the company (Brigham and Michael, 2013).
Formula: Gross Profit/Sales (%)
Particulars 2009 2010 2011
All Figure in '000
Sales £ 250.00 £ 275.00 £ 319.00
Cost of Sales £ 90.00 £ 100.00 £ 130.00
Gross Profit £ 160.00 £ 175.00 £ 189.00
Gross Profit Margin 64.00% 63.64% 59.25%
On the basis of above table it can be said that gross profit margin of the company has
decreasing trend despite of increase in sales in last two years. The gross profit margin has
decreased due to increase in cost of sales year to year. It will be good to say that gross profit
margin was almost same in last three years and it might be due to not major change in cost of
sales expenses or cost of sales have increased in proportion of sales figure (Damodaran, 2011).
Operating profit margin: Operating Profit Margin is also referred to as profitability ratio as it
reflects the operating profit earned as the percentage of sales figure. This ratio is important as it
pinpoint the increase or decrease in operating expenses as compared to sales (Davies and
Crawford, 2011).
Formula: Operating Profit/Sales (%)
Particulars 2009 2010 2011
All Figure in '000
Sales £ 250.00 £ 275.00 £ 319.00
Operating Profit £ 75.00 £ 70.00 £ 34.00
8
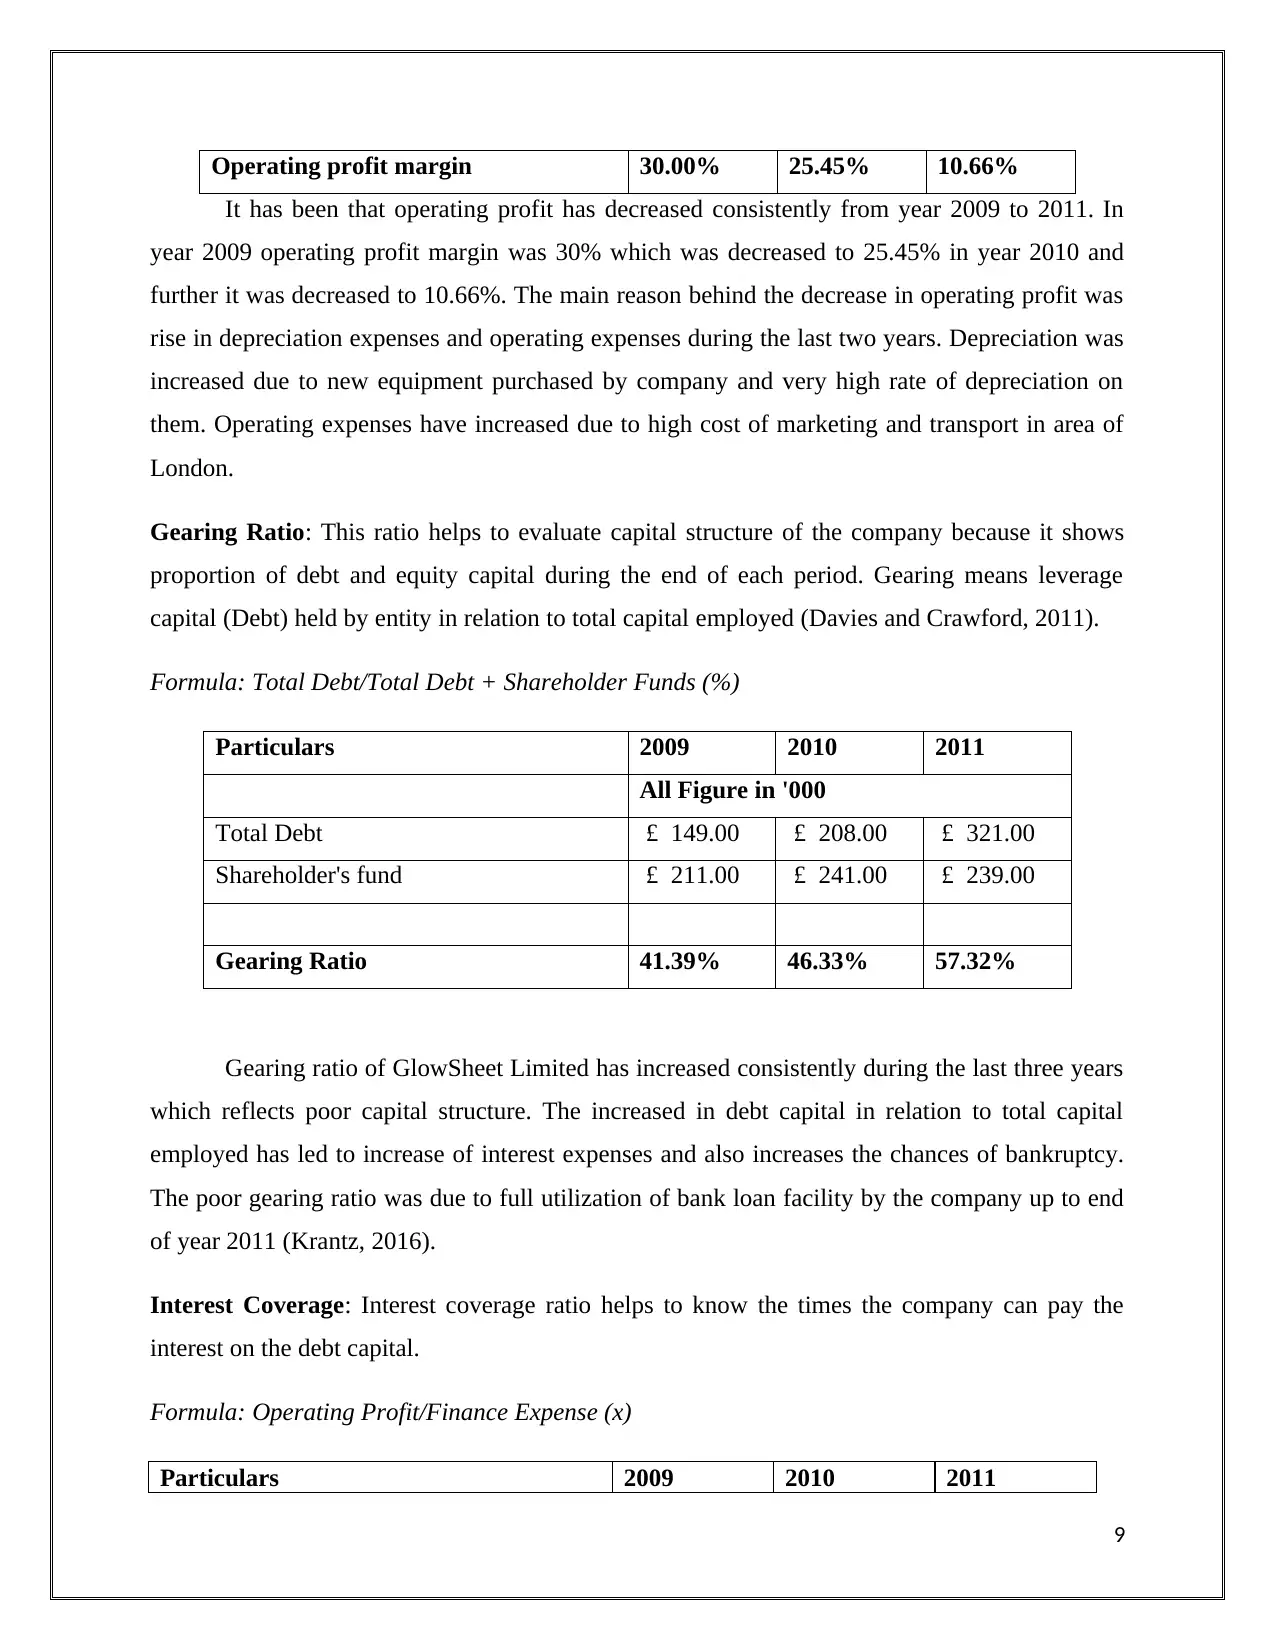
Operating profit margin 30.00% 25.45% 10.66%
It has been that operating profit has decreased consistently from year 2009 to 2011. In
year 2009 operating profit margin was 30% which was decreased to 25.45% in year 2010 and
further it was decreased to 10.66%. The main reason behind the decrease in operating profit was
rise in depreciation expenses and operating expenses during the last two years. Depreciation was
increased due to new equipment purchased by company and very high rate of depreciation on
them. Operating expenses have increased due to high cost of marketing and transport in area of
London.
Gearing Ratio: This ratio helps to evaluate capital structure of the company because it shows
proportion of debt and equity capital during the end of each period. Gearing means leverage
capital (Debt) held by entity in relation to total capital employed (Davies and Crawford, 2011).
Formula: Total Debt/Total Debt + Shareholder Funds (%)
Particulars 2009 2010 2011
All Figure in '000
Total Debt £ 149.00 £ 208.00 £ 321.00
Shareholder's fund £ 211.00 £ 241.00 £ 239.00
Gearing Ratio 41.39% 46.33% 57.32%
Gearing ratio of GlowSheet Limited has increased consistently during the last three years
which reflects poor capital structure. The increased in debt capital in relation to total capital
employed has led to increase of interest expenses and also increases the chances of bankruptcy.
The poor gearing ratio was due to full utilization of bank loan facility by the company up to end
of year 2011 (Krantz, 2016).
Interest Coverage: Interest coverage ratio helps to know the times the company can pay the
interest on the debt capital.
Formula: Operating Profit/Finance Expense (x)
Particulars 2009 2010 2011
9
⊘ This is a preview!⊘
Do you want full access?
Subscribe today to unlock all pages.
Trusted by 1+ million students worldwide
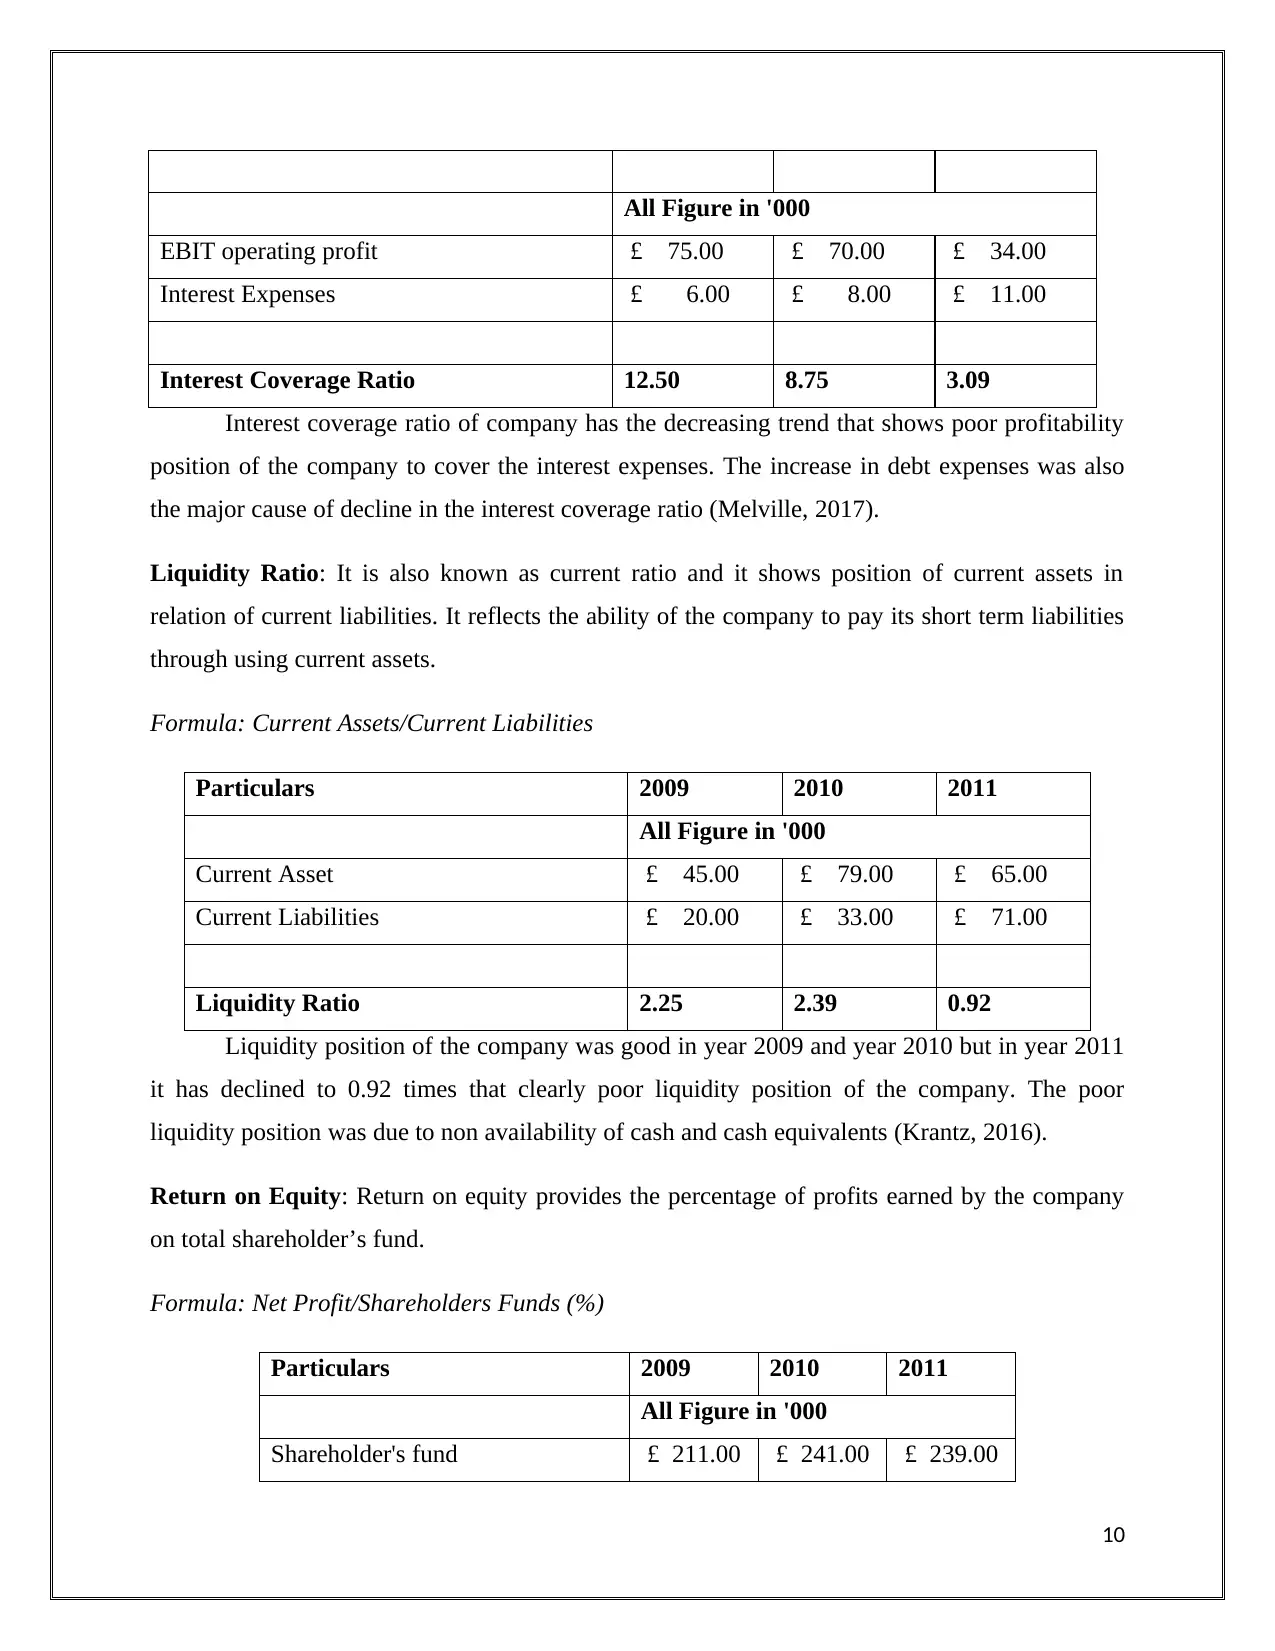
All Figure in '000
EBIT operating profit £ 75.00 £ 70.00 £ 34.00
Interest Expenses £ 6.00 £ 8.00 £ 11.00
Interest Coverage Ratio 12.50 8.75 3.09
Interest coverage ratio of company has the decreasing trend that shows poor profitability
position of the company to cover the interest expenses. The increase in debt expenses was also
the major cause of decline in the interest coverage ratio (Melville, 2017).
Liquidity Ratio: It is also known as current ratio and it shows position of current assets in
relation of current liabilities. It reflects the ability of the company to pay its short term liabilities
through using current assets.
Formula: Current Assets/Current Liabilities
Particulars 2009 2010 2011
All Figure in '000
Current Asset £ 45.00 £ 79.00 £ 65.00
Current Liabilities £ 20.00 £ 33.00 £ 71.00
Liquidity Ratio 2.25 2.39 0.92
Liquidity position of the company was good in year 2009 and year 2010 but in year 2011
it has declined to 0.92 times that clearly poor liquidity position of the company. The poor
liquidity position was due to non availability of cash and cash equivalents (Krantz, 2016).
Return on Equity: Return on equity provides the percentage of profits earned by the company
on total shareholder’s fund.
Formula: Net Profit/Shareholders Funds (%)
Particulars 2009 2010 2011
All Figure in '000
Shareholder's fund £ 211.00 £ 241.00 £ 239.00
10
Paraphrase This Document
Need a fresh take? Get an instant paraphrase of this document with our AI Paraphraser
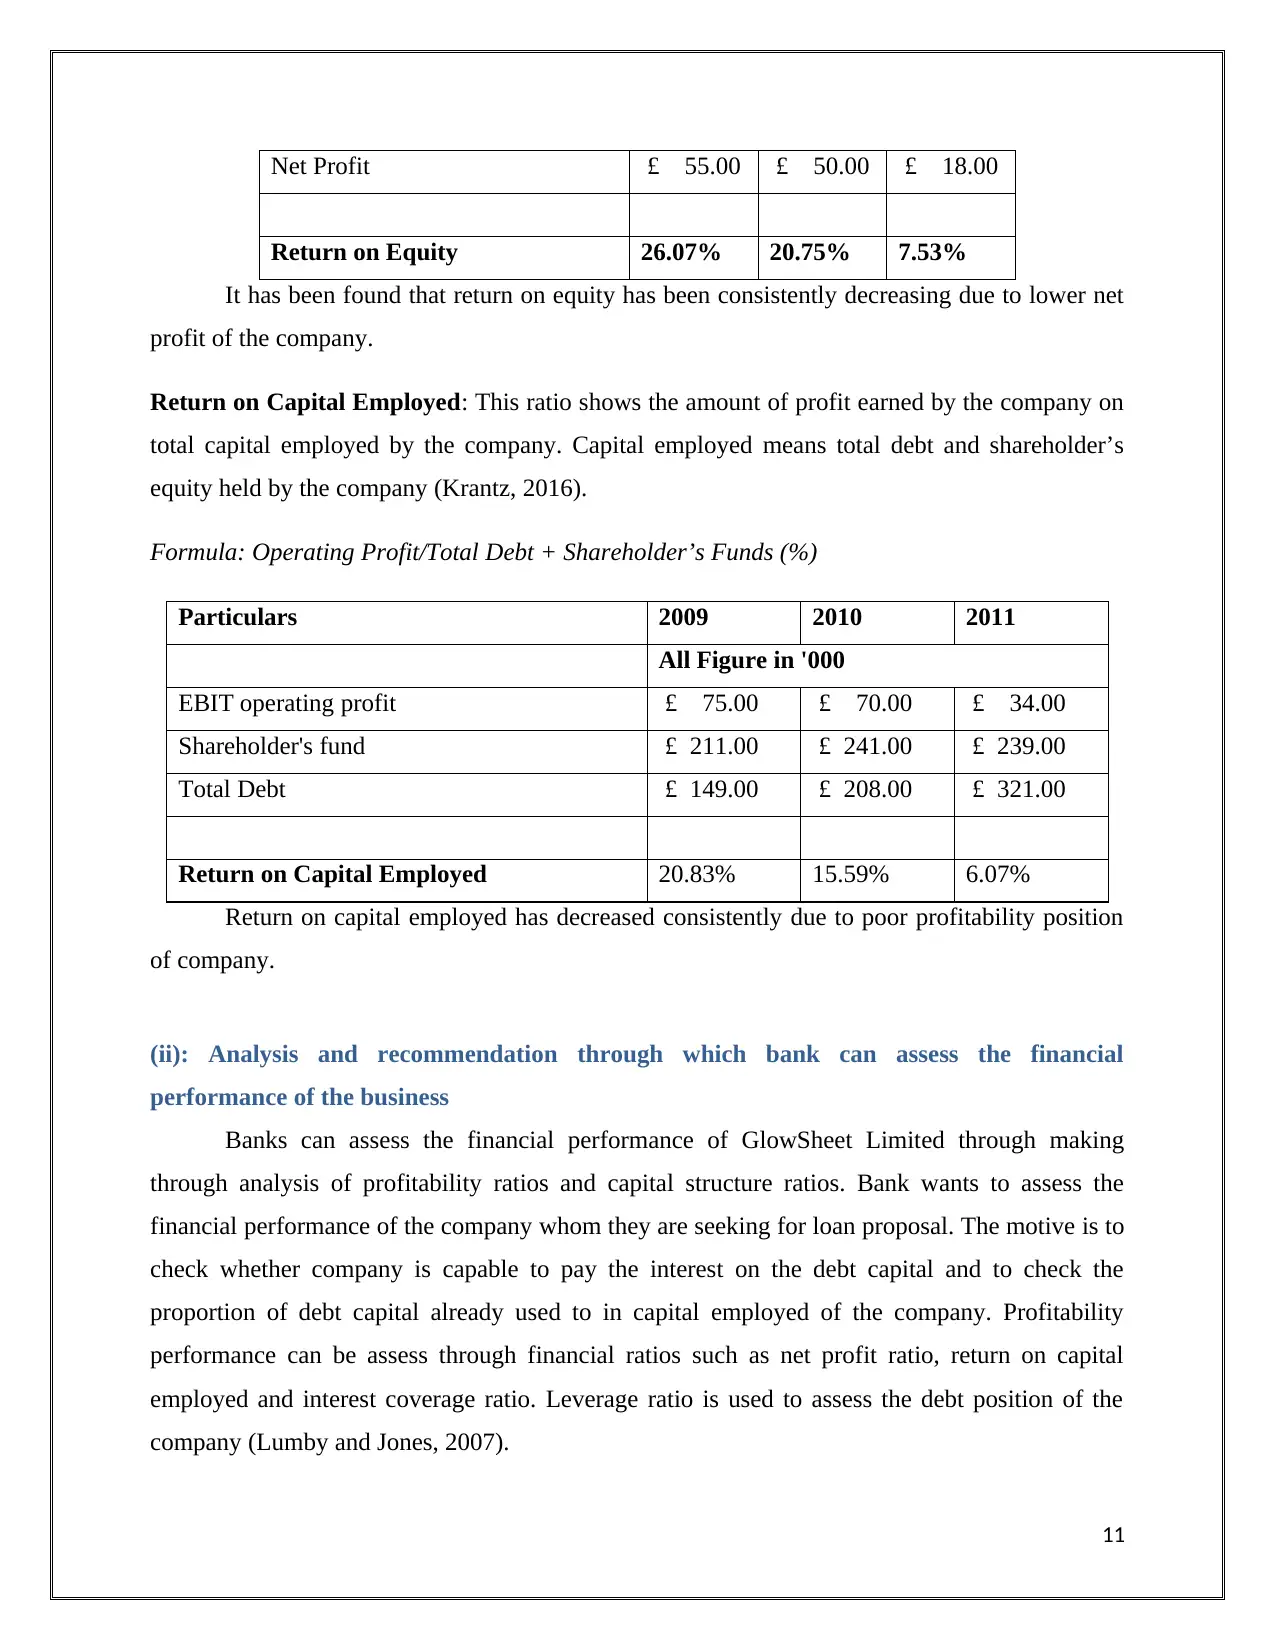
Net Profit £ 55.00 £ 50.00 £ 18.00
Return on Equity 26.07% 20.75% 7.53%
It has been found that return on equity has been consistently decreasing due to lower net
profit of the company.
Return on Capital Employed: This ratio shows the amount of profit earned by the company on
total capital employed by the company. Capital employed means total debt and shareholder’s
equity held by the company (Krantz, 2016).
Formula: Operating Profit/Total Debt + Shareholder’s Funds (%)
Particulars 2009 2010 2011
All Figure in '000
EBIT operating profit £ 75.00 £ 70.00 £ 34.00
Shareholder's fund £ 211.00 £ 241.00 £ 239.00
Total Debt £ 149.00 £ 208.00 £ 321.00
Return on Capital Employed 20.83% 15.59% 6.07%
Return on capital employed has decreased consistently due to poor profitability position
of company.
(ii): Analysis and recommendation through which bank can assess the financial
performance of the business
Banks can assess the financial performance of GlowSheet Limited through making
through analysis of profitability ratios and capital structure ratios. Bank wants to assess the
financial performance of the company whom they are seeking for loan proposal. The motive is to
check whether company is capable to pay the interest on the debt capital and to check the
proportion of debt capital already used to in capital employed of the company. Profitability
performance can be assess through financial ratios such as net profit ratio, return on capital
employed and interest coverage ratio. Leverage ratio is used to assess the debt position of the
company (Lumby and Jones, 2007).
11
On the basis of above calculations it has been found that GlowSheet Limited has very
poor financial performance in year 2011. Profitability position was the worst in year 2011 as
compared to other years. Interest coverage ratio has been decreased despite of increase in sales.
The root cause was increase in operating expenses and also the increase in debt capital in year
2011. So it is highly recommended to the NIB Bank, not to consider the application of increase
in extension in bank loan by the CEO of the company (Watson (1), 2016).
References
Aktas, Croci, and Petmeza. 2015. Is Working Capital Management Value- Enhancing. Journal of
Corporate Finance, 30, pp. 98-113.
Atrill (1). 2014. Financial Management for Decision Makers. 7th ed. London FT Prentice Hall.
Chapter 10 - Working Capital.
Atrill (2). 2014. Financial Management for Decision Makers. 7th ed. London FT Prentice Hall.
Chapter6- Analyzing and Interpreting Financial Statements.
Brigham, F., and Michael C. 2013. Financial management: Theory & practice. Cengage
Learning.
Damodaran, A, 2011. Applied corporate finance. John Wiley & sons.
Davies, T. and Crawford, I., 2011. Business accounting and finance. Pearson.
Krantz, M. 2016. Fundamental Analysis for Dummies. John Wiley & Sons.
Lumby,S and Jones,C. 2007. Corporate finance theory & practice. Thomson.
Melville. 2017. International Financial Reporting, A Practical Guide. 6th ed. London Pearson.
Chapter 22: Ratio Analysis.
Watson (1), H. 2016. Corporate Finance. 7th ed. London Pearson. Chapter 2 - Assessing
Financial Performance.
Watson (2), H. 2016. Corporate Finance. 7th ed. London Pearson. Chapter 3 - Working Capital.
12
⊘ This is a preview!⊘
Do you want full access?
Subscribe today to unlock all pages.
Trusted by 1+ million students worldwide
1 out of 12
Related Documents


Your All-in-One AI-Powered Toolkit for Academic Success.
+13062052269
info@desklib.com
Available 24*7 on WhatsApp / Email
![[object Object]](/_next/static/media/star-bottom.7253800d.svg)
Unlock your academic potential
Copyright © 2020–2026 A2Z Services. All Rights Reserved. Developed and managed by ZUCOL.