Ship'emIn&Out: Cash Flow Statement and Financial Analysis Report

Verified

Added on  2022/11/29

|4
|653
|199
Report
AI Summary
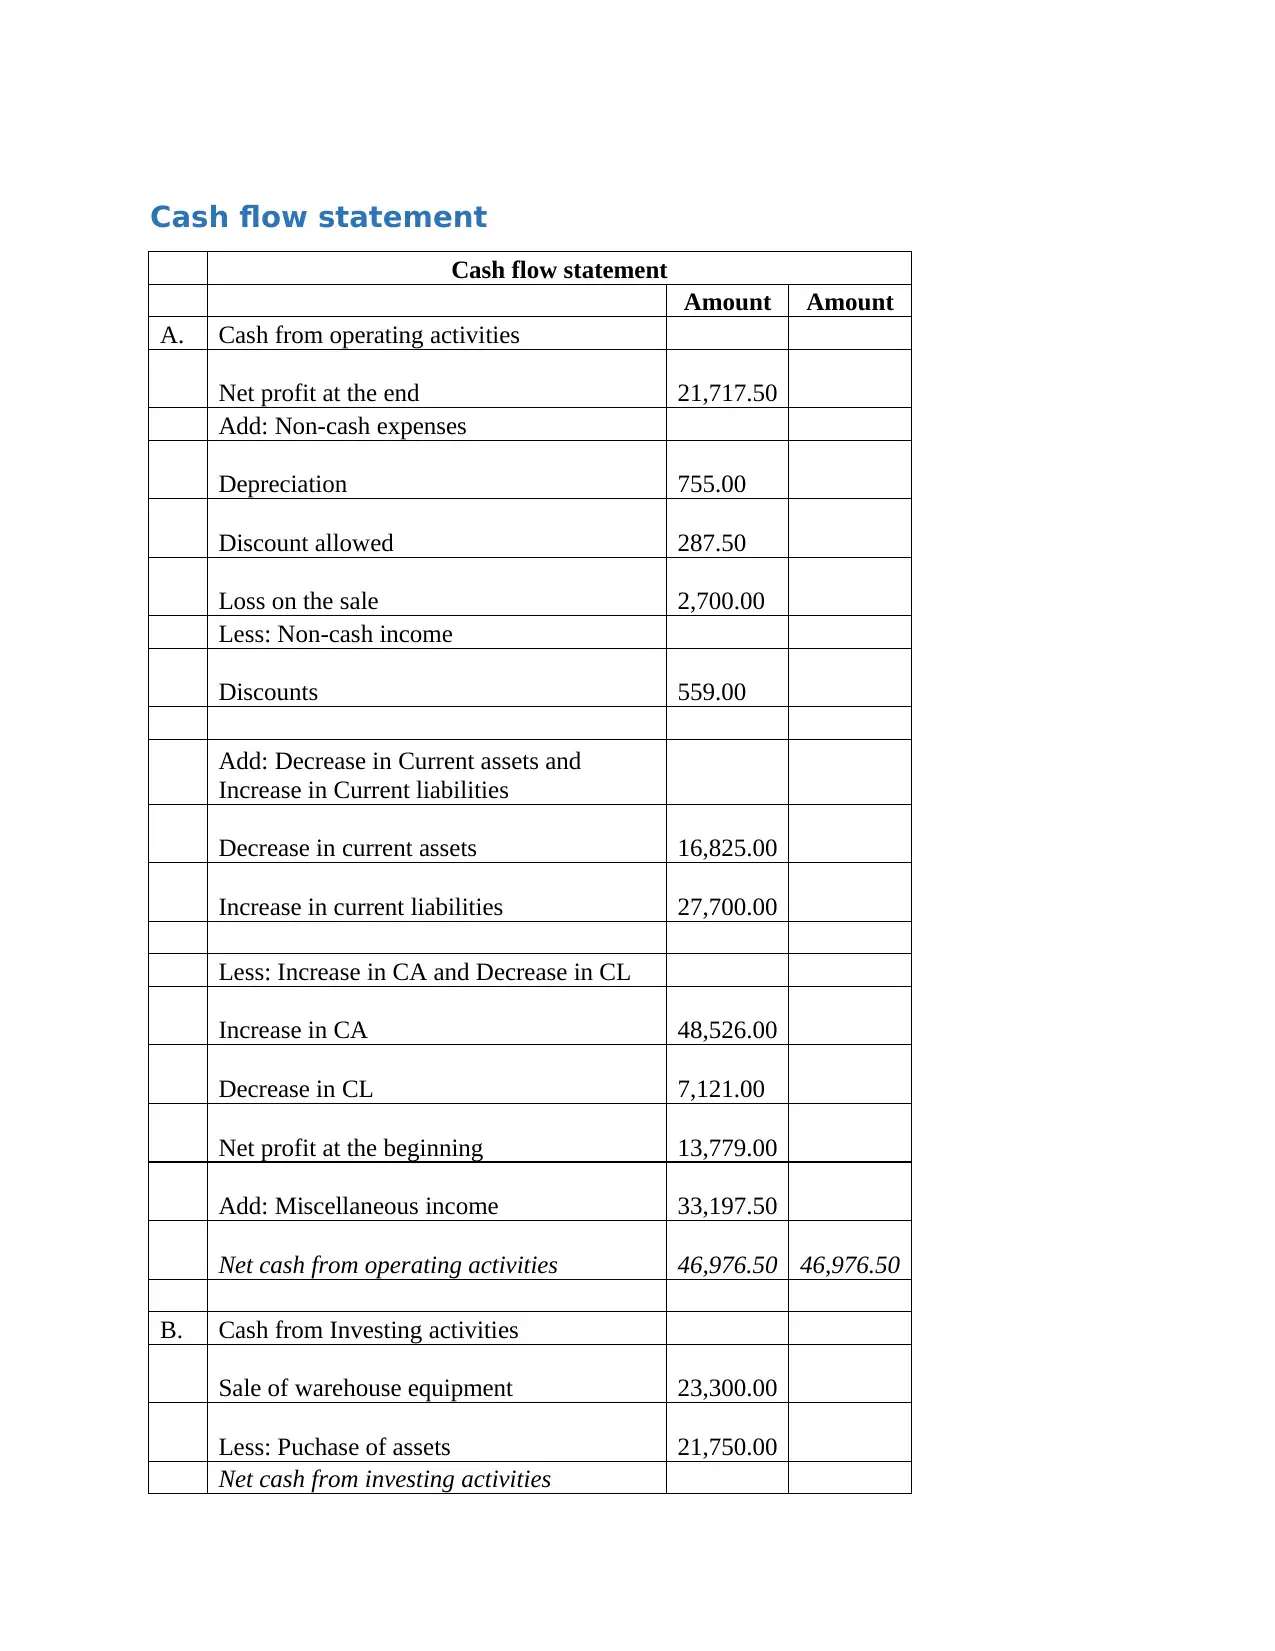
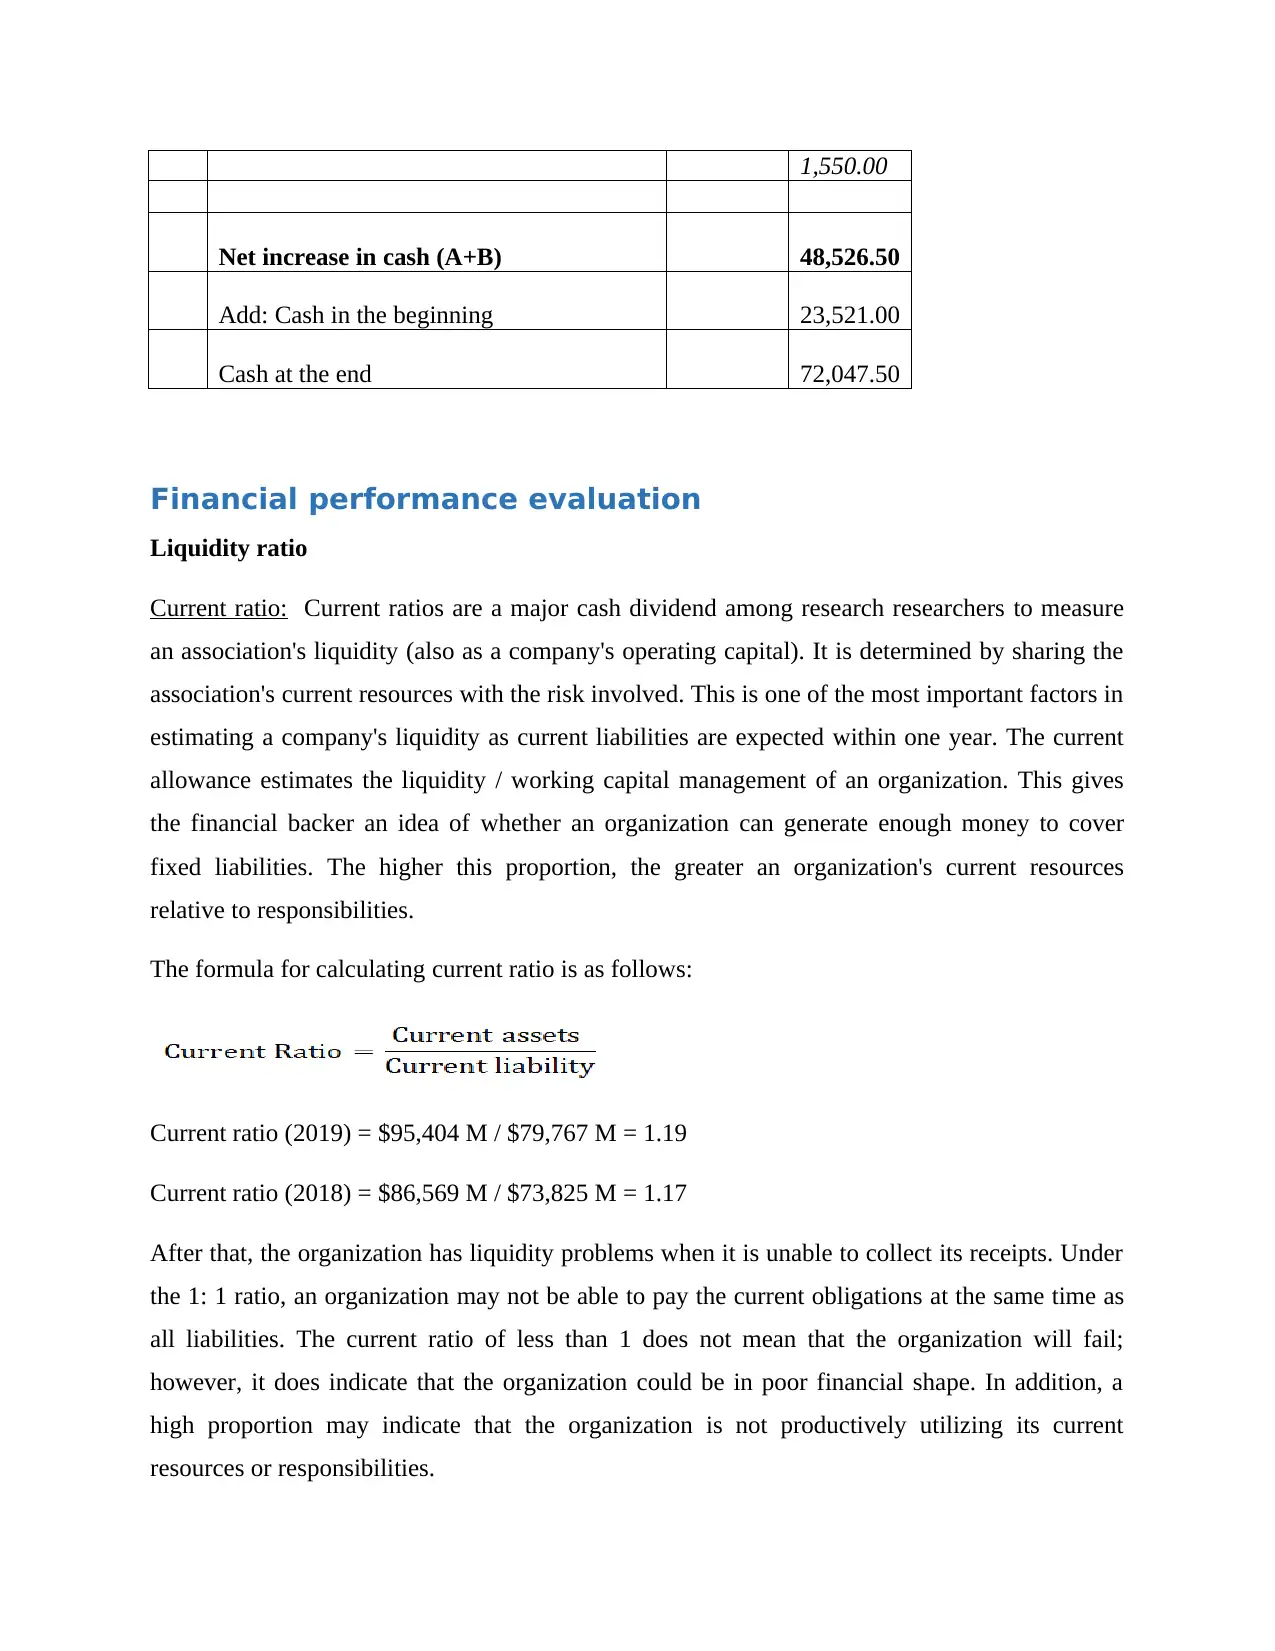
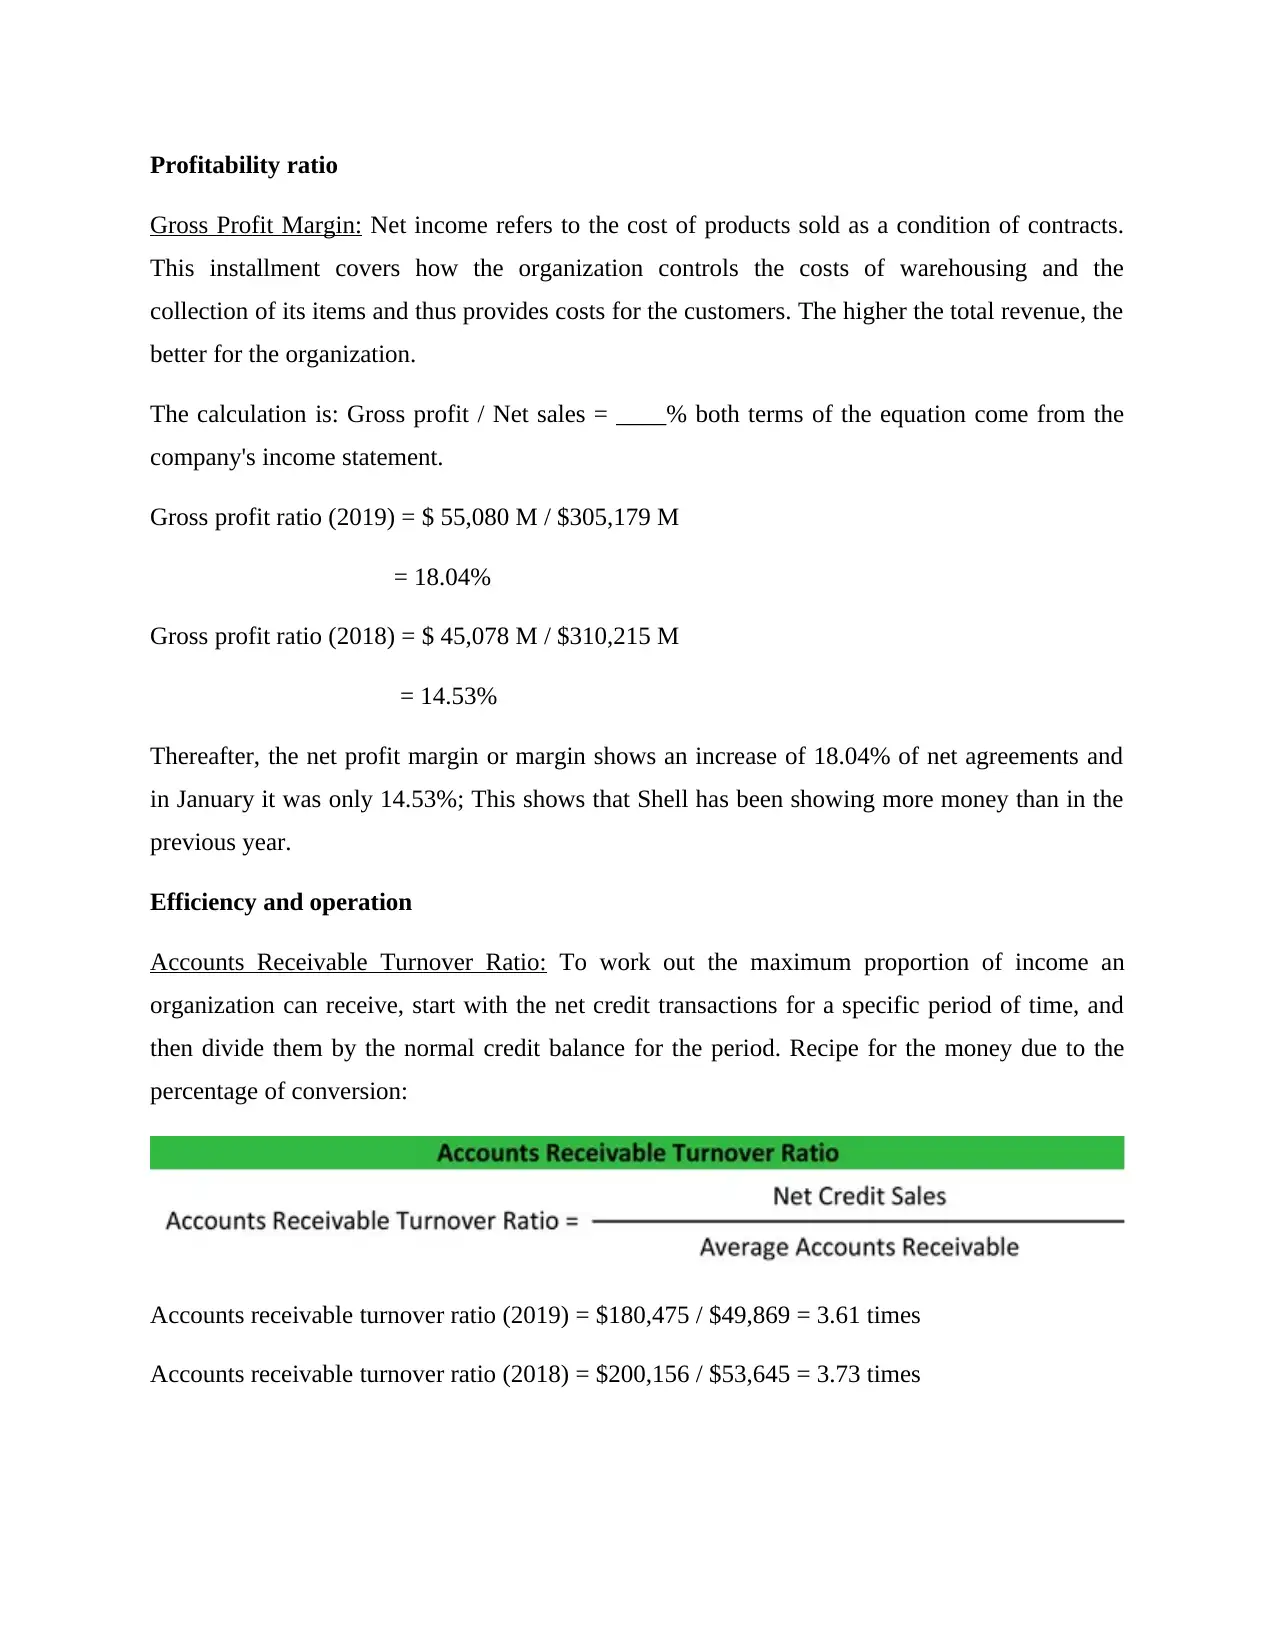
This report presents a cash flow statement and financial analysis for Ship'emIn&Out, a wholesale business specializing in electronic equipment. The analysis includes the preparation of a cash flow statement, followed by an evaluation of the company's financial position using key financial ratios. The cash flow statement details cash from operating, investing, and financing activities. The financial analysis focuses on liquidity ratios (current ratio), profitability ratios (gross profit margin), and efficiency ratios (accounts receivable turnover ratio) to assess the company's performance and financial health. The report provides calculations and interpretations of these ratios for the years 2018 and 2019, highlighting trends and insights into the company's financial management. The report is based on the provided trial balance data and aims to provide a comprehensive overview of Ship'emIn&Out's financial performance.
Document Page
Cash flow and Financial
Analysis Shipem
In & Out
tabler-icon-diamond-filled.svg

Paraphrase This Document

Need a fresh take? Get an instant paraphrase of this document with our AI Paraphraser
Document Page
Cash flow statement
Cash flow statement
Amount Amount
A. Cash from operating activities
Net profit at the end 21,717.50
Add: Non-cash expenses
Depreciation 755.00
Discount allowed 287.50
Loss on the sale 2,700.00
Less: Non-cash income
Discounts 559.00
Add: Decrease in Current assets and
Increase in Current liabilities
Decrease in current assets 16,825.00
Increase in current liabilities 27,700.00
Less: Increase in CA and Decrease in CL
Increase in CA 48,526.00
Decrease in CL 7,121.00
Net profit at the beginning 13,779.00
Add: Miscellaneous income 33,197.50
Net cash from operating activities 46,976.50 46,976.50
B. Cash from Investing activities
Sale of warehouse equipment 23,300.00
Less: Puchase of assets 21,750.00
Net cash from investing activities
Document Page
1,550.00
Net increase in cash (A+B) 48,526.50
Add: Cash in the beginning 23,521.00
Cash at the end 72,047.50
Financial performance evaluation
Liquidity ratio
Current ratio: Current ratios are a major cash dividend among research researchers to measure
an association's liquidity (also as a company's operating capital). It is determined by sharing the
association's current resources with the risk involved. This is one of the most important factors in
estimating a company's liquidity as current liabilities are expected within one year. The current
allowance estimates the liquidity / working capital management of an organization. This gives
the financial backer an idea of whether an organization can generate enough money to cover
fixed liabilities. The higher this proportion, the greater an organization's current resources
relative to responsibilities.
The formula for calculating current ratio is as follows:
Current ratio (2019) = $95,404 M / $79,767 M = 1.19
Current ratio (2018) = $86,569 M / $73,825 M = 1.17
After that, the organization has liquidity problems when it is unable to collect its receipts. Under
the 1: 1 ratio, an organization may not be able to pay the current obligations at the same time as
all liabilities. The current ratio of less than 1 does not mean that the organization will fail;
however, it does indicate that the organization could be in poor financial shape. In addition, a
high proportion may indicate that the organization is not productively utilizing its current
resources or responsibilities.
Document Page
Profitability ratio
Gross Profit Margin: Net income refers to the cost of products sold as a condition of contracts.
This installment covers how the organization controls the costs of warehousing and the
collection of its items and thus provides costs for the customers. The higher the total revenue, the
better for the organization.
The calculation is: Gross profit / Net sales = ____% both terms of the equation come from the
company's income statement.
Gross profit ratio (2019) = $ 55,080 M / $305,179 M
= 18.04%
Gross profit ratio (2018) = $ 45,078 M / $310,215 M
= 14.53%
Thereafter, the net profit margin or margin shows an increase of 18.04% of net agreements and
in January it was only 14.53%; This shows that Shell has been showing more money than in the
previous year.
Efficiency and operation
Accounts Receivable Turnover Ratio: To work out the maximum proportion of income an
organization can receive, start with the net credit transactions for a specific period of time, and
then divide them by the normal credit balance for the period. Recipe for the money due to the
percentage of conversion:
Accounts receivable turnover ratio (2019) = $180,475 / $49,869 = 3.61 times
Accounts receivable turnover ratio (2018) = $200,156 / $53,645 = 3.73 times
chevron_up_icon
1 out of 4
circle_padding
hide_on_mobile
zoom_out_icon
[object Object]