Cathay Pacific: Revenue, Cost Structures, and Profitability Analysis
VerifiedAdded on  2022/10/09
|12
|1889
|462
Report
AI Summary
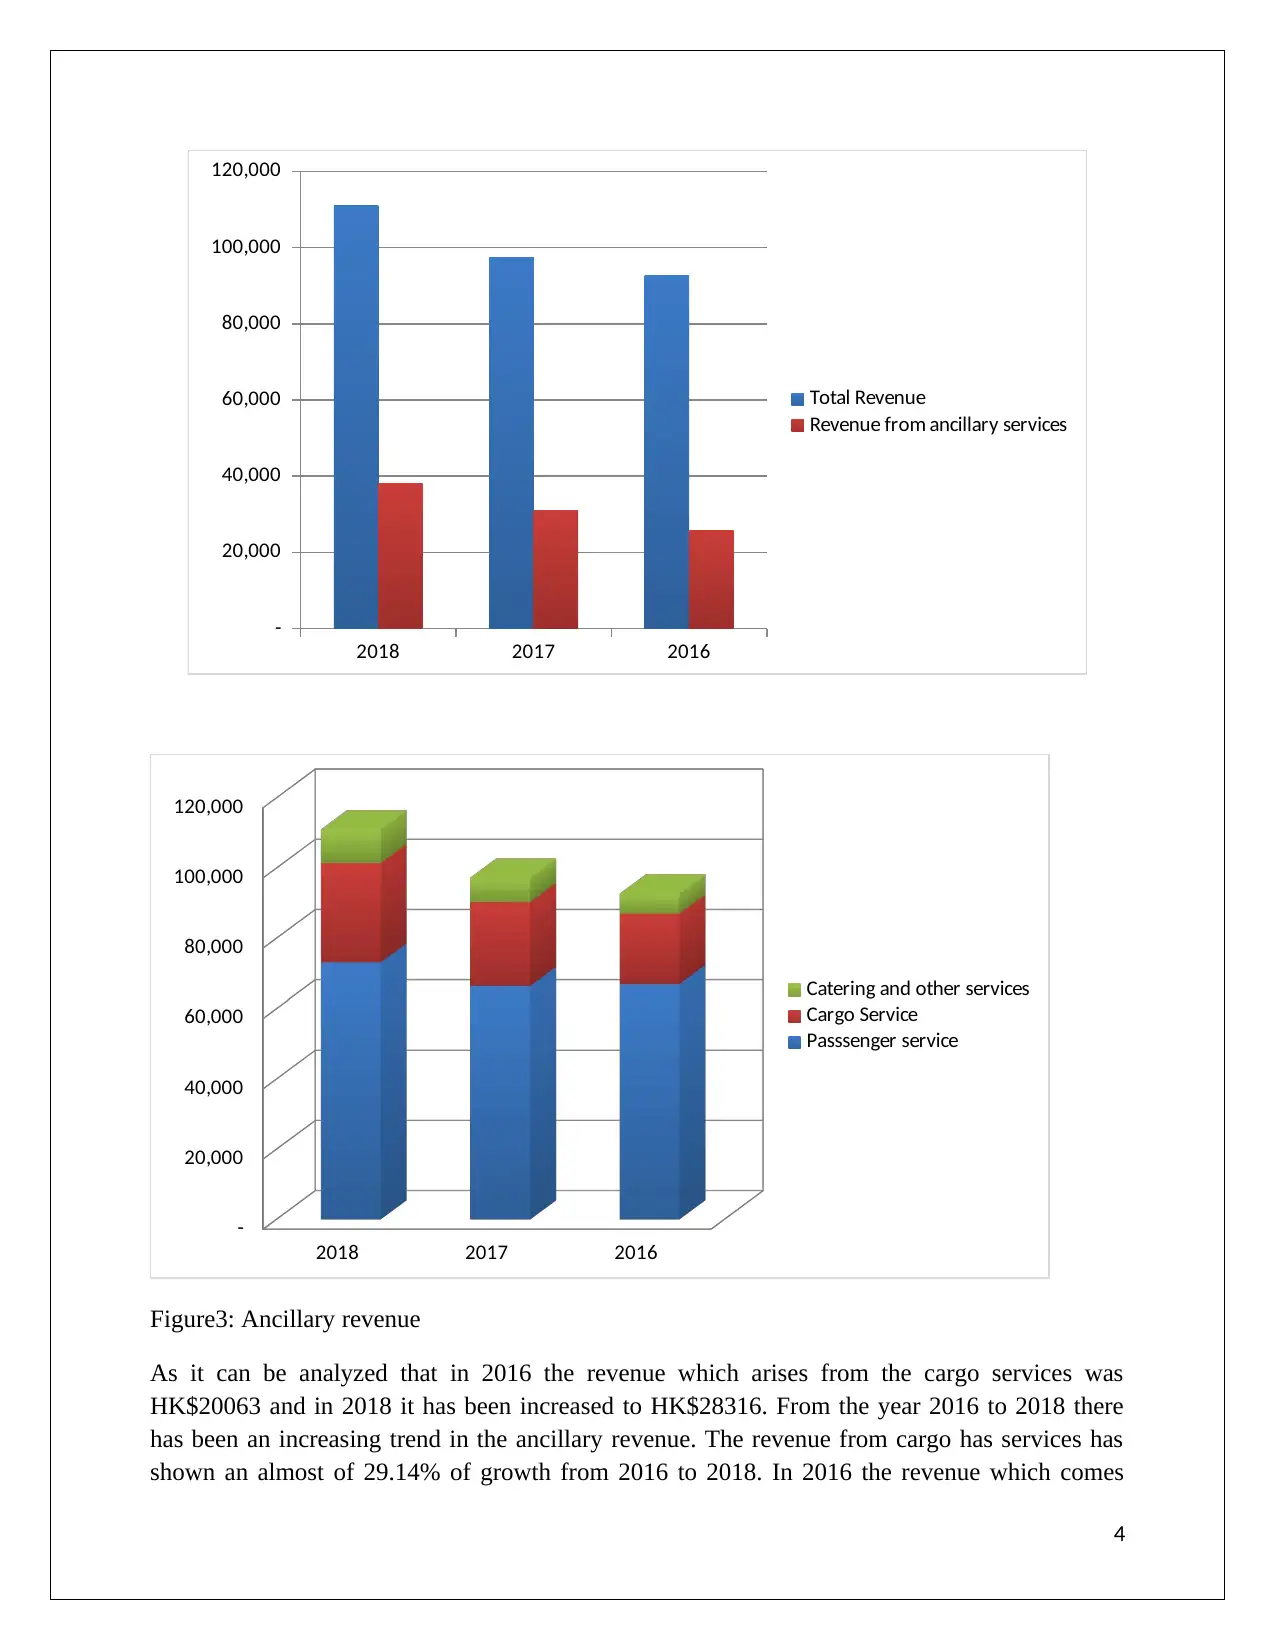
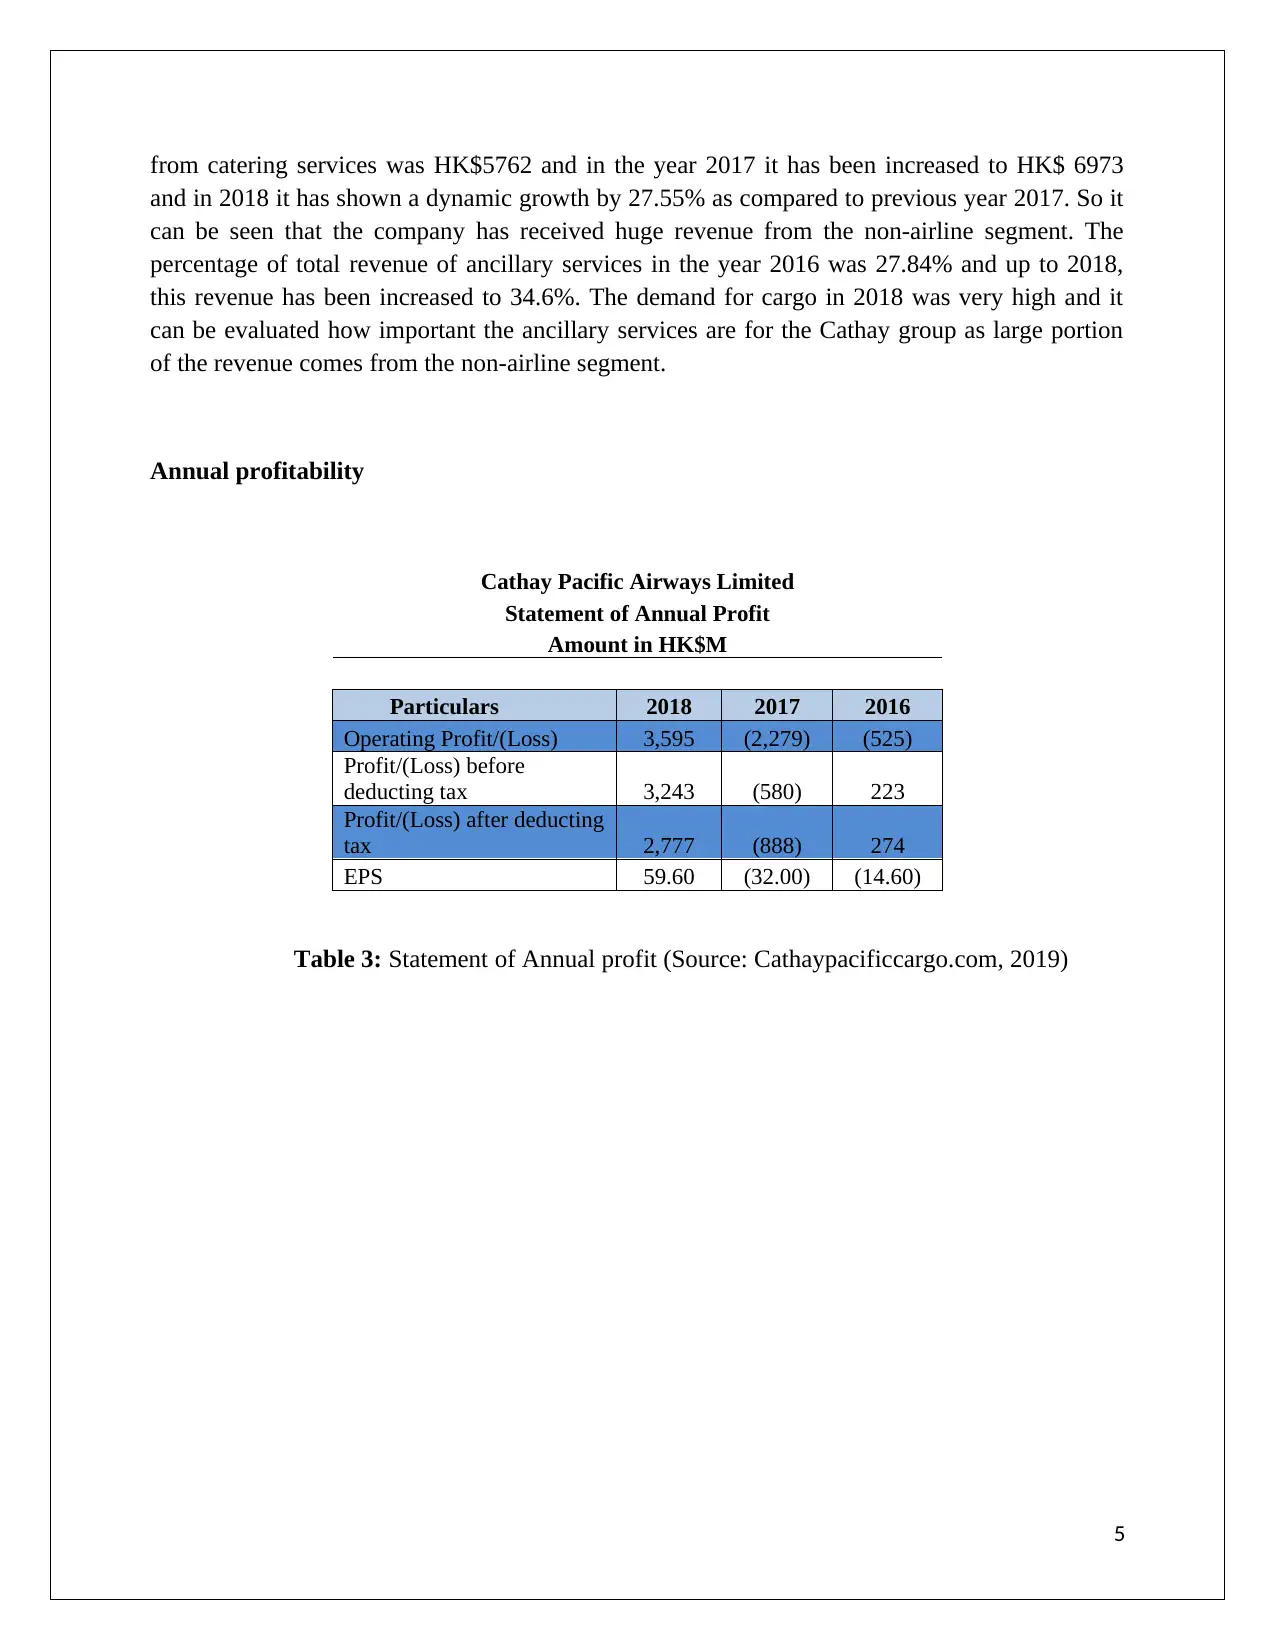
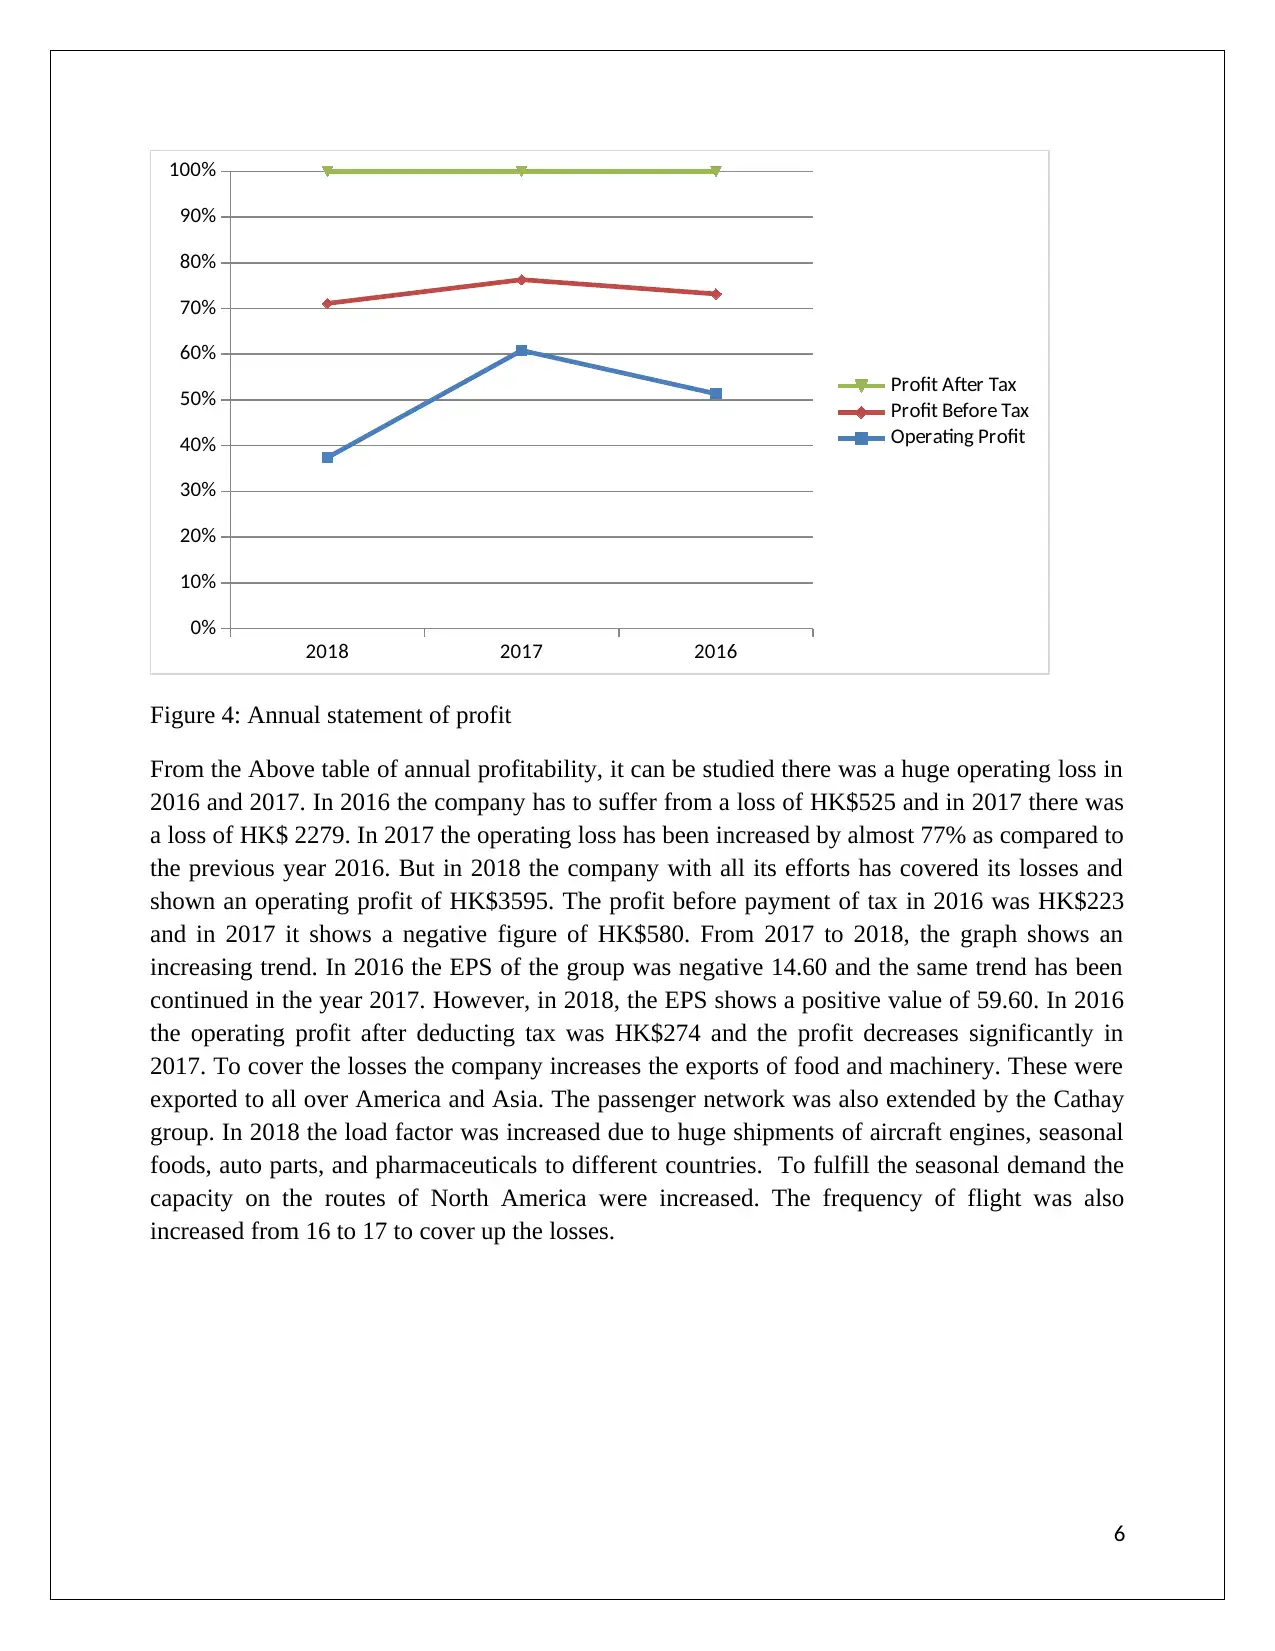
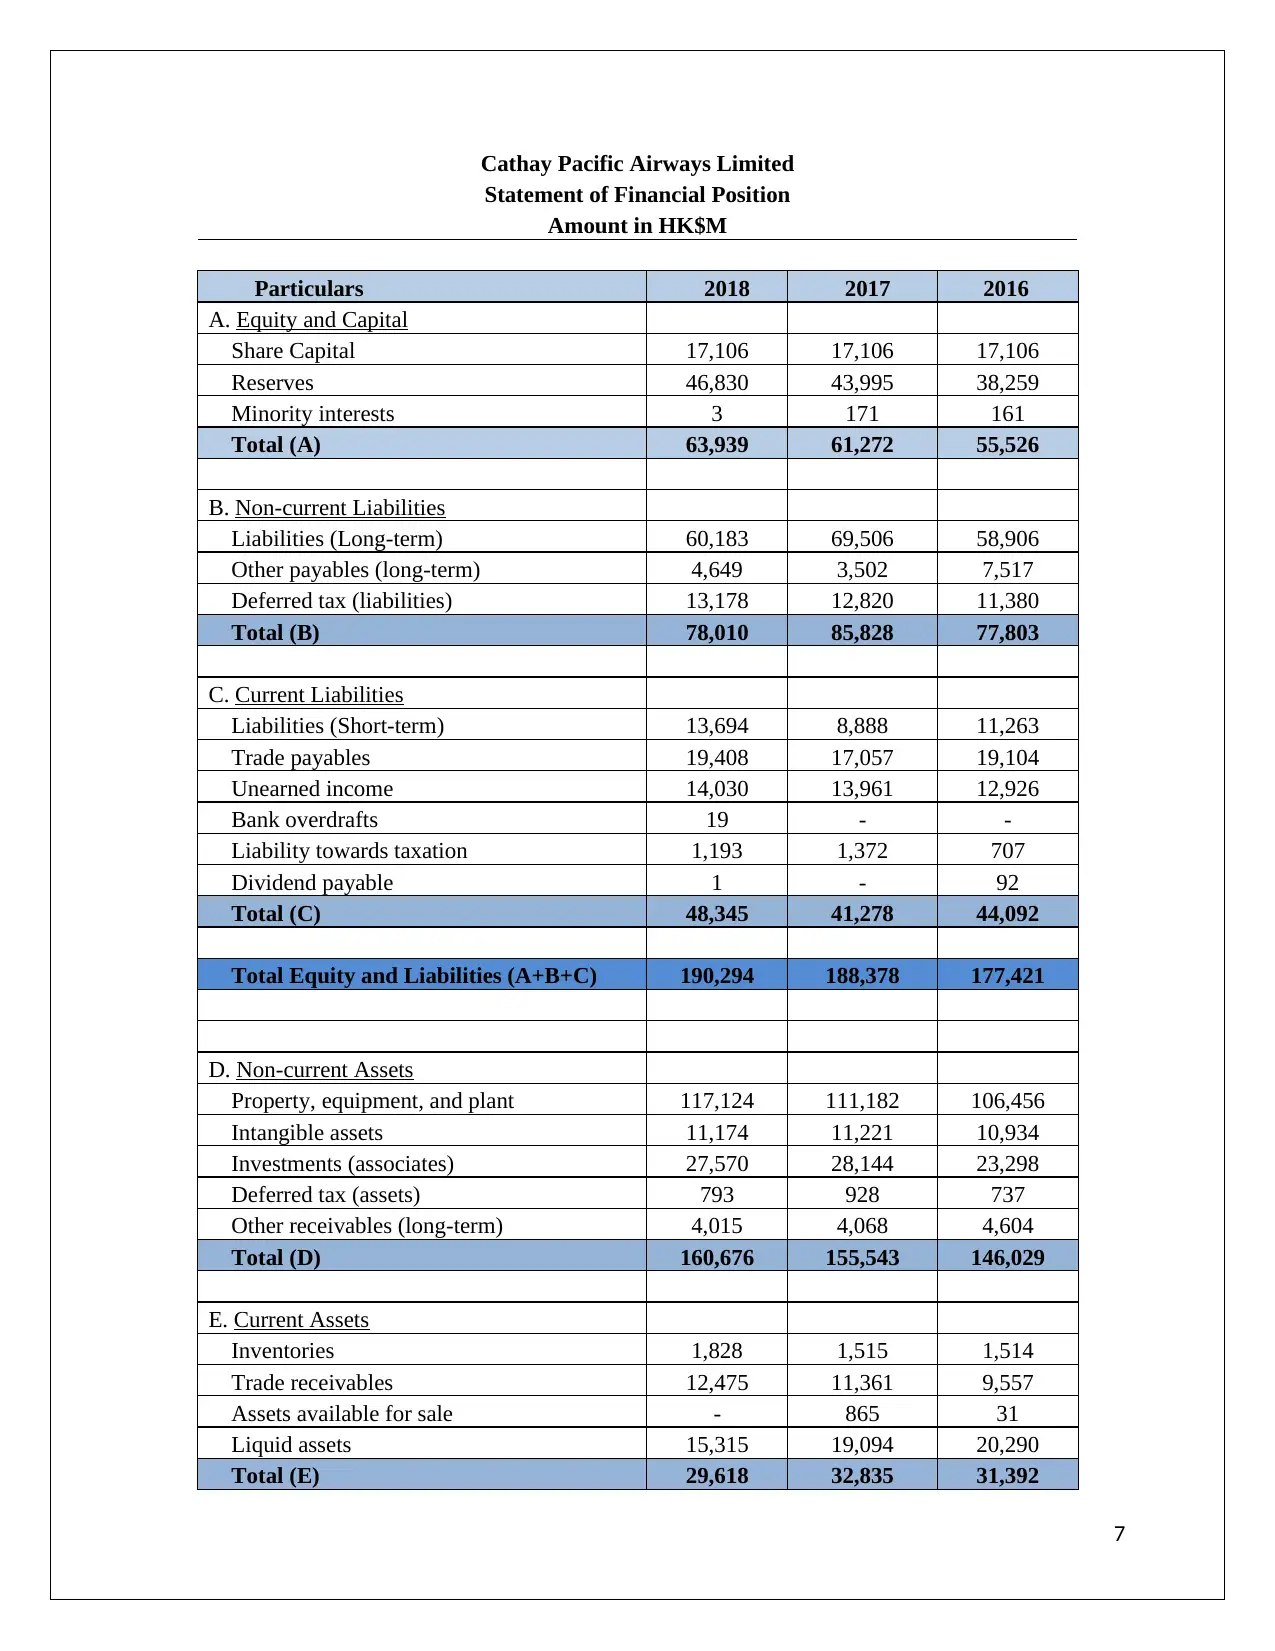
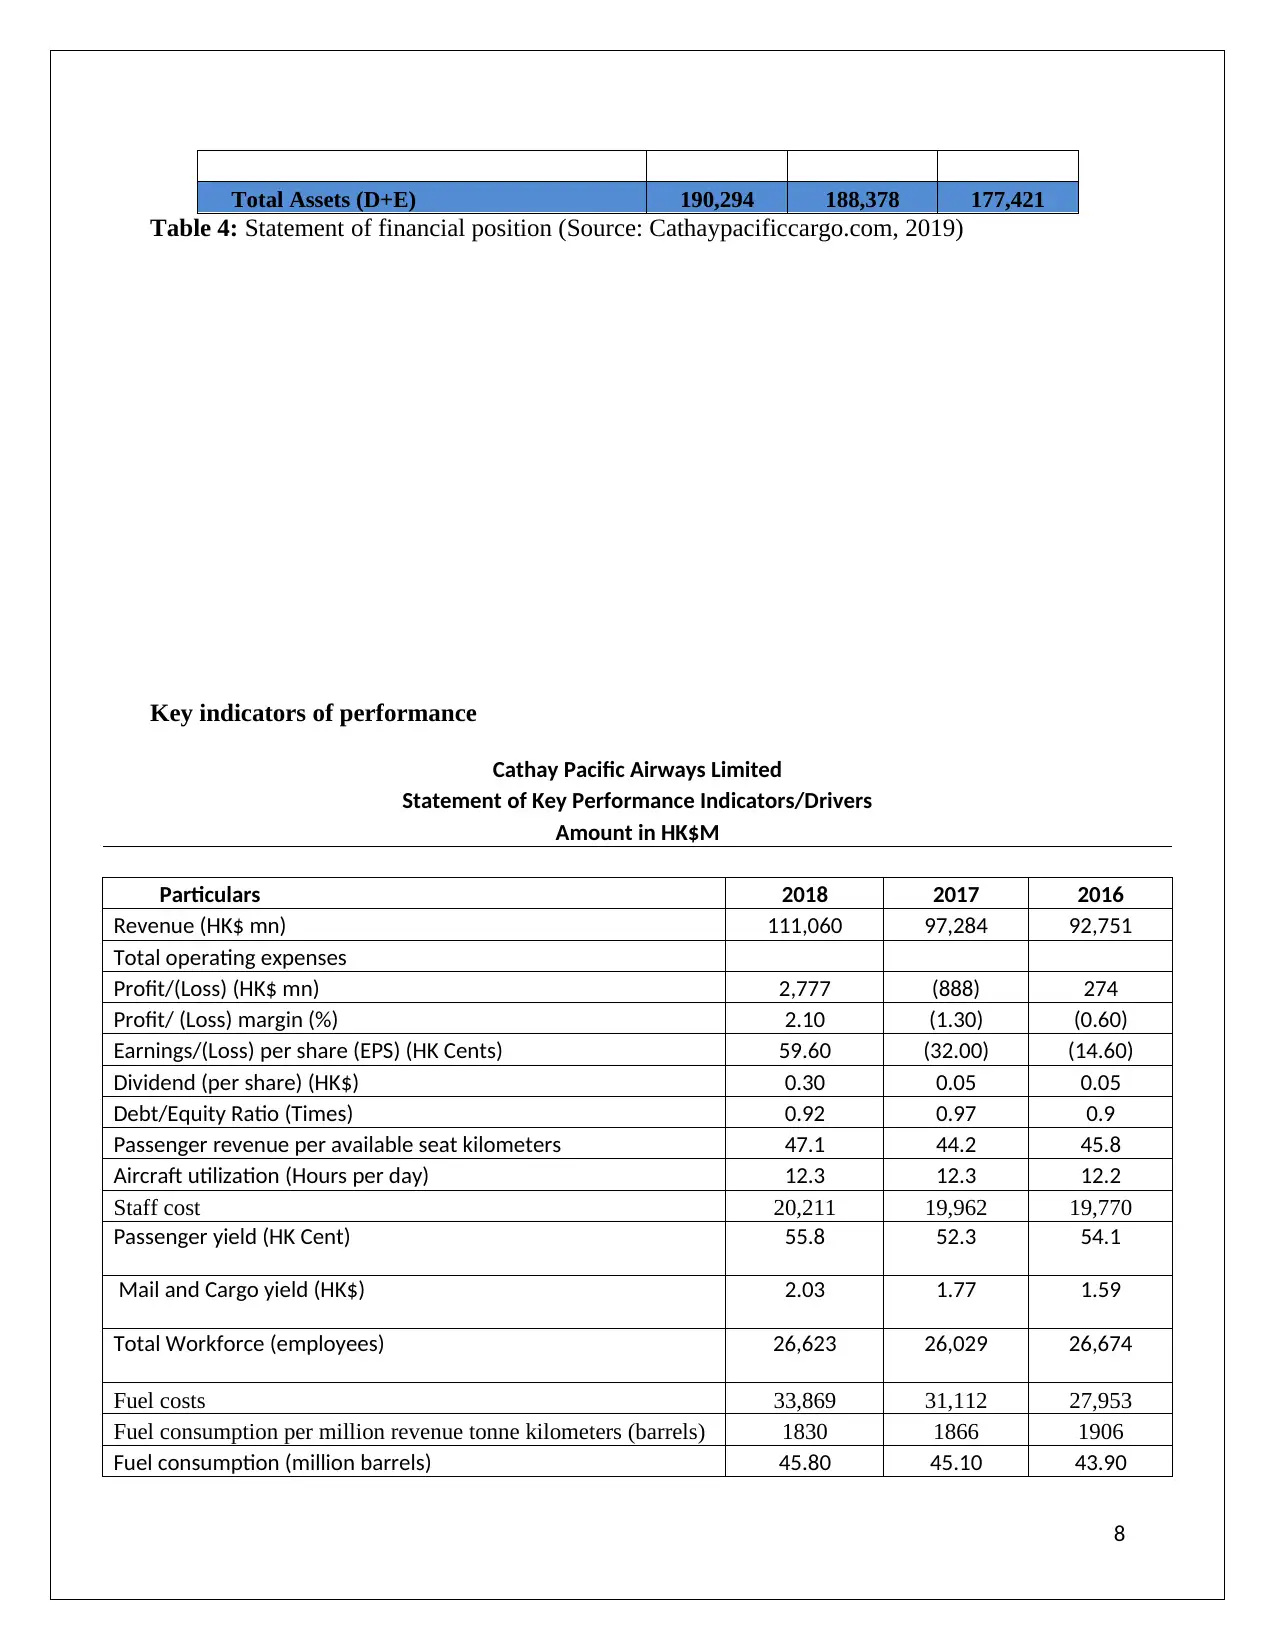
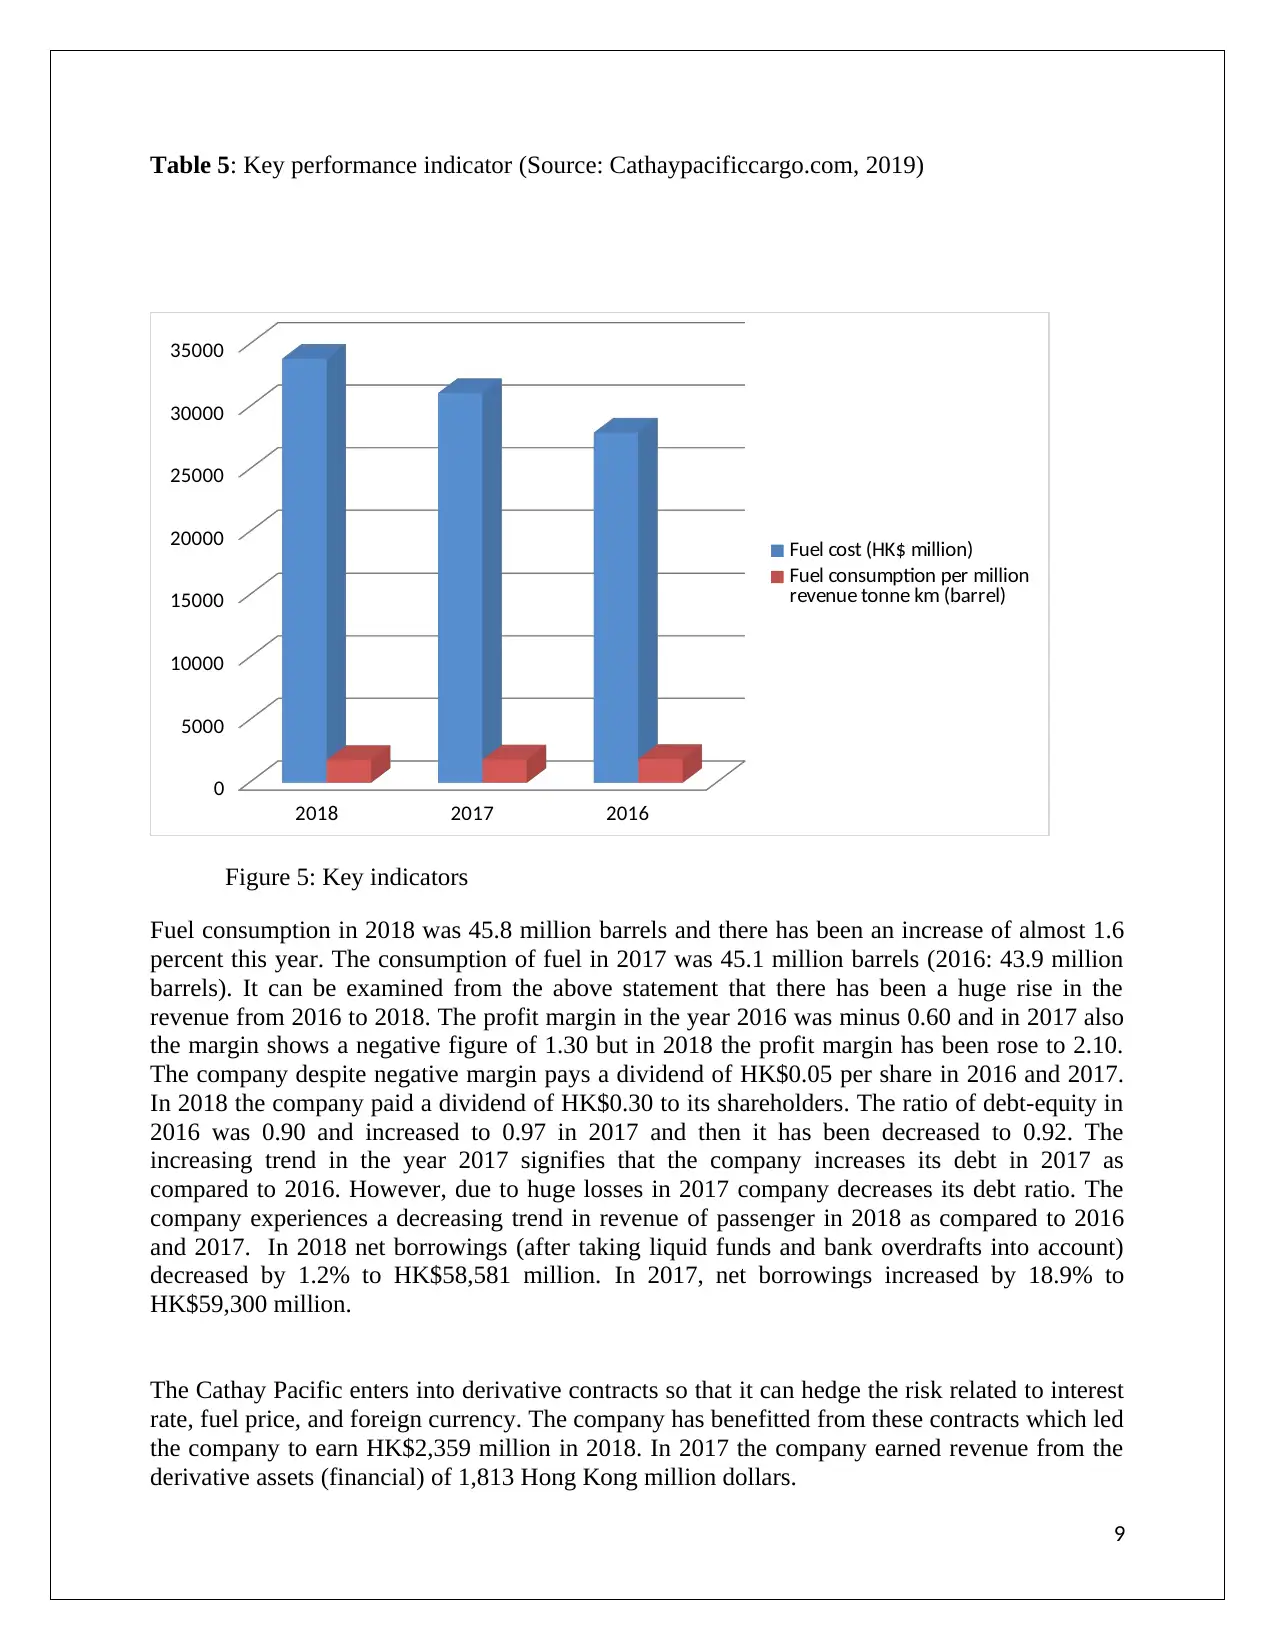
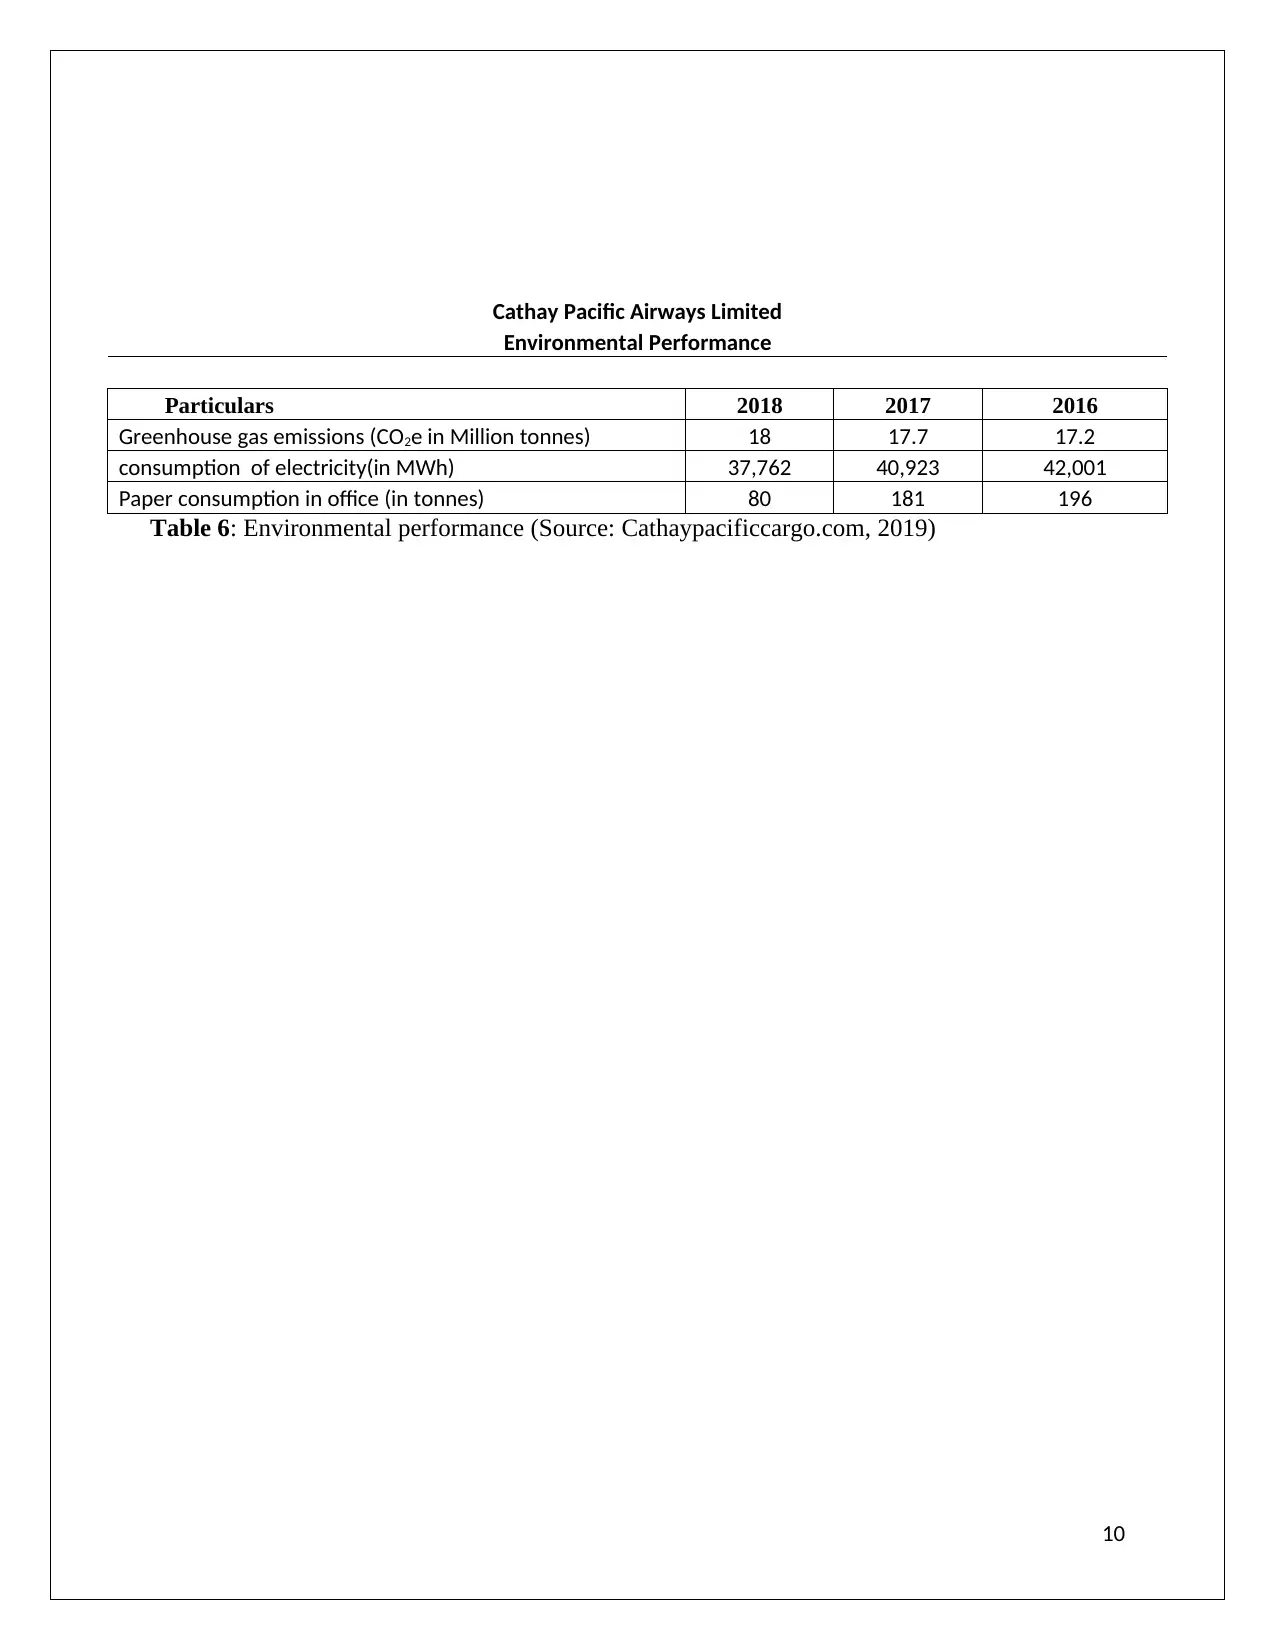
This report provides a detailed analysis of Cathay Pacific's financial performance from 2016 to 2018. It examines the airline's primary and ancillary revenue sources, including airline operations (passenger and cargo) and non-airline services (ground handling, catering). The report delves into the company's cost structure, outlining staff costs, fuel expenses, and other operational expenditures. Key performance indicators such as EPS, dividend, profit margin, and debt-equity ratio are evaluated, alongside an assessment of the company's annual profitability trends. The analysis incorporates financial statements and graphs to illustrate revenue and loss patterns, highlighting the importance of cargo services and ancillary revenue. Furthermore, the report discusses the company's environmental performance and its strategies to manage financial risks through derivative contracts, offering a comprehensive overview of Cathay Pacific's financial health and operational strategies.

Profitability, cost structures, and sources of revenue of full service
network carrier (FSCN)
0
network carrier (FSCN)
0
Paraphrase This Document
Need a fresh take? Get an instant paraphrase of this document with our AI Paraphraser

Abstract
In this paper, the main sources of revenue and the ancillary sources of revenue of Cathay pacific
Group have been discussed in details and also the annual profitability of three years has been
analyzed. The main performance driver of the company has been identified and evaluated. The
company cost structure and the financial position of the three years that is from 2016 to 2018
have been reviewed. By preparing the statement of the key performance drivers EPS, dividend,
profit margin, debt-equity portion of the company has been scrutinized and reviewed. Different
graphs have been drawn to show the trend of the revenues and losses of the Cathay Pacific
group.
Cathay pacific group was founded in the year 1946 and the founders of the group were Sydney
H. de Kantzow and Roy C. Farrel. Almost 32400 employees are employed in the Cathy group.
The main sources of revenue of Cathay group are airline operations and non-airline operations.
The airline operations also include cargo services and the company is rendering services to
around 60 countries. The services which are included in the non-airline segment are ground
handling services, cargo terminal services, catering services, and handling of air cargo. The
major source from where the Cathay group is earning its revenue is aircraft fleet. The ancillary
incomes which come from passenger and are related to flight are income from change fees, seat
choice, and extra legroom. The other ancillary income which comes under cargo is
documentation charges.
1

Cost structures
Cathay Pacific Airways Limited
Statement of Cost Structure
Amount in HK$M
Particulars 2018 2017 2016
Staff cost 20,211 19,962 19,770
Passenger and inflight expenses 5,292 4,996 4,734
Route and parking expenses 17,486 15,225 14,985
Fuel costs 33,869 31,112 27,953
Maintenance costs 9,401 9,607 8,856
Depreciation and amortization 15,594 14,640 13,008
Commission 862 681 700
Finance charges 2,457 2,223 1,561
Other expenses 4,750 3,340 3,270
Total 111,940 103,803 96,853
Table 1: Cost structure (Source: Cathaypacificcargo.com, 2019)
2018 2017 2016
0%
10%
20%
30%
40%
50%
60%
70%
80%
90%
100%
Other expenses
Finance charges
Commission
Depreciation and amortisation
Maintenanace costs
Fuel costs
Route and parking expenses
Passenger and inflight expenses
Staff cost
Figure 1: cost structure
2
⊘ This is a preview!⊘
Do you want full access?
Subscribe today to unlock all pages.

Trusted by 1+ million students worldwide

2018- Operating Expenses
Staff cost
Passenger and inflight expenses
Route and parking expenses
Fuel costs
Maintenanace costs
Depreciation and amortisation
Commission
Finance charges
Other expenses
Figure 2: Operating expenses
Importance of non-flying revenue
Cathay Pacific Airways Limited
Statement of Ancillary (Non-flying) Revenues
Amount in HK$M
Particulars 2018 2017 2016
Cargo services 28,316 23,903 20,063
Catering and other services 9,625 6,973 5,762
Revenue from ancillary services 37,941 30,876 25,825
% of Total Revenue 34.16% 31.74% 27.84%
Total Revenue 111,060 97,284 92,751
Table 2: Statement of Ancillary revenues (Source: Cathaypacificcargo.com, 2019)
3
Paraphrase This Document
Need a fresh take? Get an instant paraphrase of this document with our AI Paraphraser

2018 2017 2016
-
20,000
40,000
60,000
80,000
100,000
120,000
Total Revenue
Revenue from ancillary services
2018 2017 2016
-
20,000
40,000
60,000
80,000
100,000
120,000
Catering and other services
Cargo Service
Passsenger service
Figure3: Ancillary revenue
As it can be analyzed that in 2016 the revenue which arises from the cargo services was
HK$20063 and in 2018 it has been increased to HK$28316. From the year 2016 to 2018 there
has been an increasing trend in the ancillary revenue. The revenue from cargo has services has
shown an almost of 29.14% of growth from 2016 to 2018. In 2016 the revenue which comes
4
-
20,000
40,000
60,000
80,000
100,000
120,000
Total Revenue
Revenue from ancillary services
2018 2017 2016
-
20,000
40,000
60,000
80,000
100,000
120,000
Catering and other services
Cargo Service
Passsenger service
Figure3: Ancillary revenue
As it can be analyzed that in 2016 the revenue which arises from the cargo services was
HK$20063 and in 2018 it has been increased to HK$28316. From the year 2016 to 2018 there
has been an increasing trend in the ancillary revenue. The revenue from cargo has services has
shown an almost of 29.14% of growth from 2016 to 2018. In 2016 the revenue which comes
4

from catering services was HK$5762 and in the year 2017 it has been increased to HK$ 6973
and in 2018 it has shown a dynamic growth by 27.55% as compared to previous year 2017. So it
can be seen that the company has received huge revenue from the non-airline segment. The
percentage of total revenue of ancillary services in the year 2016 was 27.84% and up to 2018,
this revenue has been increased to 34.6%. The demand for cargo in 2018 was very high and it
can be evaluated how important the ancillary services are for the Cathay group as large portion
of the revenue comes from the non-airline segment.
Annual profitability
Cathay Pacific Airways Limited
Statement of Annual Profit
Amount in HK$M
Particulars 2018 2017 2016
Operating Profit/(Loss) 3,595 (2,279) (525)
Profit/(Loss) before
deducting tax 3,243 (580) 223
Profit/(Loss) after deducting
tax 2,777 (888) 274
EPS 59.60 (32.00) (14.60)
Table 3: Statement of Annual profit (Source: Cathaypacificcargo.com, 2019)
5
⊘ This is a preview!⊘
Do you want full access?
Subscribe today to unlock all pages.

Trusted by 1+ million students worldwide

2018 2017 2016
0%
10%
20%
30%
40%
50%
60%
70%
80%
90%
100%
Profit After Tax
Profit Before Tax
Operating Profit
Figure 4: Annual statement of profit
From the Above table of annual profitability, it can be studied there was a huge operating loss in
2016 and 2017. In 2016 the company has to suffer from a loss of HK$525 and in 2017 there was
a loss of HK$ 2279. In 2017 the operating loss has been increased by almost 77% as compared to
the previous year 2016. But in 2018 the company with all its efforts has covered its losses and
shown an operating profit of HK$3595. The profit before payment of tax in 2016 was HK$223
and in 2017 it shows a negative figure of HK$580. From 2017 to 2018, the graph shows an
increasing trend. In 2016 the EPS of the group was negative 14.60 and the same trend has been
continued in the year 2017. However, in 2018, the EPS shows a positive value of 59.60. In 2016
the operating profit after deducting tax was HK$274 and the profit decreases significantly in
2017. To cover the losses the company increases the exports of food and machinery. These were
exported to all over America and Asia. The passenger network was also extended by the Cathay
group. In 2018 the load factor was increased due to huge shipments of aircraft engines, seasonal
foods, auto parts, and pharmaceuticals to different countries. To fulfill the seasonal demand the
capacity on the routes of North America were increased. The frequency of flight was also
increased from 16 to 17 to cover up the losses.
6
Paraphrase This Document
Need a fresh take? Get an instant paraphrase of this document with our AI Paraphraser

Cathay Pacific Airways Limited
Statement of Financial Position
Amount in HK$M
Particulars 2018 2017 2016
A. Equity and Capital
Share Capital 17,106 17,106 17,106
Reserves 46,830 43,995 38,259
Minority interests 3 171 161
Total (A) 63,939 61,272 55,526
B. Non-current Liabilities
Liabilities (Long-term) 60,183 69,506 58,906
Other payables (long-term) 4,649 3,502 7,517
Deferred tax (liabilities) 13,178 12,820 11,380
Total (B) 78,010 85,828 77,803
C. Current Liabilities
Liabilities (Short-term) 13,694 8,888 11,263
Trade payables 19,408 17,057 19,104
Unearned income 14,030 13,961 12,926
Bank overdrafts 19 - -
Liability towards taxation 1,193 1,372 707
Dividend payable 1 - 92
Total (C) 48,345 41,278 44,092
Total Equity and Liabilities (A+B+C) 190,294 188,378 177,421
D. Non-current Assets
Property, equipment, and plant 117,124 111,182 106,456
Intangible assets 11,174 11,221 10,934
Investments (associates) 27,570 28,144 23,298
Deferred tax (assets) 793 928 737
Other receivables (long-term) 4,015 4,068 4,604
Total (D) 160,676 155,543 146,029
E. Current Assets
Inventories 1,828 1,515 1,514
Trade receivables 12,475 11,361 9,557
Assets available for sale - 865 31
Liquid assets 15,315 19,094 20,290
Total (E) 29,618 32,835 31,392
7

Total Assets (D+E) 190,294 188,378 177,421
Table 4: Statement of financial position (Source: Cathaypacificcargo.com, 2019)
Key indicators of performance
Cathay Pacific Airways Limited
Statement of Key Performance Indicators/Drivers
Amount in HK$M
Particulars 2018 2017 2016
Revenue (HK$ mn) 111,060 97,284 92,751
Total operating expenses
Profit/(Loss) (HK$ mn) 2,777 (888) 274
Profit/ (Loss) margin (%) 2.10 (1.30) (0.60)
Earnings/(Loss) per share (EPS) (HK Cents) 59.60 (32.00) (14.60)
Dividend (per share) (HK$) 0.30 0.05 0.05
Debt/Equity Ratio (Times) 0.92 0.97 0.9
Passenger revenue per available seat kilometers 47.1 44.2 45.8
Aircraft utilization (Hours per day) 12.3 12.3 12.2
Staff cost 20,211 19,962 19,770
Passenger yield (HK Cent) 55.8 52.3 54.1
Mail and Cargo yield (HK$) 2.03 1.77 1.59
Total Workforce (employees) 26,623 26,029 26,674
Fuel costs 33,869 31,112 27,953
Fuel consumption per million revenue tonne kilometers (barrels) 1830 1866 1906
Fuel consumption (million barrels) 45.80 45.10 43.90
8
⊘ This is a preview!⊘
Do you want full access?
Subscribe today to unlock all pages.

Trusted by 1+ million students worldwide

Table 5: Key performance indicator (Source: Cathaypacificcargo.com, 2019)
2018 2017 2016
0
5000
10000
15000
20000
25000
30000
35000
Fuel cost (HK$ million)
Fuel consumption per million
revenue tonne km (barrel)
Figure 5: Key indicators
Fuel consumption in 2018 was 45.8 million barrels and there has been an increase of almost 1.6
percent this year. The consumption of fuel in 2017 was 45.1 million barrels (2016: 43.9 million
barrels). It can be examined from the above statement that there has been a huge rise in the
revenue from 2016 to 2018. The profit margin in the year 2016 was minus 0.60 and in 2017 also
the margin shows a negative figure of 1.30 but in 2018 the profit margin has been rose to 2.10.
The company despite negative margin pays a dividend of HK$0.05 per share in 2016 and 2017.
In 2018 the company paid a dividend of HK$0.30 to its shareholders. The ratio of debt-equity in
2016 was 0.90 and increased to 0.97 in 2017 and then it has been decreased to 0.92. The
increasing trend in the year 2017 signifies that the company increases its debt in 2017 as
compared to 2016. However, due to huge losses in 2017 company decreases its debt ratio. The
company experiences a decreasing trend in revenue of passenger in 2018 as compared to 2016
and 2017. In 2018 net borrowings (after taking liquid funds and bank overdrafts into account)
decreased by 1.2% to HK$58,581 million. In 2017, net borrowings increased by 18.9% to
HK$59,300 million.
The Cathay Pacific enters into derivative contracts so that it can hedge the risk related to interest
rate, fuel price, and foreign currency. The company has benefitted from these contracts which led
the company to earn HK$2,359 million in 2018. In 2017 the company earned revenue from the
derivative assets (financial) of 1,813 Hong Kong million dollars.
9
Paraphrase This Document
Need a fresh take? Get an instant paraphrase of this document with our AI Paraphraser

Cathay Pacific Airways Limited
Environmental Performance
Particulars 2018 2017 2016
Greenhouse gas emissions (CO2e in Million tonnes) 18 17.7 17.2
consumption of electricity(in MWh) 37,762 40,923 42,001
Paper consumption in office (in tonnes) 80 181 196
Table 6: Environmental performance (Source: Cathaypacificcargo.com, 2019)
10
Environmental Performance
Particulars 2018 2017 2016
Greenhouse gas emissions (CO2e in Million tonnes) 18 17.7 17.2
consumption of electricity(in MWh) 37,762 40,923 42,001
Paper consumption in office (in tonnes) 80 181 196
Table 6: Environmental performance (Source: Cathaypacificcargo.com, 2019)
10

References
Cathaypacificcargo.com, (2019), Cathay Pacific Cargo- Homepage [online]
Available at: https://www.cathaypacificcargo.com/ [Accessed on 20th August, 2019].
Narandaran, Y.Y., Hamid, B.A. and Habibullah, M.S., (2016). Financial risk exposures of the airlines
industry: Evidence from Cathay Pacific Airways and China Airlines. International Journal of Business and
Society, 17(2), pp.221-244.
11
⊘ This is a preview!⊘
Do you want full access?
Subscribe today to unlock all pages.

Trusted by 1+ million students worldwide
1 out of 12
Related Documents

Your All-in-One AI-Powered Toolkit for Academic Success.
 +13062052269
info@desklib.com
Available 24*7 on WhatsApp / Email
Unlock your academic potential
Copyright © 2020–2025 A2Z Services. All Rights Reserved. Developed and managed by ZUCOL.