Analysis of HIV Treatment Impact on CD4 Cell Count (HIVPOINT Dataset)
VerifiedAdded on 2022/08/20
|20
|6196
|48
Homework Assignment
AI Summary
This assignment focuses on estimating the causal effect of initiating antiretroviral treatment (ART) on CD4 cell count using the HIVPOINT dataset, which includes data on 5,680 HIV-positive individuals. The goal is to estimate the average causal effect of treatment on the outcome, CD4 cell count after 3 years of follow-up. The assignment explores confounding and causal inference, requiring explanations in layman's terms for a non-epidemiologist. It involves understanding assumptions about confounding variables, and the average causal effect of interest. The analysis uses outcome regression and regression on the propensity score to estimate the causal effect, including interpretation of results and identification of modeling assumptions. The assignment covers both continuous and categorical variables derived from the dataset, and utilizes statistical models to assess the impact of ART on CD4 cell count while controlling for various confounding factors like age, sex, geographic origin, calendar year, mode of HIV transmission, baseline CD4 cell count, and viral load. The student is required to provide point estimates, confidence intervals, and interpret the results in a clear and understandable manner. The assignment also delves into the assumptions underlying the statistical models used, such as additivity and linearity.
Part I
The HIVPOINT dataset includes information on 5,680 HIV-positive individuals in
Europe and the United States. You will use these data to estimate the effect of
initiating antiretroviral treatment A (1: yes, 0: no) at baseline on CD4 cell count
after 3 years of follow-up Y. CD4 count, measured in cells/μl, is a marker of
immunosuppression; the higher the CD4 cell count, the better. No individuals were
lost to follow-up. The goal is to estimate the average causal effect,
E[Ya=1] − E[Ya=0], of treatment A on outcome Y. A code book for the HIVPOINT
dataset can be found on the final project page.
Consider the following list of variables measured at baseline: age, sex, geographic
origin, calendar year, mode of HIV transmission, CD4 cell count, and viral load
(concentration of viral RNA in blood). Remember, you have an uncle who is a
famous novelist with interest, but no formal training in epidemiology. In each of
the questions below, explain your answers to him in a way that he can easily
understand (i.e., plain and unambiguous English).
Question 1
Assume the variables listed in the prompt above are sufficient and necessary to
control for confounding. Explain what this assumption means to your uncle.
a. The group that received ART and the group that did not receive ART are
unconditionally exchangeable or comparable. That is, the group that
received ART would have the same average CD4 cell count after 3 years of
follow-up as the group that did not receive ART had they actually been
treated and vice versa (i.e. if treatment assignment had been flipped).
b. The group that received ART and the group that did not receive ART are
exchangeable or comparable conditional on age, sex, geographic origin,
calendar year, mode of HIV transmission, CD4 cell count and viral load. That
is, within levels of age, sex, geographic origin, calendar year, mode of HIV
transmission, CD4 cell count and viral load, the group that received ART
would have the same average CD4 cell count after 3 years of follow-up as
the group that did not receive ART had they actually been treated and vice
versa (i.e., if treatment assignment had been flipped).
c. The group that received ART and the group that did not receive ART are
unconditionally exchangeable or comparable. That is, the average CD4 cell
count after 3 years of follow-up had everyone received ART will be the same
as the average CD4 cell count after 3 years of follow-up had nobody received
ART.
d. The group that received ART and the group that did not receive ART are
exchangeable or comparable conditional on age, sex, geographic origin,
calendar year, mode of HIV transmission, CD4 cell count and viral load. That
is, the average CD4 cell count after 3 years of follow-up had everyone
received ART will be the same as the average CD4 cell count after 3 years of
Paraphrase This Document
Need a fresh take? Get an instant paraphrase of this document with our AI Paraphraser
follow-up had nobody received ART, within levels of age, sex, geographic
origin, calendar year, mode of HIV transmission, CD4 cell count and viral
load.
Question 2
Based on your subject-matter knowledge, which of the following are reasons why
adjusting for the variable “baseline CD4 cell count” is advisable in this study?
a. Baseline CD4 cell count is a clinical measure of immunosuppression and can
be used to determine initiation of ART.
b. Baseline CD4 cell count mediates the effect of ART on CD4 cell count at 3
years.
c. Immunologic status (an unmeasured U) is a common cause of baseline CD4
count and CD4 count at 3 years follow-up (outcome). E.g. people with worse
immunologic status may have lower CD4 cell count at baseline and this will
also affect CD4 count over time.
d. The effect of ART on CD4 cell count at 3 years of follow-up differs across
different thresholds of the baseline CD4 cell count.
Question 3
Which of the following is the average causal effect of interest given in the prompt?
a. The difference in the mean CD4 cell count after 3 years of follow-up among
those in the study that were treated with ART compared to the mean CD4
cell count after 3 years of follow-up among those in the study that were
untreated with ART.
b. The difference in the mean CD4 cell count after 3 years of follow-up among
those in the study that were treated with ART compared to the mean CD4
cell count after 3 years of follow-up among those in the study that were
untreated with ART, within levels of levels of age, sex, geographic origin,
calendar year, mode of HIV transmission, CD4 cell count and viral load
c. The difference in the mean CD4 cell count after 3 years of follow-up that
would have been observed had everyone in the study been treated with ART
compared to what would have been observed had everyone in the study been
untreated with ART.
d. The difference in the mean CD4 cell count after 3 years of follow-up that
would have been observed had everyone in the study been treated with ART
compared to what would have been observed had everyone in the study been
untreated with ART, within levels of age, sex, geographic origin, calendar
year, mode of HIV transmission, CD4 cell count and viral load.
Question 4
Which of the following is a true statement about whether or not the definition of
the average causal effect defined in question 3 depends on the variables that are
being adjusted for?
a. The definition of this effect is marginal, meaning that it does not depend on
the variables for which we are adjusting. The adjustment variables are
sufficient to achieve conditional exchangeability, which is an assumption we
need to make in order to estimate the (marginal) average causal effect in the
population using our data.
b. The definition of this effect is conditional, meaning that it does depend on
the variables for which we are adjusting. The adjustment variables are
sufficient to achieve conditional exchangeability, which is an assumption we
need to make in order to estimate the (conditional) causal effect in the
population using our data.
Prompt for questions 5-28:
Using the HIVPOINT dataset for questions 5-28, model all baseline continuous
variables categorically. That is, use indicator variables as you’ve done throughout
the course based on the cut-points given in the codebook (note: these categories
have already been created for you in the data). Do not include any product terms in
any models. Always round your answer to the nearest hundredth.
Question 5
Using outcome regression, provide a point estimate of the causal effect of interest
in this study. Round your answer to the nearest hundredth.
131.87
Question 6
Using outcome regression, provide a valid 95% confidence interval for the causal
effect of interest you estimated in question 5. Round your answer to the nearest
hundredth.
Upper bound= 113.66
Lower bound= 150.09
Question 7
Interpret the point estimate that you estimated in question 5 in plain and
unambiguous English that your uncle can understand. Fill in the blanks.
After 3 years of follow-up, the average CD4 cell count among those who received
antiretroviral therapy was 38.18 cells/ul higher than the average CD4 cell count
among those who did not received antiretroviral treatment conditional on age, sex,
geographic origin, calendar year, mode of HIV transmission, baseline CD4 cell
count, and baseline viral load.
the variables for which we are adjusting. The adjustment variables are
sufficient to achieve conditional exchangeability, which is an assumption we
need to make in order to estimate the (marginal) average causal effect in the
population using our data.
b. The definition of this effect is conditional, meaning that it does depend on
the variables for which we are adjusting. The adjustment variables are
sufficient to achieve conditional exchangeability, which is an assumption we
need to make in order to estimate the (conditional) causal effect in the
population using our data.
Prompt for questions 5-28:
Using the HIVPOINT dataset for questions 5-28, model all baseline continuous
variables categorically. That is, use indicator variables as you’ve done throughout
the course based on the cut-points given in the codebook (note: these categories
have already been created for you in the data). Do not include any product terms in
any models. Always round your answer to the nearest hundredth.
Question 5
Using outcome regression, provide a point estimate of the causal effect of interest
in this study. Round your answer to the nearest hundredth.
131.87
Question 6
Using outcome regression, provide a valid 95% confidence interval for the causal
effect of interest you estimated in question 5. Round your answer to the nearest
hundredth.
Upper bound= 113.66
Lower bound= 150.09
Question 7
Interpret the point estimate that you estimated in question 5 in plain and
unambiguous English that your uncle can understand. Fill in the blanks.
After 3 years of follow-up, the average CD4 cell count among those who received
antiretroviral therapy was 38.18 cells/ul higher than the average CD4 cell count
among those who did not received antiretroviral treatment conditional on age, sex,
geographic origin, calendar year, mode of HIV transmission, baseline CD4 cell
count, and baseline viral load.
⊘ This is a preview!⊘
Do you want full access?
Subscribe today to unlock all pages.
Trusted by 1+ million students worldwide
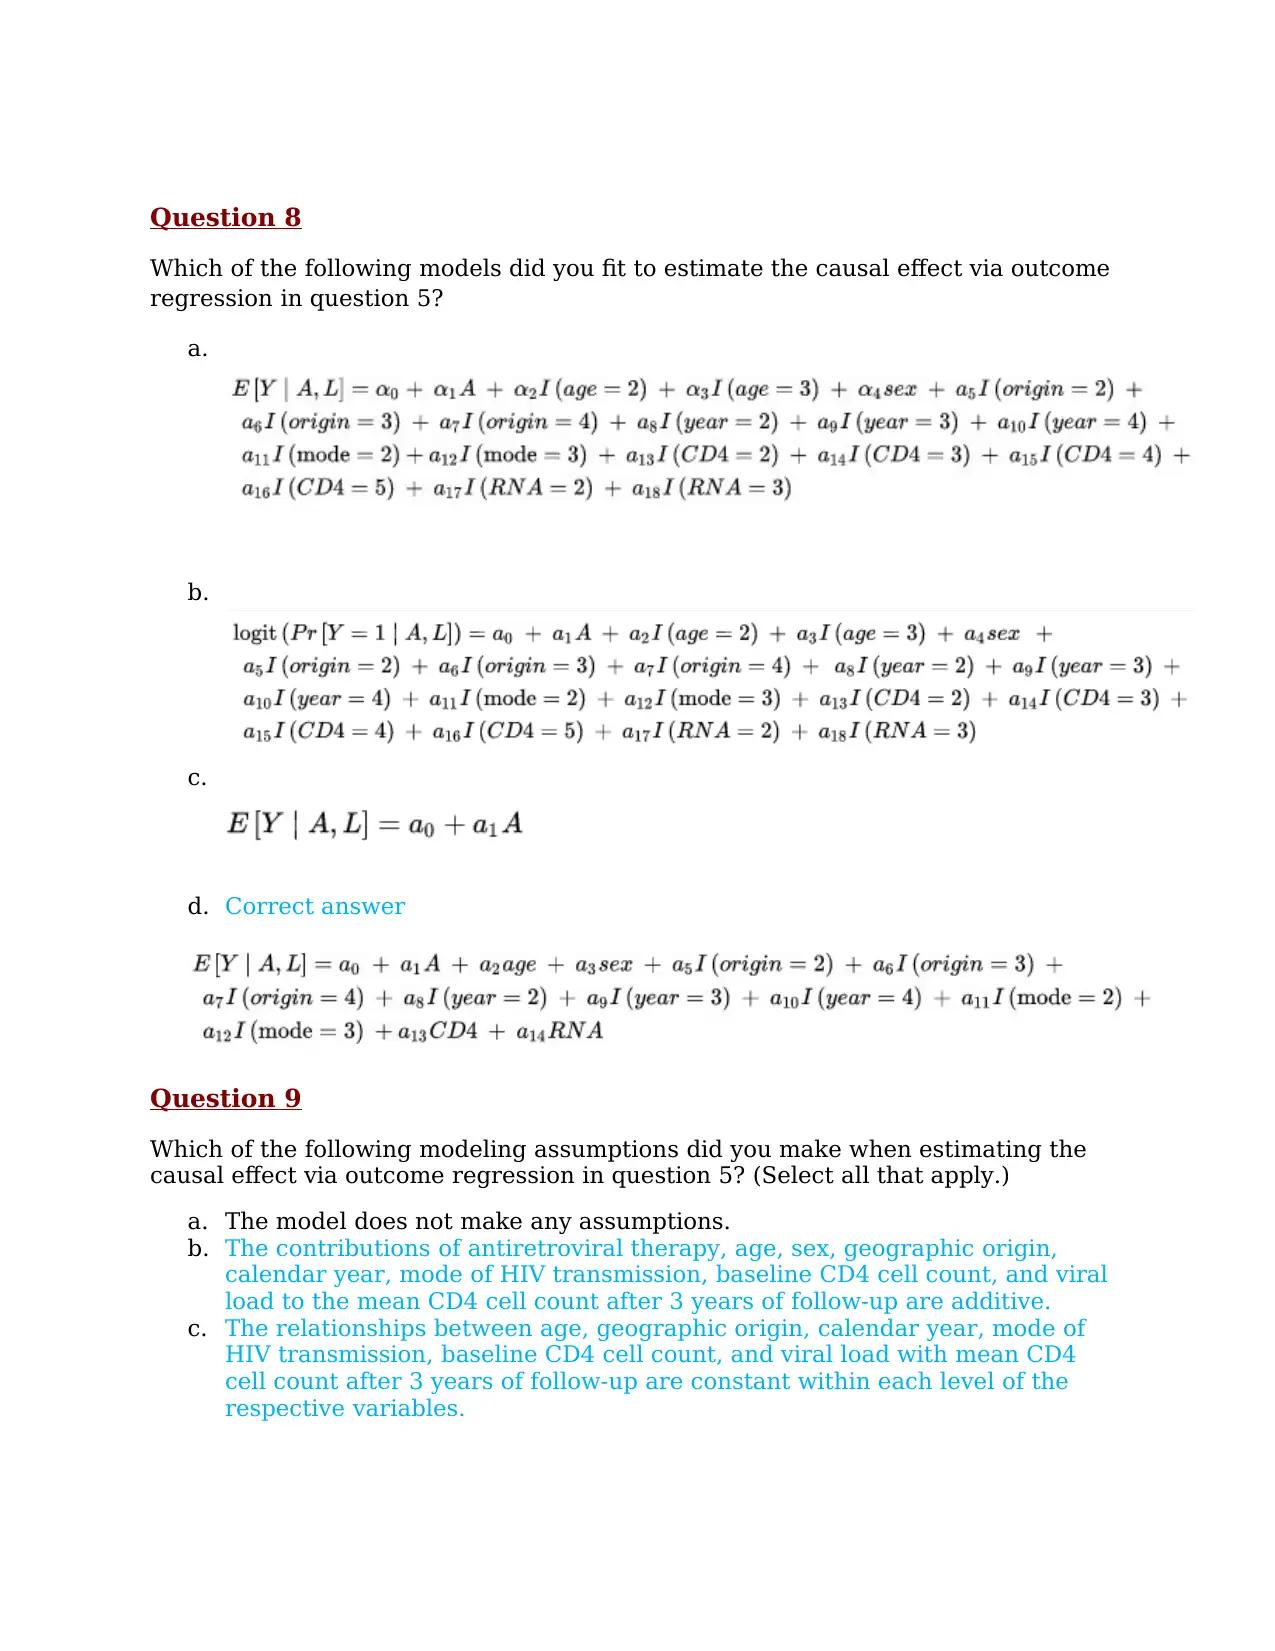
Question 8
Which of the following models did you fit to estimate the causal effect via outcome
regression in question 5?
a.
b.
c.
d. Correct answer
Question 9
Which of the following modeling assumptions did you make when estimating the
causal effect via outcome regression in question 5? (Select all that apply.)
a. The model does not make any assumptions.
b. The contributions of antiretroviral therapy, age, sex, geographic origin,
calendar year, mode of HIV transmission, baseline CD4 cell count, and viral
load to the mean CD4 cell count after 3 years of follow-up are additive.
c. The relationships between age, geographic origin, calendar year, mode of
HIV transmission, baseline CD4 cell count, and viral load with mean CD4
cell count after 3 years of follow-up are constant within each level of the
respective variables.
Paraphrase This Document
Need a fresh take? Get an instant paraphrase of this document with our AI Paraphraser
d. The contributions of age, sex, geographic origin, calendar year, mode of HIV
transmission, baseline CD4 cell count, and viral load to the logit of
antiretroviral therapy are additive.
e. The relationships between age, geographic origin, calendar year, mode of
HIV transmission, baseline CD4 cell count, and viral load with the logit of
antiretroviral therapy are constant within each level of the respective
variables.
f. The relationship between the propensity score and mean CD4 cell count
after 3 years of follow-up is quadratic.
g. The relationship between the propensity score and mean CD4 cell count
after 3 years of follow-up is linear.
h. The contributions of antiretroviral therapy and the propensity score
(squared, if applicable) to the mean CD4 cell count after 3 years of follow-up
are additive.
Question 10
Using regression on the propensity score, provide a point estimate of the causal
effect of interest in this study. When building your final model, include propensity
score as a continuous variable with a quadratic term. Round your answer to the
nearest hundredth.
129.50
Question 11
Using regression on the propensity score, provide a valid 95% confidence interval
for the causal effect of interest you estimated in question 10. Round your answer to
the nearest hundredth.
Upper bound= 110.83
Lower bound= 148.18
Question 12
Interpret the point estimate that you estimated in question 10 in plain and
unambiguous English that your uncle can understand. Fill in the blanks.
After 3 years of follow-up, the average CD4 cell count among those who received
antiretroviral therapy was 38.18 cells/ul higher than the average CD4 cell count
among those who did not received antiretroviral treatment conditional on age, sex,
geographic origin, calendar year, mode of HIV transmission, baseline CD4 cell
count, and baseline viral load.
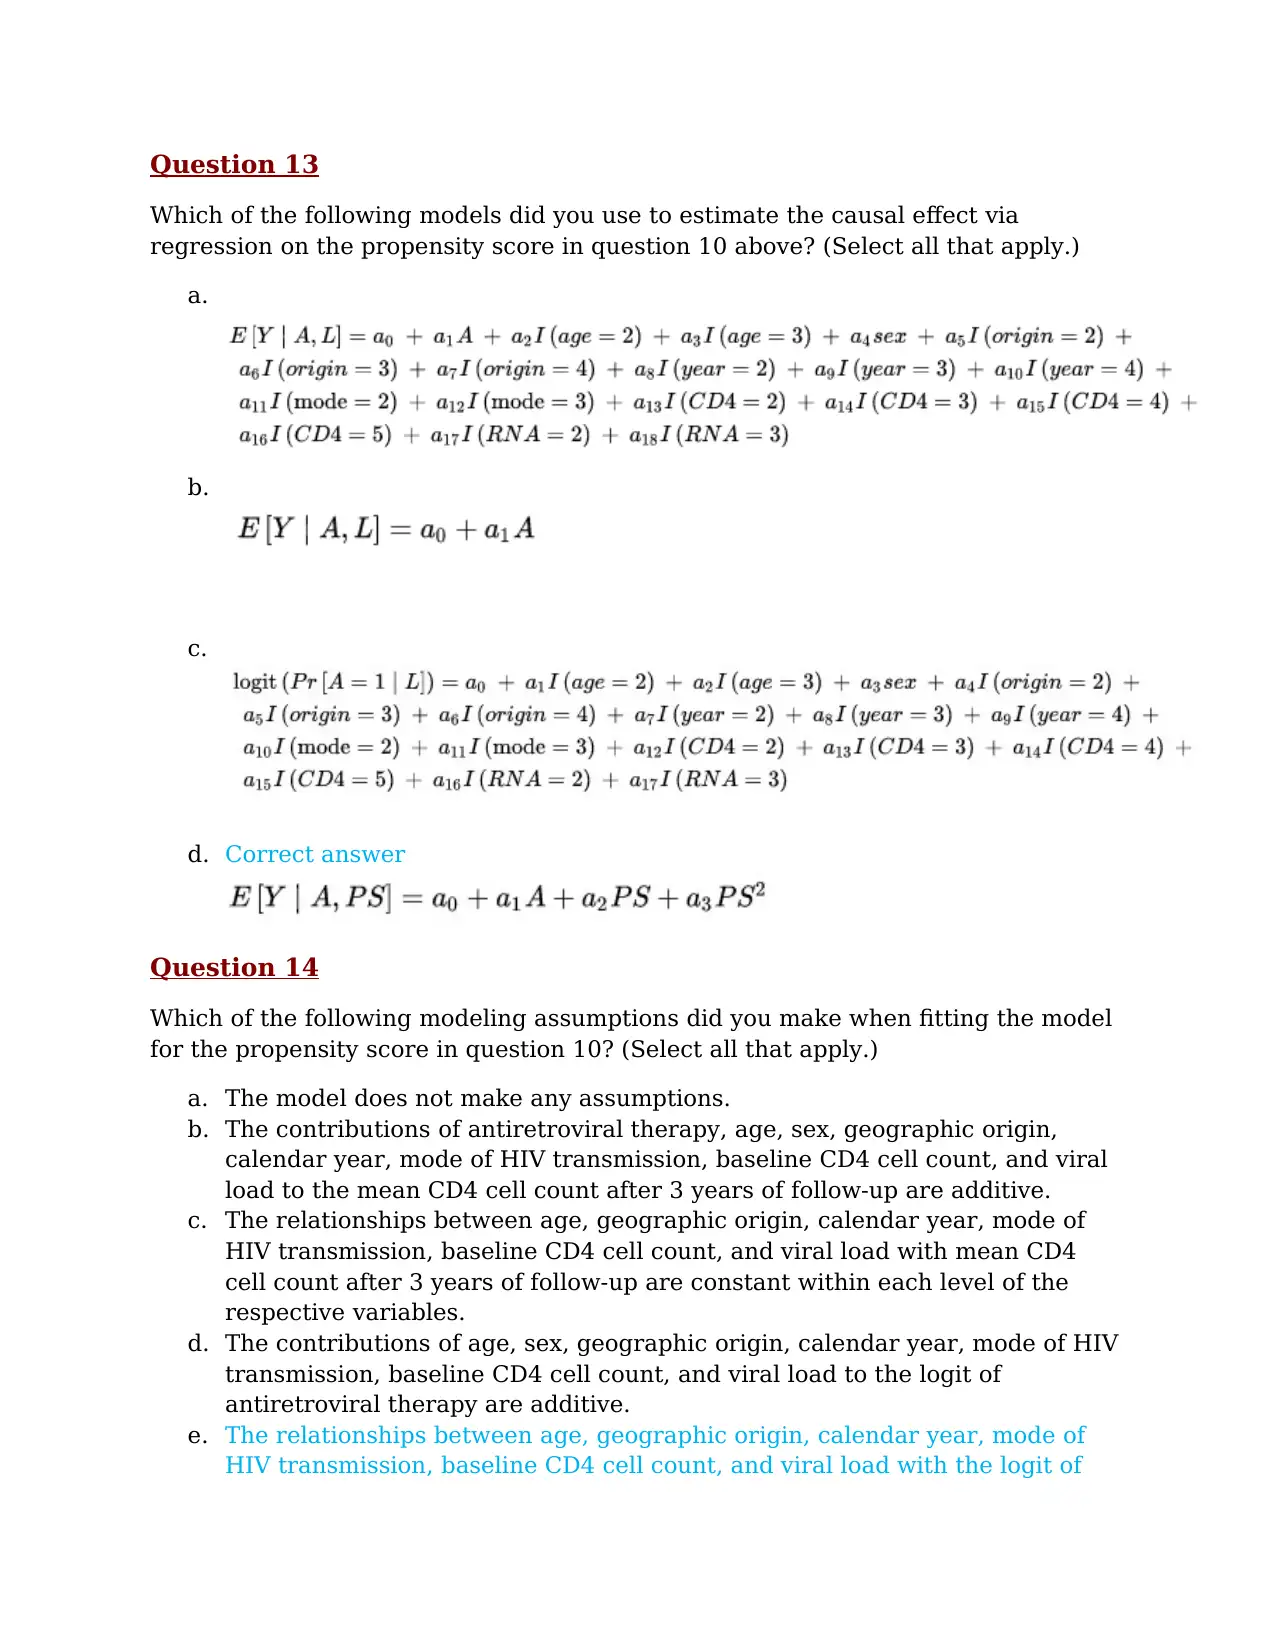
Question 13
Which of the following models did you use to estimate the causal effect via
regression on the propensity score in question 10 above? (Select all that apply.)
a.
b.
c.
d. Correct answer
Question 14
Which of the following modeling assumptions did you make when fitting the model
for the propensity score in question 10? (Select all that apply.)
a. The model does not make any assumptions.
b. The contributions of antiretroviral therapy, age, sex, geographic origin,
calendar year, mode of HIV transmission, baseline CD4 cell count, and viral
load to the mean CD4 cell count after 3 years of follow-up are additive.
c. The relationships between age, geographic origin, calendar year, mode of
HIV transmission, baseline CD4 cell count, and viral load with mean CD4
cell count after 3 years of follow-up are constant within each level of the
respective variables.
d. The contributions of age, sex, geographic origin, calendar year, mode of HIV
transmission, baseline CD4 cell count, and viral load to the logit of
antiretroviral therapy are additive.
e. The relationships between age, geographic origin, calendar year, mode of
HIV transmission, baseline CD4 cell count, and viral load with the logit of
⊘ This is a preview!⊘
Do you want full access?
Subscribe today to unlock all pages.
Trusted by 1+ million students worldwide
antiretroviral therapy are constant within each level of the respective
variables.
f. The relationship between the propensity score and mean CD4 cell count
after 3 years of follow-up is quadratic.
g. The relationship between the propensity score and mean CD4 cell count
after 3 years of follow-up is linear.
h. The contributions of antiretroviral therapy and the propensity score
(squared, if applicable) to the mean CD4 cell count after 3 years of follow-up
are additive.
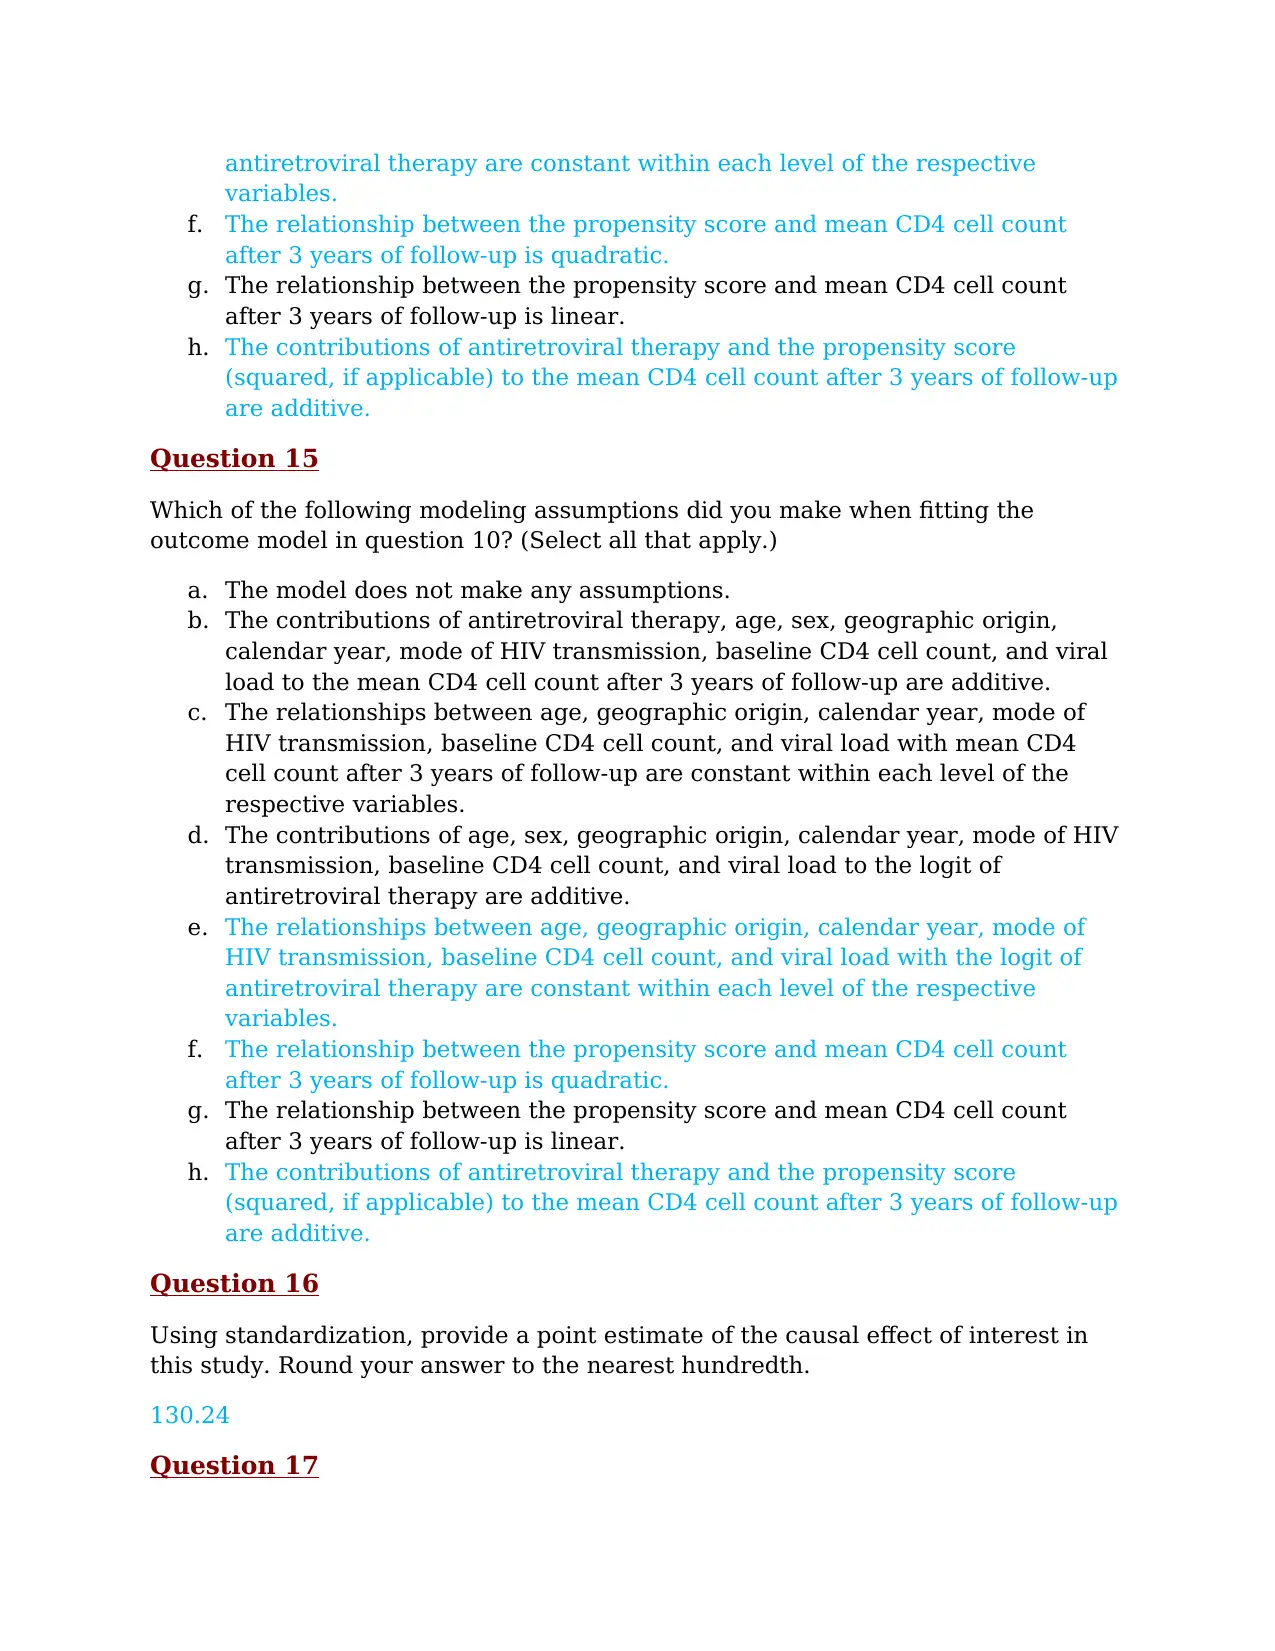
Question 15
Which of the following modeling assumptions did you make when fitting the
outcome model in question 10? (Select all that apply.)
a. The model does not make any assumptions.
b. The contributions of antiretroviral therapy, age, sex, geographic origin,
calendar year, mode of HIV transmission, baseline CD4 cell count, and viral
load to the mean CD4 cell count after 3 years of follow-up are additive.
c. The relationships between age, geographic origin, calendar year, mode of
HIV transmission, baseline CD4 cell count, and viral load with mean CD4
cell count after 3 years of follow-up are constant within each level of the
respective variables.
d. The contributions of age, sex, geographic origin, calendar year, mode of HIV
transmission, baseline CD4 cell count, and viral load to the logit of
antiretroviral therapy are additive.
e. The relationships between age, geographic origin, calendar year, mode of
HIV transmission, baseline CD4 cell count, and viral load with the logit of
antiretroviral therapy are constant within each level of the respective
variables.
f. The relationship between the propensity score and mean CD4 cell count
after 3 years of follow-up is quadratic.
g. The relationship between the propensity score and mean CD4 cell count
after 3 years of follow-up is linear.
h. The contributions of antiretroviral therapy and the propensity score
(squared, if applicable) to the mean CD4 cell count after 3 years of follow-up
are additive.
Question 16
Using standardization, provide a point estimate of the causal effect of interest in
this study. Round your answer to the nearest hundredth.
130.24
Question 17
variables.
f. The relationship between the propensity score and mean CD4 cell count
after 3 years of follow-up is quadratic.
g. The relationship between the propensity score and mean CD4 cell count
after 3 years of follow-up is linear.
h. The contributions of antiretroviral therapy and the propensity score
(squared, if applicable) to the mean CD4 cell count after 3 years of follow-up
are additive.
Question 15
Which of the following modeling assumptions did you make when fitting the
outcome model in question 10? (Select all that apply.)
a. The model does not make any assumptions.
b. The contributions of antiretroviral therapy, age, sex, geographic origin,
calendar year, mode of HIV transmission, baseline CD4 cell count, and viral
load to the mean CD4 cell count after 3 years of follow-up are additive.
c. The relationships between age, geographic origin, calendar year, mode of
HIV transmission, baseline CD4 cell count, and viral load with mean CD4
cell count after 3 years of follow-up are constant within each level of the
respective variables.
d. The contributions of age, sex, geographic origin, calendar year, mode of HIV
transmission, baseline CD4 cell count, and viral load to the logit of
antiretroviral therapy are additive.
e. The relationships between age, geographic origin, calendar year, mode of
HIV transmission, baseline CD4 cell count, and viral load with the logit of
antiretroviral therapy are constant within each level of the respective
variables.
f. The relationship between the propensity score and mean CD4 cell count
after 3 years of follow-up is quadratic.
g. The relationship between the propensity score and mean CD4 cell count
after 3 years of follow-up is linear.
h. The contributions of antiretroviral therapy and the propensity score
(squared, if applicable) to the mean CD4 cell count after 3 years of follow-up
are additive.
Question 16
Using standardization, provide a point estimate of the causal effect of interest in
this study. Round your answer to the nearest hundredth.
130.24
Question 17
Paraphrase This Document
Need a fresh take? Get an instant paraphrase of this document with our AI Paraphraser

Which of the following methods would you use to obtain a valid 95% confidence
interval for the causal effect of interest using standardization?
a. The 95% confidence intervals obtained from the regression output are valid
when using standardization.
b. It is not possible to obtain valid 95% confidence intervals when using
standardization.
c. Bootstrapping is required to obtain valid 95% confidence intervals when
using standardization. Bootstrapping involves splitting the data into many
smaller samples and calculating the standardized estimate in each sample.
The distribution of these estimates is used to determine the confidence
interval.
d. Bootstrapping is required to obtain valid 95% confidence intervals when
using standardization. Bootstrapping involves sampling with replacement
from the initial dataset a new sample of equal size to the original sample and
calculating the standardized estimate in that sample. The distribution of
estimates across a large number of samples is used to determine the
confidence interval.
Question 18
Interpret the point estimate that you estimated in question 16 in plain and
unambiguous English that your uncle can understand. Fill in the blanks.
After 3 years of follow-up, the average CD4 cell count among those who received
antiretroviral therapy was 130.24 cells/ul higher than the average CD4 cell count
among those who did not received antiretroviral treatment marginally.
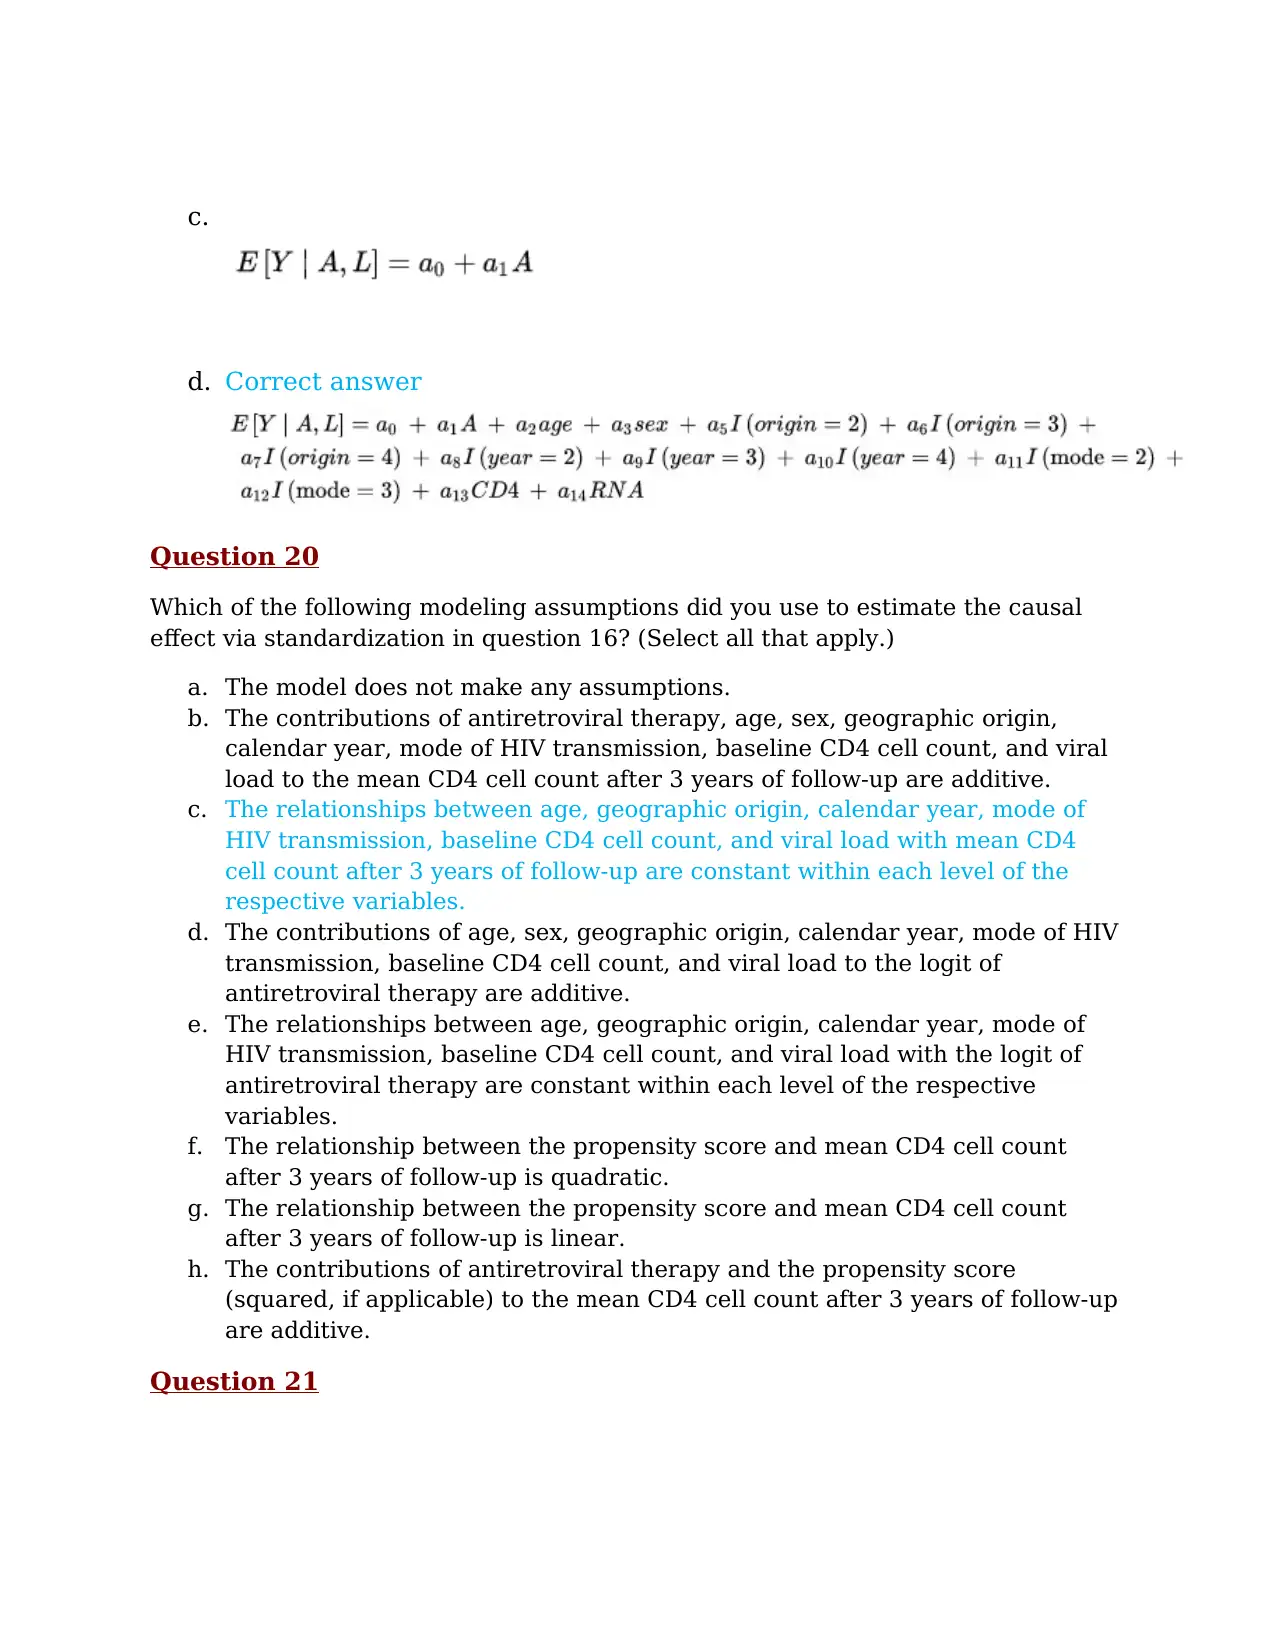
Question 19
Which of the following models did you use to estimate the causal effect via
standardization in question 16 above? (Select all that apply.)
a.
b.
interval for the causal effect of interest using standardization?
a. The 95% confidence intervals obtained from the regression output are valid
when using standardization.
b. It is not possible to obtain valid 95% confidence intervals when using
standardization.
c. Bootstrapping is required to obtain valid 95% confidence intervals when
using standardization. Bootstrapping involves splitting the data into many
smaller samples and calculating the standardized estimate in each sample.
The distribution of these estimates is used to determine the confidence
interval.
d. Bootstrapping is required to obtain valid 95% confidence intervals when
using standardization. Bootstrapping involves sampling with replacement
from the initial dataset a new sample of equal size to the original sample and
calculating the standardized estimate in that sample. The distribution of
estimates across a large number of samples is used to determine the
confidence interval.
Question 18
Interpret the point estimate that you estimated in question 16 in plain and
unambiguous English that your uncle can understand. Fill in the blanks.
After 3 years of follow-up, the average CD4 cell count among those who received
antiretroviral therapy was 130.24 cells/ul higher than the average CD4 cell count
among those who did not received antiretroviral treatment marginally.
Question 19
Which of the following models did you use to estimate the causal effect via
standardization in question 16 above? (Select all that apply.)
a.
b.
c.
d. Correct answer
Question 20
Which of the following modeling assumptions did you use to estimate the causal
effect via standardization in question 16? (Select all that apply.)
a. The model does not make any assumptions.
b. The contributions of antiretroviral therapy, age, sex, geographic origin,
calendar year, mode of HIV transmission, baseline CD4 cell count, and viral
load to the mean CD4 cell count after 3 years of follow-up are additive.
c. The relationships between age, geographic origin, calendar year, mode of
HIV transmission, baseline CD4 cell count, and viral load with mean CD4
cell count after 3 years of follow-up are constant within each level of the
respective variables.
d. The contributions of age, sex, geographic origin, calendar year, mode of HIV
transmission, baseline CD4 cell count, and viral load to the logit of
antiretroviral therapy are additive.
e. The relationships between age, geographic origin, calendar year, mode of
HIV transmission, baseline CD4 cell count, and viral load with the logit of
antiretroviral therapy are constant within each level of the respective
variables.
f. The relationship between the propensity score and mean CD4 cell count
after 3 years of follow-up is quadratic.
g. The relationship between the propensity score and mean CD4 cell count
after 3 years of follow-up is linear.
h. The contributions of antiretroviral therapy and the propensity score
(squared, if applicable) to the mean CD4 cell count after 3 years of follow-up
are additive.
Question 21
⊘ This is a preview!⊘
Do you want full access?
Subscribe today to unlock all pages.
Trusted by 1+ million students worldwide

Using inverse probability weighting using non-stabilized weights, provide a point
estimate of the causal effect of interest in this study. Round your answer to the
nearest hundredth.
61.59
Question 22
Using inverse probability weighting using non-stabilized weights, provide a valid
95% confidence interval for the causal effect of interest you estimated in question
21. Round your answer to the nearest hundredth.
Upper bound= 1.32
Lower bound= 2.20
Question 23
Interpret the point estimate that you estimated in question 21 in plain and
unambiguous English that your uncle can understand. Fill in the blanks.
After 3 years of follow-up, the average CD4 cell count among those who received
antiretroviral therapy was 61.59 cells/ul higher than the average CD4 cell count
among those who did not received antiretroviral treatment marginally.
Question 24
Which of the following models did you use to estimate the causal effect via inverse
probability weighting using non-stabilized weights in question 21 above? (Select all
that apply.)
a.
b.
c. Correct answer
Paraphrase This Document
Need a fresh take? Get an instant paraphrase of this document with our AI Paraphraser

d.
Question 25
Which of the following modeling assumptions did you use to fit the model for the
inverse probability weights in question 21? (Select all that apply.)
a. The model does not make any assumptions.
b. The contributions of antiretroviral therapy, age, sex, geographic origin,
calendar year, mode of HIV transmission, baseline CD4 cell count, and viral
load to the mean CD4 cell count after 3 years of follow-up are additive.
c. The relationships between age, geographic origin, calendar year, mode of
HIV transmission, baseline CD4 cell count, and viral load with mean CD4
cell count after 3 years of follow-up are constant within each level of the
respective variables.
d. The contributions of age, sex, geographic origin, calendar year, mode of HIV
transmission, baseline CD4 cell count, and viral load to the logit of
antiretroviral therapy are additive.
e. The relationships between age, geographic origin, calendar year, mode of
HIV transmission, baseline CD4 cell count, and viral load with the logit of
antiretroviral therapy are constant within each level of the respective
variables.
f. The relationship between the propensity score and mean CD4 cell count
after 3 years of follow-up is quadratic.
g. The relationship between the propensity score and mean CD4 cell count
after 3 years of follow-up is linear.
h. The contributions of antiretroviral therapy and the propensity score
(squared, if applicable) to the mean CD4 cell count after 3 years of follow-up
are additive.
Question 26
Which of the following modeling assumptions did you use to fit the outcome model
in question 21? (Select all that apply.)
a. The model does not make any assumptions.
b. The contributions of antiretroviral therapy, age, sex, geographic origin,
calendar year, mode of HIV transmission, baseline CD4 cell count, and viral
load to the mean CD4 cell count after 3 years of follow-up are additive.
c. The relationships between age, geographic origin, calendar year, mode of
HIV transmission, baseline CD4 cell count, and viral load with mean CD4
cell count after 3 years of follow-up are constant within each level of the
respective variables.
d. The contributions of age, sex, geographic origin, calendar year, mode of HIV
transmission, baseline CD4 cell count, and viral load to the logit of
antiretroviral therapy are additive.
e. The relationships between age, geographic origin, calendar year, mode of
HIV transmission, baseline CD4 cell count, and viral load with the logit of
antiretroviral therapy are constant within each level of the respective
variables.
f. The relationship between the propensity score and mean CD4 cell count
after 3 years of follow-up is quadratic.
g. The relationship between the propensity score and mean CD4 cell count
after 3 years of follow-up is linear.
h. The contributions of antiretroviral therapy and the propensity score
(squared, if applicable) to the mean CD4 cell count after 3 years of follow-up
are additive.
Question 27
If any of the modeling approaches you used in questions 5, 10, 16, and 21 require
additional assumptions to consistently estimate the causal effect E[Ya=1] − E[Ya=0],
select the required assumptions below and say for which approach they are
required. (Select all that apply.)
a. We must additionally assume no effect modification for the effect of
antiretroviral therapy on CD4 cell count at 3 years by any of the measured
baseline variables for the modeling approach used in question 5 (outcome
regression)
b. We must additionally assume no effect modification for the effect of
antiretroviral therapy on CD4 cell count at 3 years by any of the measured
baseline variables for the modeling approach used in question 10
(regression on the propensity score).
c. We must additionally assume no effect modification for the effect of
antiretroviral therapy on CD4 cell count at 3 years by the propensity score
for the modeling approach used in question 10 (regression on the propensity
score).
d. We must additionally assume no effect modification for the effect of
antiretroviral therapy on CD4 cell count at 3 years by any of the measured
baseline variables for the modeling approach used in question 16
(standardization).
⊘ This is a preview!⊘
Do you want full access?
Subscribe today to unlock all pages.
Trusted by 1+ million students worldwide
1 out of 20


Your All-in-One AI-Powered Toolkit for Academic Success.
+13062052269
info@desklib.com
Available 24*7 on WhatsApp / Email
![[object Object]](/_next/static/media/star-bottom.7253800d.svg)
Unlock your academic potential
Copyright © 2020–2026 A2Z Services. All Rights Reserved. Developed and managed by ZUCOL.