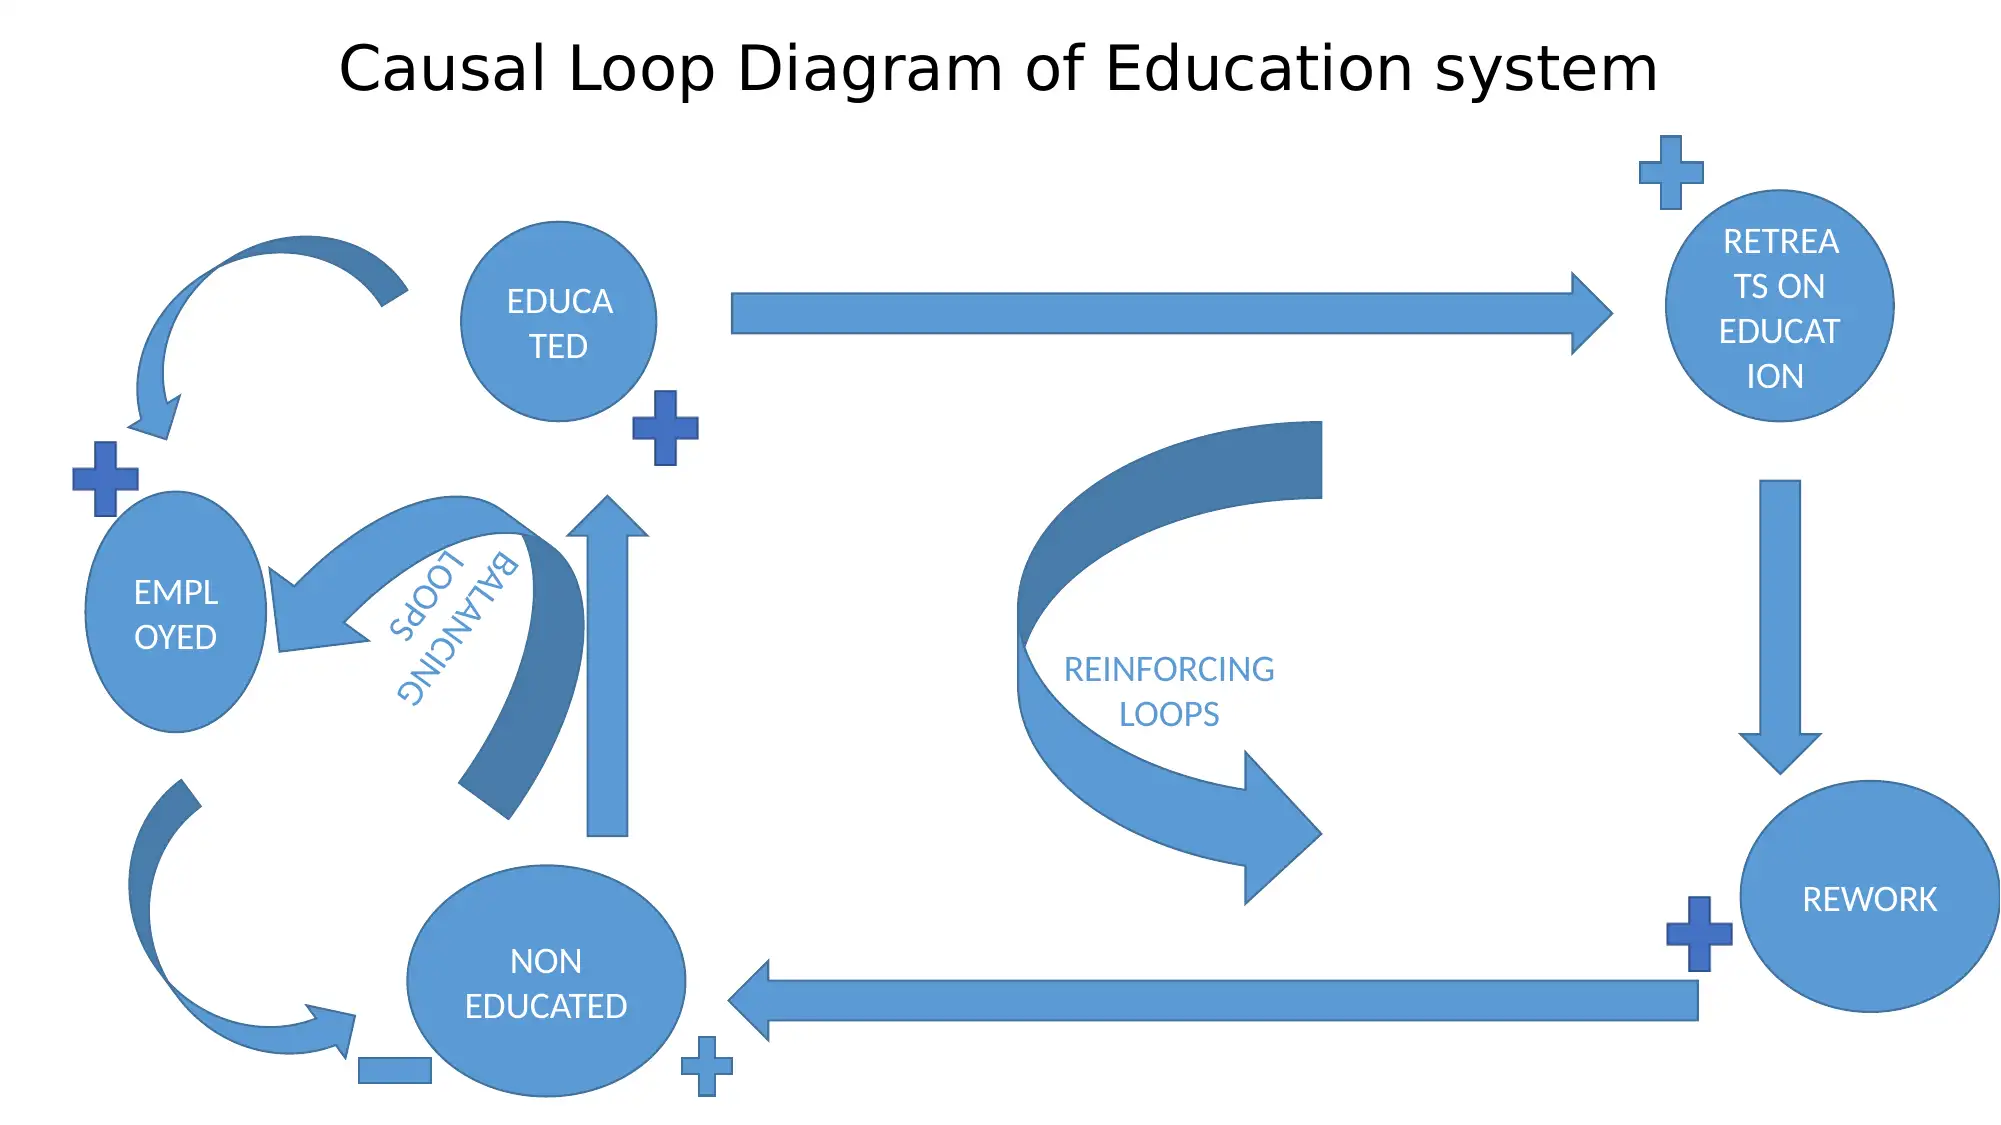
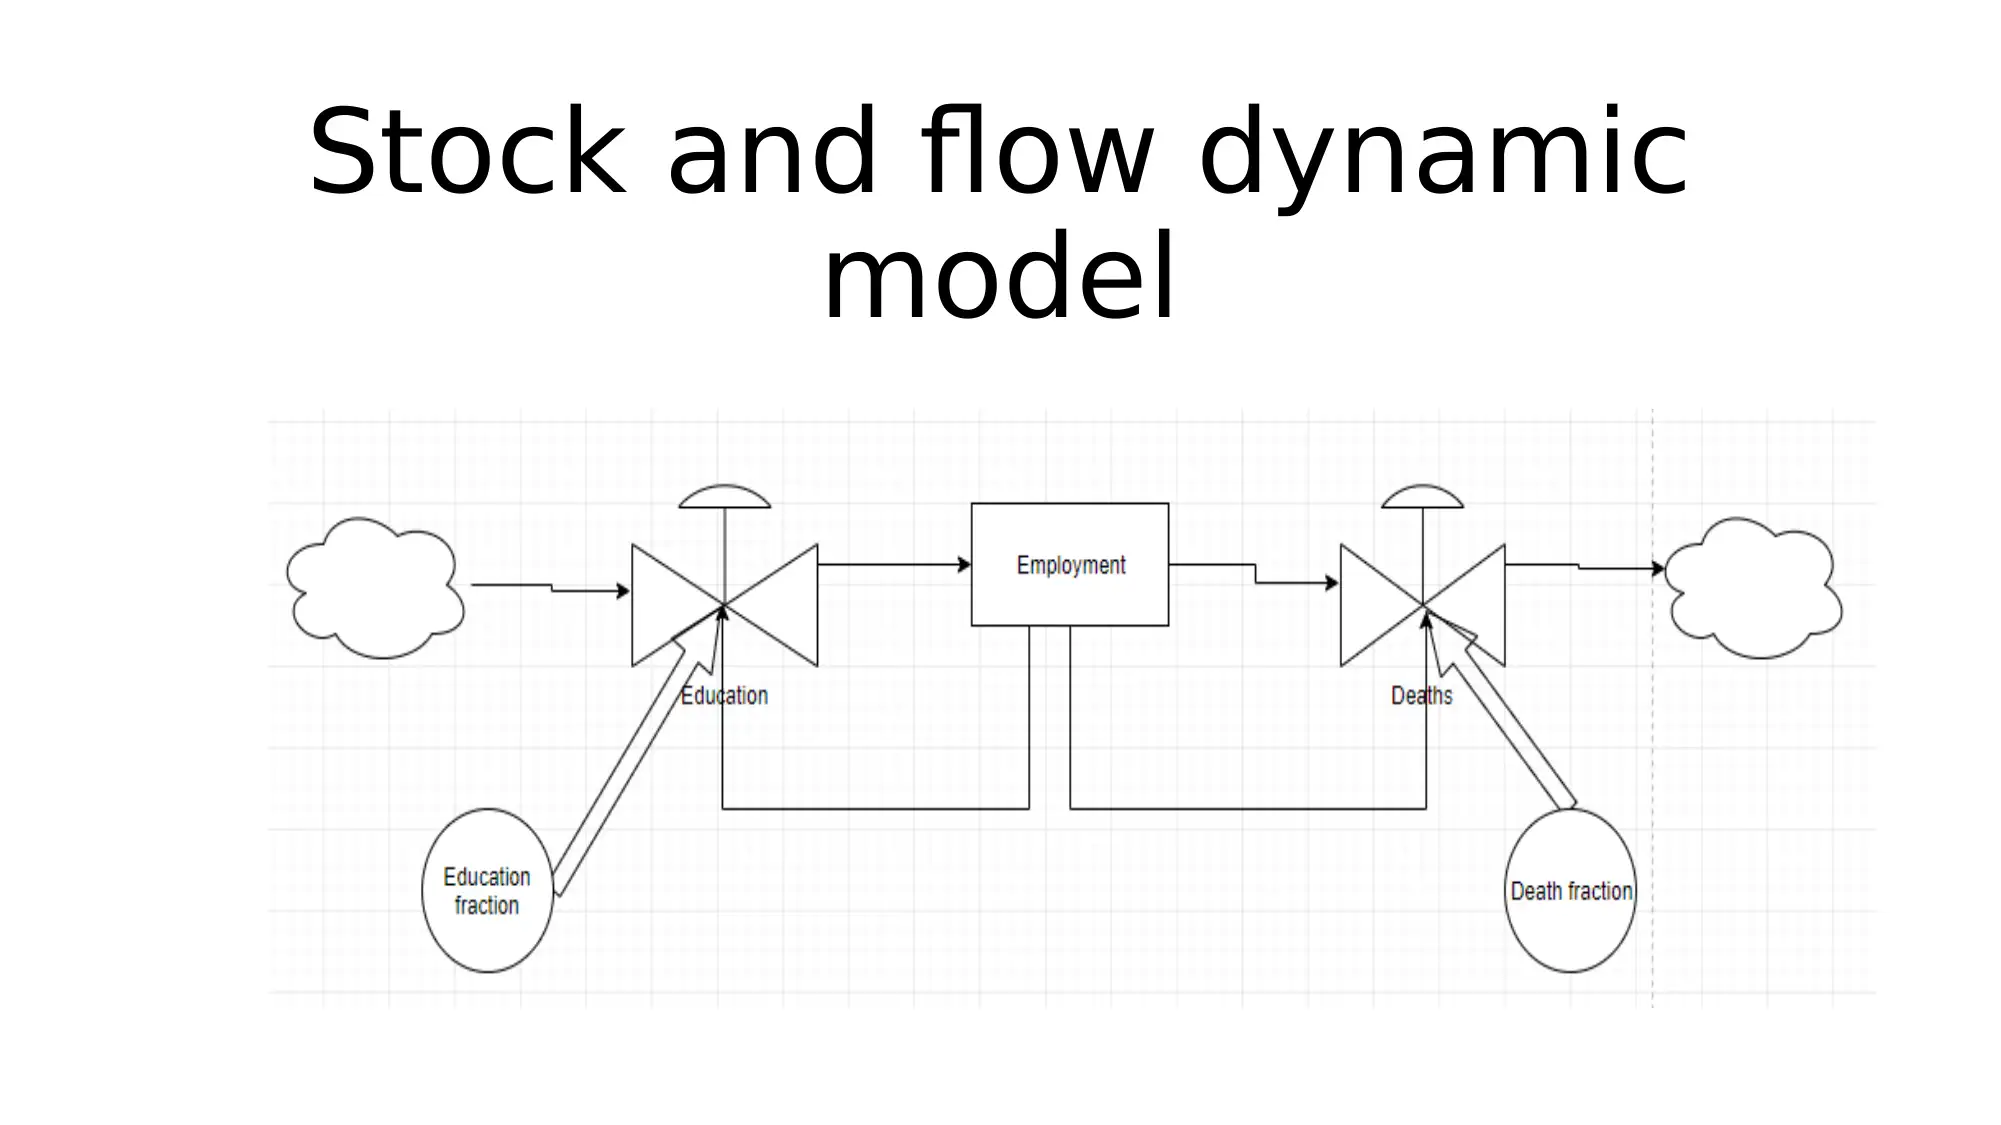
Causal Loop Diagram and Dynamic Model of Education and Employment

Verified

Added on  2022/10/15

|9
|473
|20
Project
AI Summary
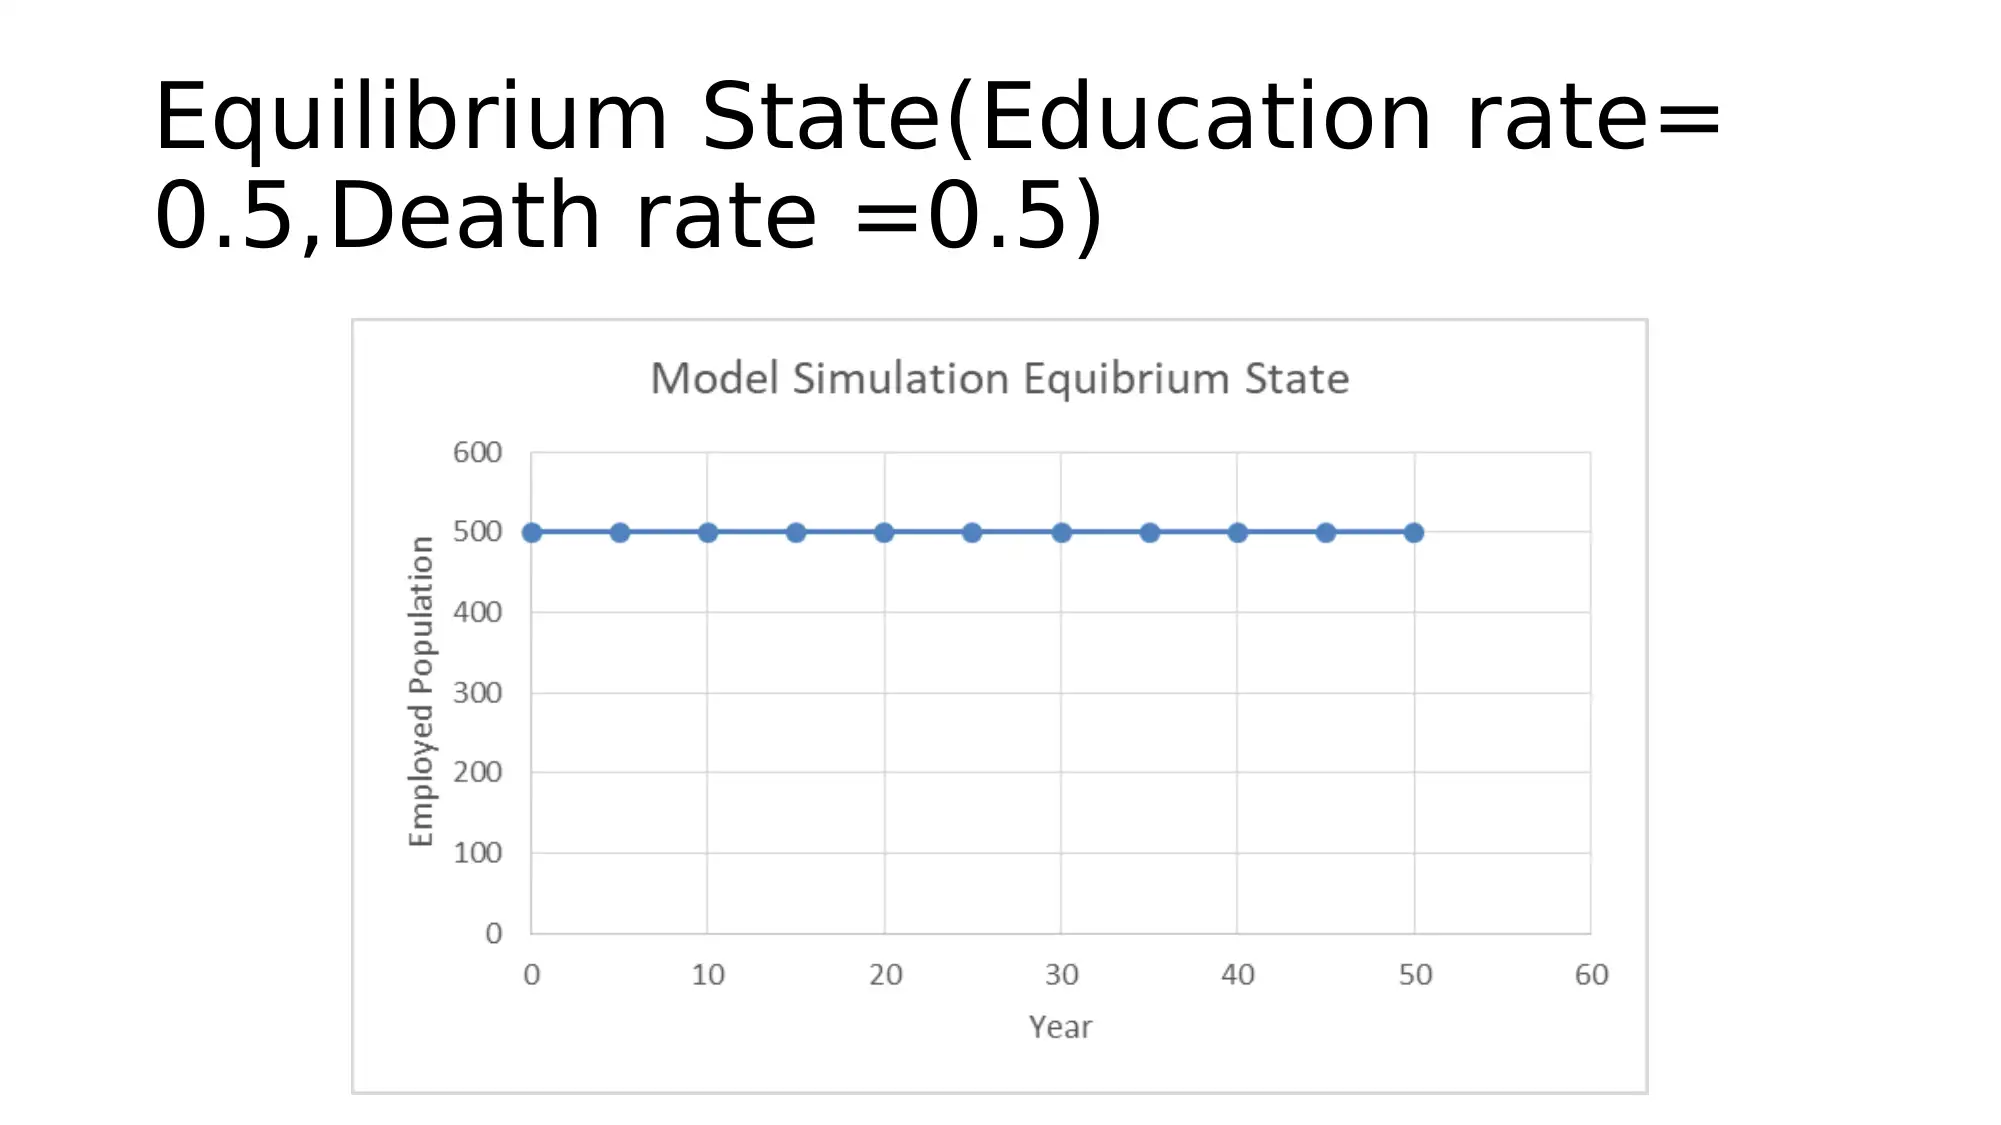
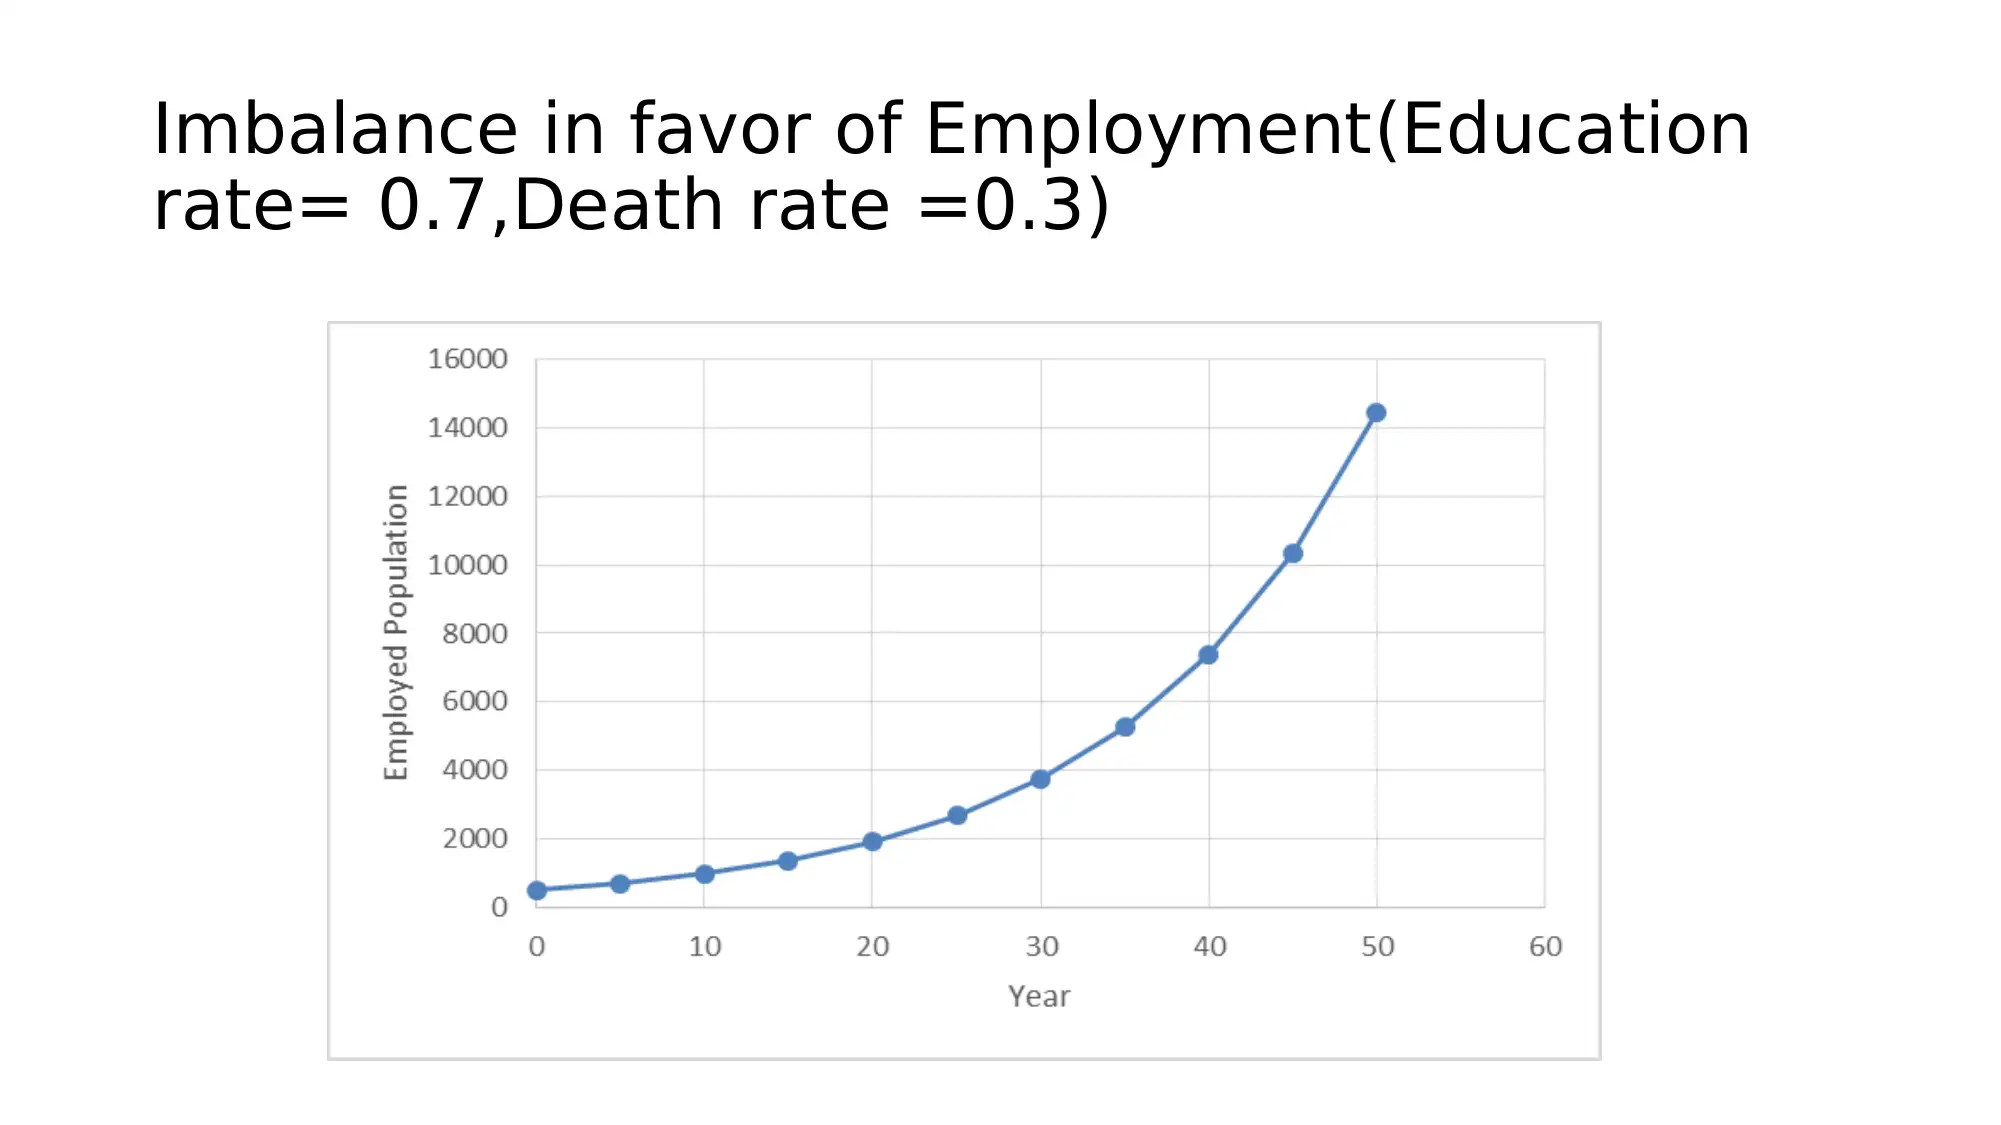
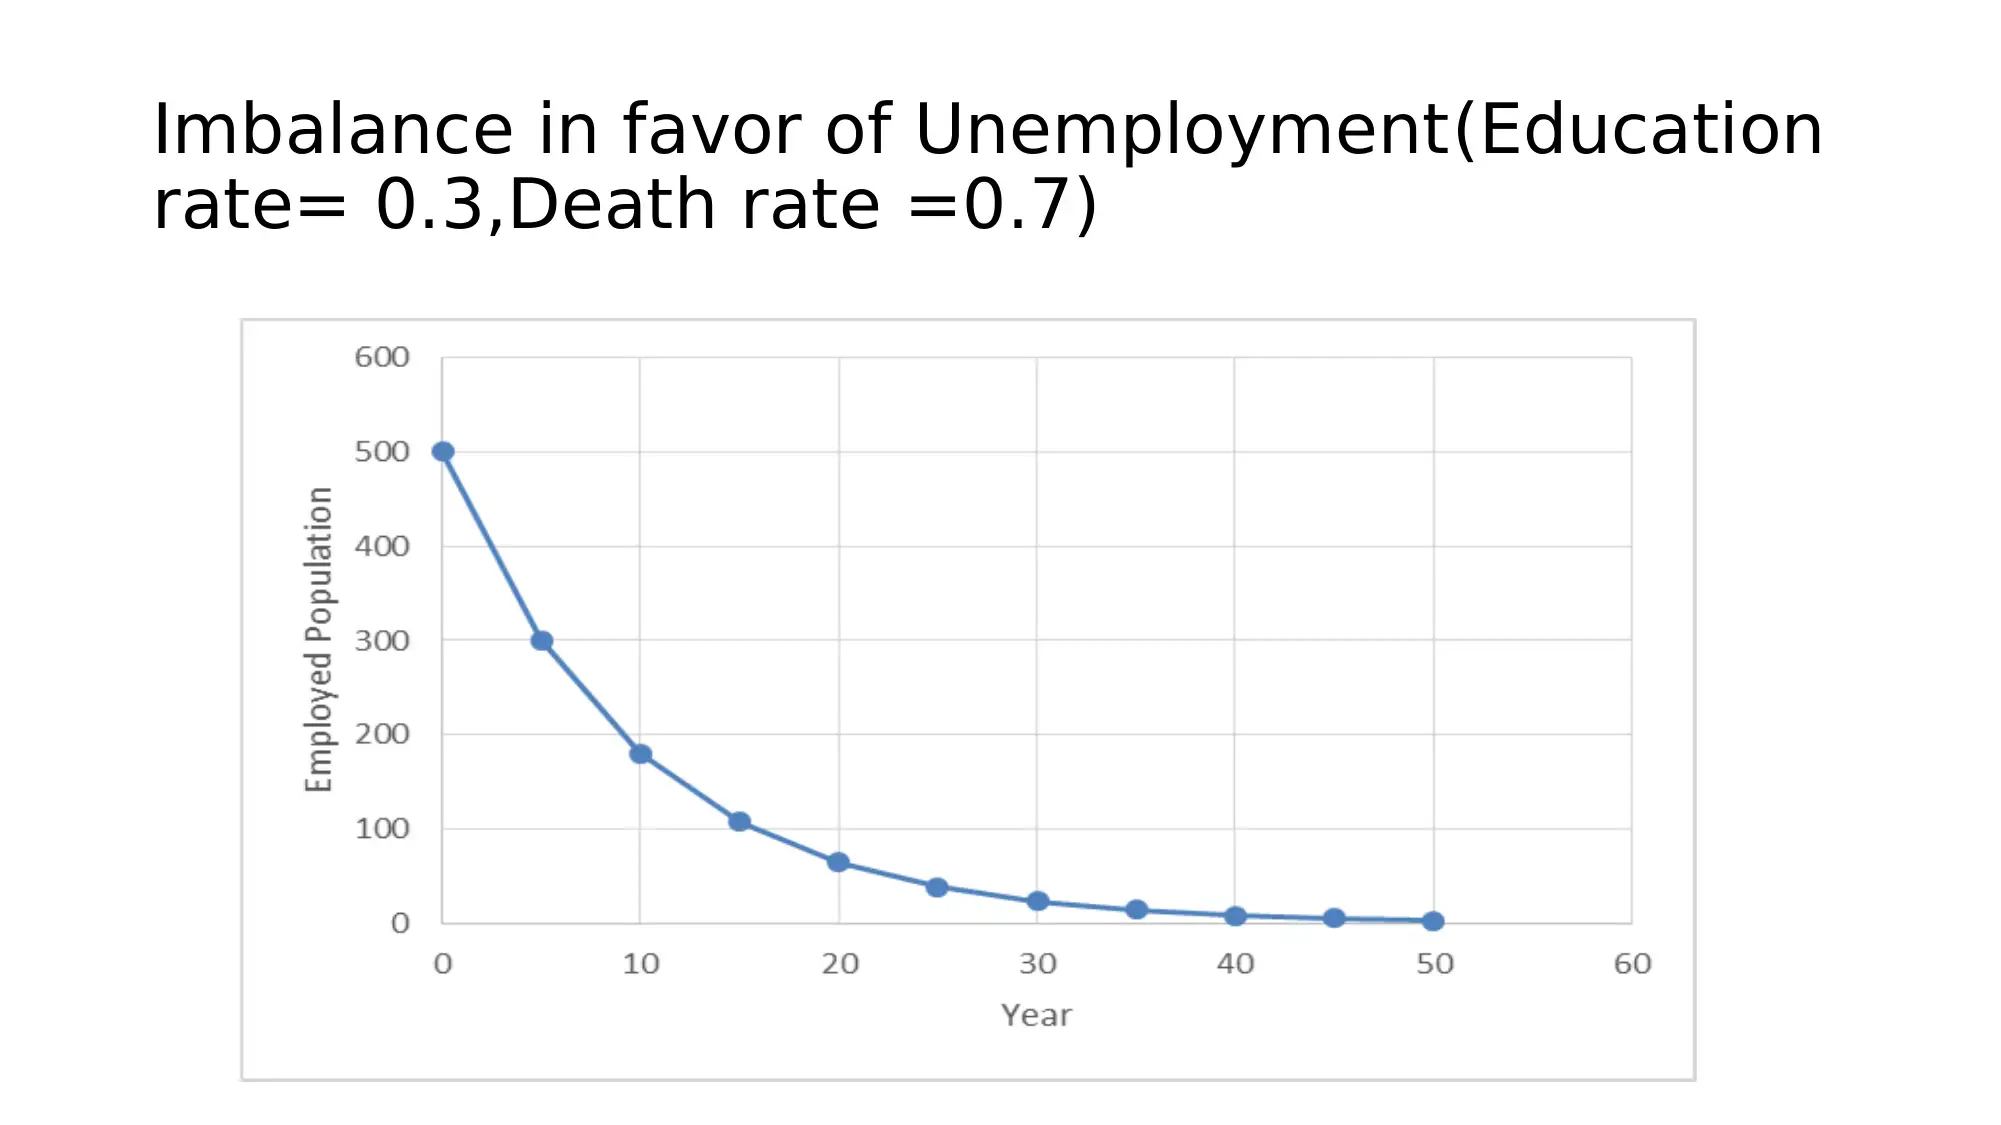
This project presents a dynamic model of the education system, exploring the relationship between employment, education, and death rates. It begins with a causal loop diagram illustrating the interconnectedness of these factors. The project then introduces a stock and flow dynamic model, simulated using Excel, to analyze how changes in education and death rates impact the employment levels within a hypothetical population. The model assumes an initial state of full employment and assesses the effects of varying education and death fractions over time. The project includes an equilibrium state where education and death rates are balanced, and examines scenarios where either education or death rates are dominant, leading to shifts in employment levels. The project highlights the limitations of the model, acknowledging the simplified assumptions compared to real-world complexities. References from academic journals are provided to support the methodology and analysis.
Document Page
Causal Loop Diagram of Education system
EMPL
OYED
NON
EDUCATED
EDUCA
TED
RETREA
TS ON
EDUCAT
ION
REWORK
BALANCING
LOOPS
REINFORCING
LOOPS
tabler-icon-diamond-filled.svg

Paraphrase This Document

Need a fresh take? Get an instant paraphrase of this document with our AI Paraphraser
Document Page
Stock and flow dynamic
model
Document Page
Description of Dynamic model
The Stock and Flow dynamic model given in the previous slide
represents the employment status of a hypothetical population in a
certain region. Here it is assumed that a certain percentage of the
initially employed people arrives at the city and opts for education. All
the educated people gets employed in next 5 years. Also, in that 5 years
a certain percentage of the employed people in the previous year dies.
Hence, the education stock is affected by education fraction and Death
stock is affected by the death fraction.
Document Page
Model Simulation in excel
Now, a dynamic model is created in excel where the initial number of
employed people is taken as 500. The equilibrium state where the
amount of employed people remains the same over years is obtained
when the education fraction or rate is equal to death fraction rate. If
the education fraction rate is more than the death fraction then the
number of employed people increases in each year. The number of
employed people decreases when the death rate is more than the
education rate. This three conditions are shown in next slides.
tabler-icon-diamond-filled.svg

Paraphrase This Document

Need a fresh take? Get an instant paraphrase of this document with our AI Paraphraser
Document Page
Equilibrium State(Education rate=
0.5,Death rate =0.5)
Document Page
Imbalance in favor of Employment(Education
rate= 0.7,Death rate =0.3)
Document Page
Imbalance in favor of Unemployment(Education
rate= 0.3,Death rate =0.7)
tabler-icon-diamond-filled.svg

Paraphrase This Document

Need a fresh take? Get an instant paraphrase of this document with our AI Paraphraser
Document Page
Limitations of model
1) The model assumes a hypothetical population where initially all
people are employed. Also, the new people added to population
and takes education are a certain percentage of the previously
employed people. In real cases these are not valid any population
has employed and unemployed people and all the people added to
population don’t go through education.
2) The percentage of people that chooses education may not be
entirely or necessarily depend on the number of existing employed
people in real cases.
Document Page
References
Dafermos, Y., Nikolaidi, M., & Galanis, G. (2017). A stock-flow-fund ecological
macroeconomic model. Ecological Economics, 131, 191-207.
Inam, A., Adamowski, J., Halbe, J., & Prasher, S. (2015). Using causal loop diagrams
for the initialization of stakeholder engagement in soil salinity management in
agricultural watersheds in developing countries: A case study in the Rechna Doab
watershed, Pakistan. Journal of environmental management, 152, 251-267.
Gordon, R. F. (2017). Using Microsoft Excel to Teach Simulation Concepts to
Business Students. Proceedings of the Northeast Business & Economics
Association.
chevron_up_icon
1 out of 9
circle_padding
hide_on_mobile
zoom_out_icon
[object Object]